
STRAX
Stratis
| تریدر | نوع سیگنال | حد سود/ضرر | زمان انتشار | مشاهده پیام |
|---|---|---|---|---|
No results found. | ||||
Price Chart of Stratis
سود 3 Months :
سیگنالهای Stratis
Filter
Sort messages by
Trader Type
Time Frame

CryptoAnalystSignal
#STRAX/USDT — Descending Triangle at Demand Zone!

#STRAX The price is moving in a descending channel on the 1-hour timeframe. It has reached the lower boundary and is heading towards breaking above it, with a retest of the upper boundary expected. We have a downtrend on the RSI indicator, which has reached near the lower boundary, and an upward rebound is expected. There is a key support zone in green at 0.02060. The price has bounced from this zone multiple times and is expected to bounce again. We have a trend towards consolidation above the 100-period moving average, as we are moving close to it, which supports the upward movement. Entry price: 0.02095 First target: 0.02124 Second target: 0.02172 Third target: 0.02223 Stop loss: Below the support zone in green. Don't forget a simple thing: capital management. For inquiries, please leave a comment. Thank you.#STRAX First target: 0.02124 Reached Second target: 0.02172 Reached Third target: 0.02223 Reached

Alpha-GoldFX
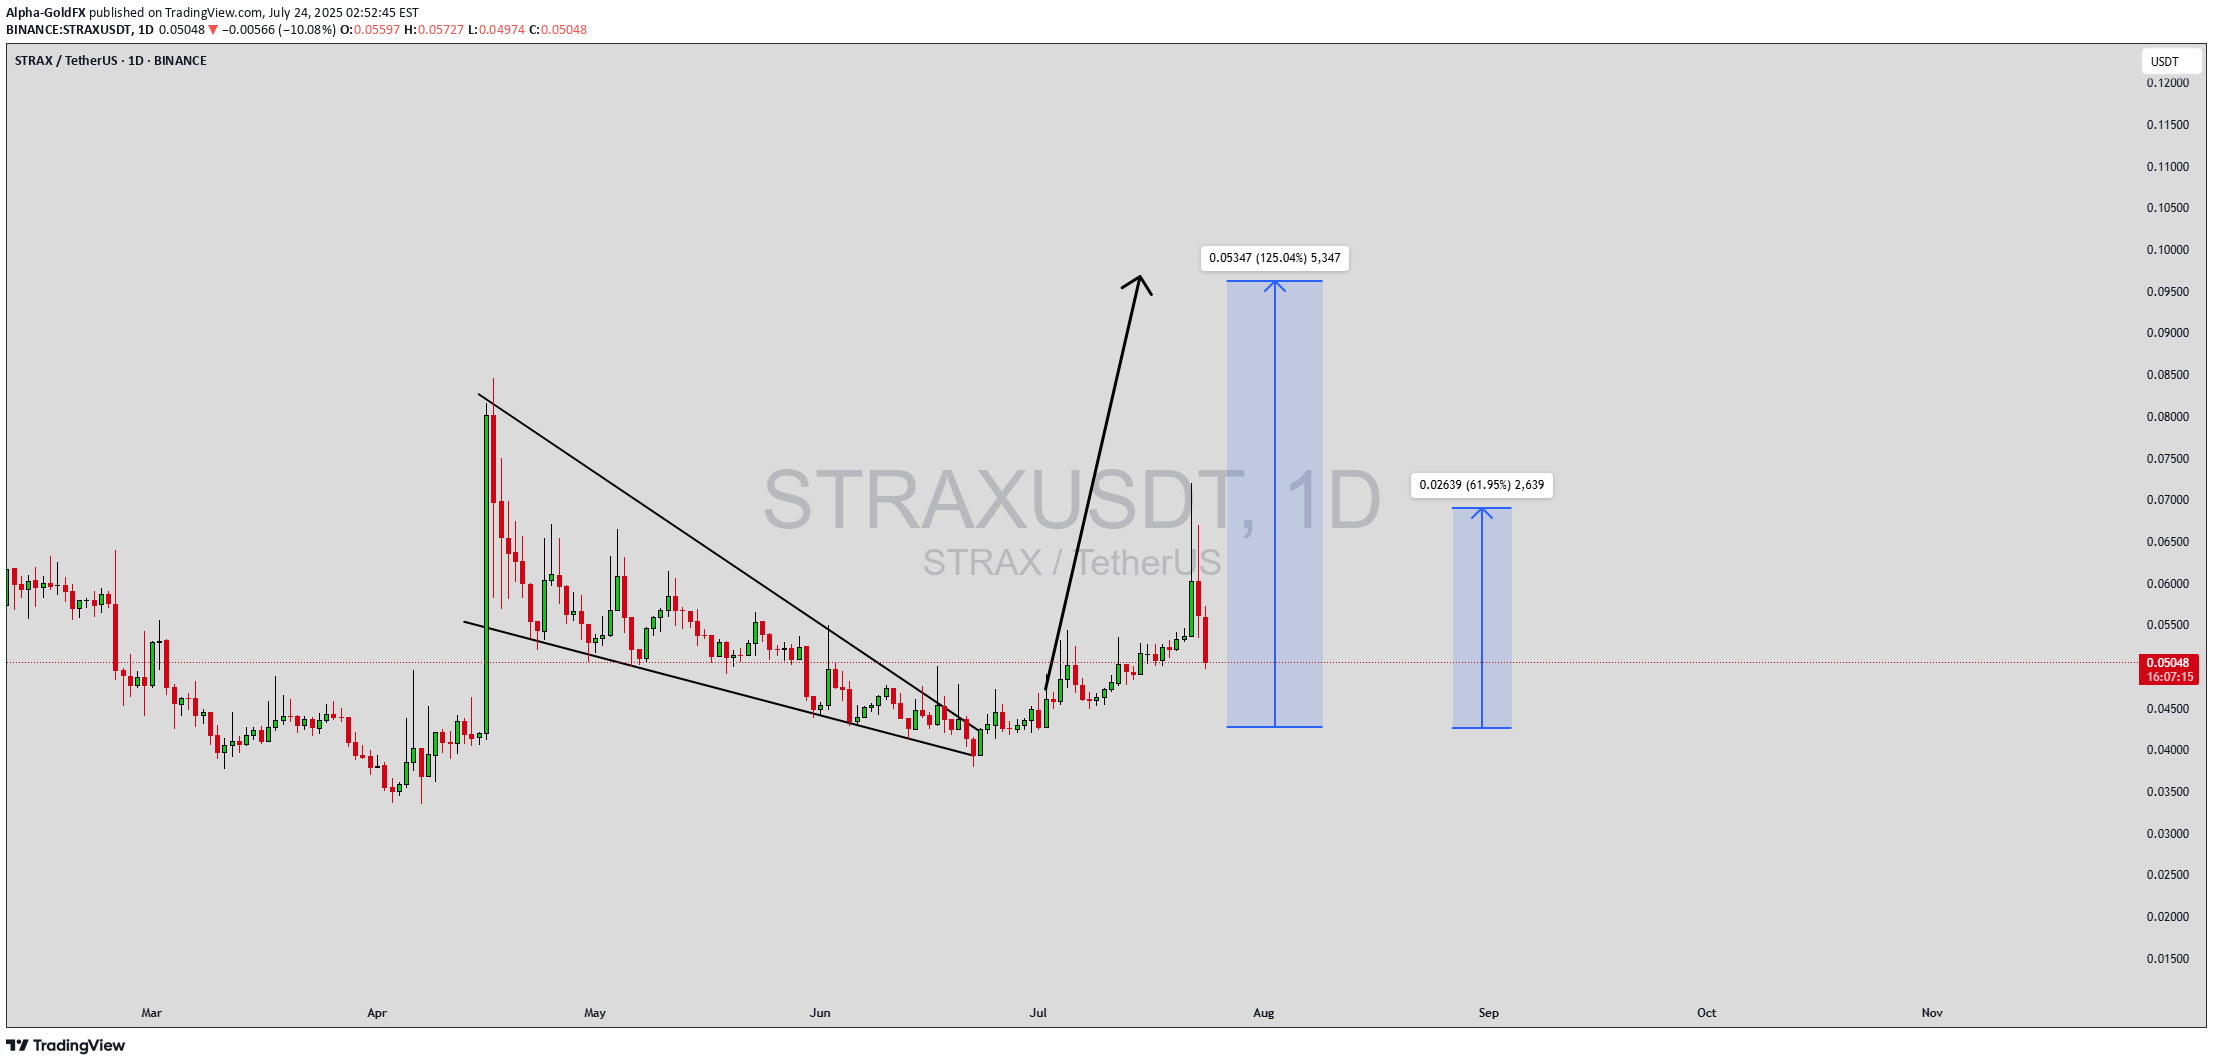
STRAXUSDT Forming Falling Wedge

STRAXUSDT is forming a clear falling wedge pattern, a classic bullish reversal signal that often indicates an upcoming breakout. The price has been consolidating within a narrowing range, suggesting that selling pressure is weakening while buyers are beginning to regain control. With consistent volume confirming accumulation at lower levels, the setup hints at a potential bullish breakout soon. The projected move could lead to an impressive gain of around 140% to 150% once the price breaks above the wedge resistance. This falling wedge pattern is typically seen at the end of downtrends or corrective phases, and it represents a potential shift in market sentiment from bearish to bullish. Traders closely watching STRAXUSDT are noting the strengthening momentum as it nears a breakout zone. The good trading volume adds confidence to this pattern, showing that market participants are positioning early in anticipation of a reversal. Investors’ growing interest in STRAXUSDT reflects rising confidence in the project’s long-term fundamentals and current technical strength. If the breakout confirms with sustained volume, this could mark the start of a fresh bullish leg. Traders might find this a valuable setup for medium-term gains, especially as the wedge pattern completes and buying momentum accelerates. ✅ Show your support by hitting the like button and ✅ Leaving a comment below! (What is your opinion about this Coin?) Your feedback and engagement keep me inspired to share more insightful market analysis with you!

BandForBands
تحلیل قیمت STRAX: پتانسیل رشد بیش از 300 درصدی در انتظار شکست!
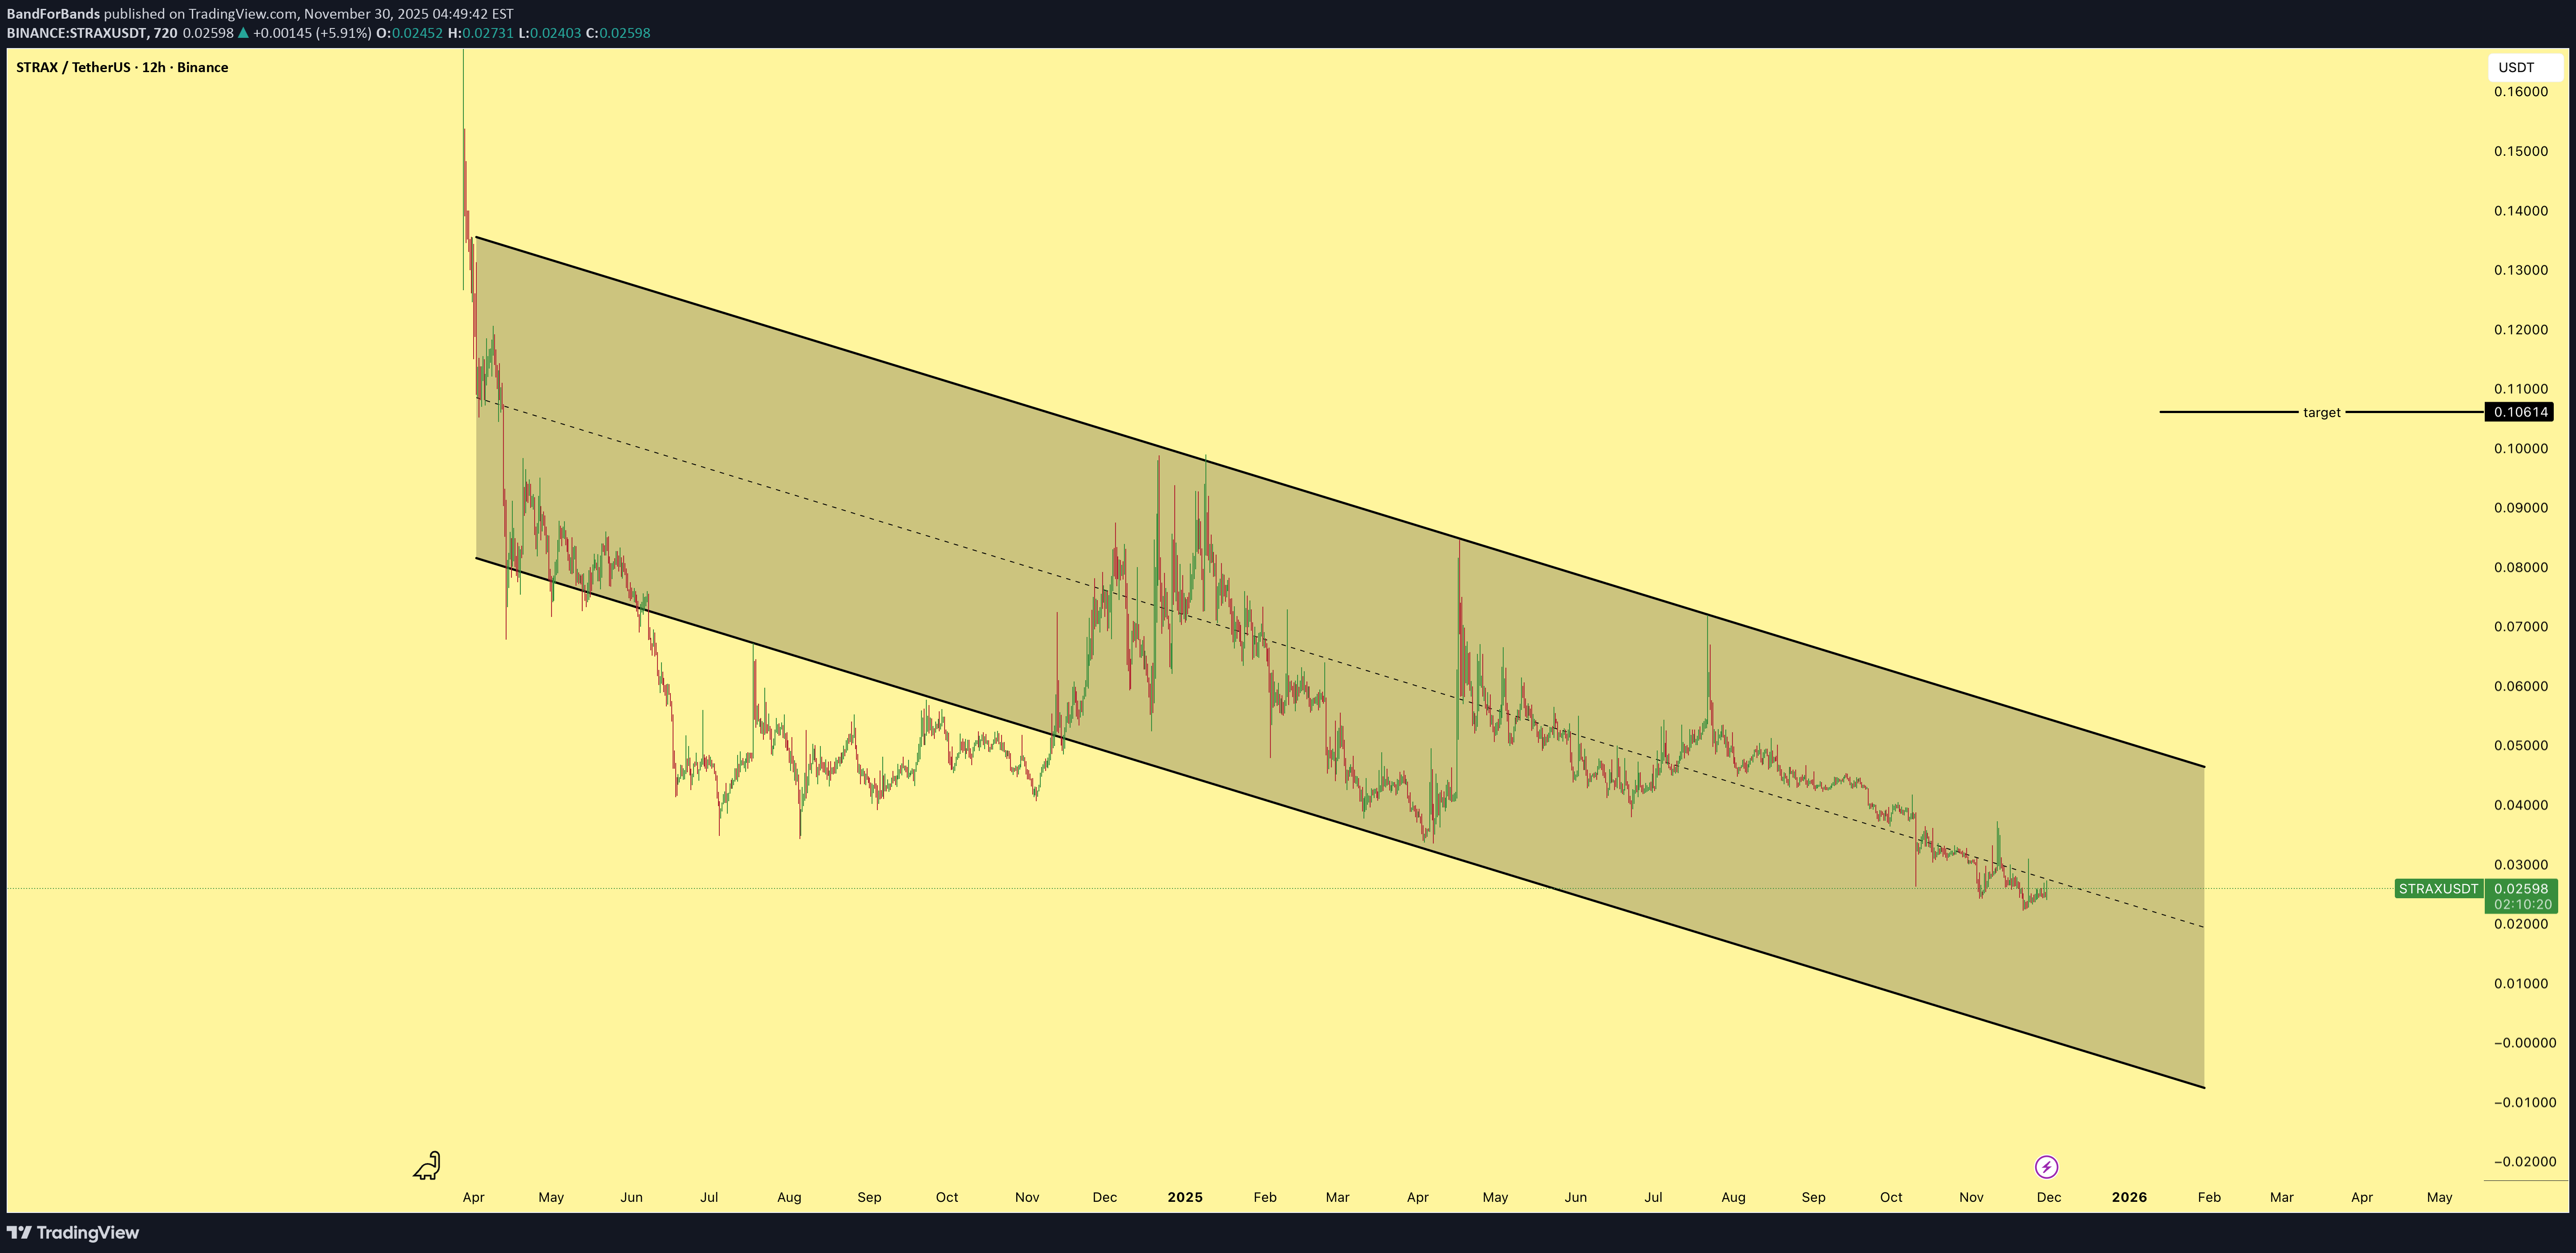
STRAX has been trading inside a descending channel pattern since last year and the structure is tightening. From the current price to the measured target there is more than 300 percent in potential gains once the breakout confirms. The setup is lining up cleanly.
Alpha-GoldFX
STRAXUSDT Forming Descending Wedge
STRAXUSDT is showing strong technical potential as it forms a classic descending wedge pattern on the chart. This pattern is typically viewed as a bullish reversal signal, suggesting that the downtrend may be nearing exhaustion and a breakout to the upside is likely. With the price compressing within the wedge and volume remaining steady, STRAX appears to be coiling for a major move. The current market structure indicates a high-probability setup with an expected gain of 90% to 100%+ if a breakout occurs above the wedge resistance. Descending wedge formations are often found at the end of bearish trends, where sellers begin to lose momentum and buyers start stepping in. As price action narrows, the likelihood of a strong bullish breakout increases, especially when volume starts to rise. STRAXUSDT has been respecting this structure with consistent lower highs and lows, but it is now approaching a critical level where momentum could flip decisively bullish. Investor interest in the STRAX project is also picking up, adding fundamental support to this technical setup. The STRAX ecosystem, known for its flexible blockchain development and support for enterprise-grade applications, has remained active despite broader market volatility. This growing attention from the crypto community, combined with the favorable chart pattern, adds confidence to the bullish outlook. If STRAXUSDT breaks above the descending wedge resistance with confirmation, it could trigger a powerful rally toward higher price levels. Traders watching this setup may find an excellent risk-to-reward opportunity, especially with a solid structure and growing momentum behind it. ✅ Show your support by hitting the like button and ✅ Leaving a comment below! (What is You opinion about this Coin) Your feedback and engagement keep me inspired to share more insightful market analysis with you!

MasterAnanda
Stratis Reveals A Bullish Bias Across The Altcoins

The market is set to resume growing, the proof is in the charts. Stratis (STRAXUSDT) was one of the first projects to move strongly after its 7-April low. Here you can see a 150% jump within 10 days.This type of move always reveals two things. The start of the next bullish cycle and the fact that the bottom is in. Both are one and the same.Once the bottom hits, only growth is possible or else the bottom is not in. Once a new bullish cycle starts, then there can't be any new lows so the last low present on the chart must be the bottom.After the initial bullish breakout we get the classic correction, now two months strong. The correction found support at the same level support was found in November 2024.Here is the interesting part. Stratis was one of the first projects to move strong, seeing it getting ready to produce a new bullish wave, reveals that the market is done with its correction and will resolve to produce rising prices. What one does, the rest follows. Some projects move first though.This is the signal. It is still very early of course, but that is the advantage we can enjoy by looking daily at the charts.I will do a short-term trade-signal for this pair.Thank you for reading.Your support is appreciated.Namaste.
Alpha-GoldFX
STRAXUSDT Forming Falling Wedge

STRAXUSDT is displaying a textbook falling wedge pattern on the daily chart, a formation widely recognized for its bullish reversal potential. After an explosive move upward earlier this quarter, the price has been consolidating in a downward-sloping wedge, tightening near a crucial support level. This type of market structure typically precedes a breakout, and the chart currently projects a potential move of 90% to 100% or more to the upside. This setup is attracting growing interest from traders and investors who understand the significance of wedge breakouts in crypto price action.What adds conviction to this technical setup is the presence of solid volume activity. Despite the correction phase, there has been no major sell-off panic, which often suggests accumulation by smart money. As the pattern tightens and price volatility compresses, a breakout becomes increasingly likely. Once this breakout is confirmed with volume, STRAXUSDT could rally sharply, targeting the projected zone around $0.067 and beyond.STRAX is not just any low-cap altcoin—it is backed by a strong legacy in blockchain infrastructure. As more developers and blockchain-based platforms seek scalability and integration, the utility of projects like STRAX may resurface with renewed momentum. With this kind of structural bullish setup and an improving sentiment across altcoins, STRAXUSDT presents a compelling case for a breakout trader or a short-term investor.Traders watching STRAXUSDT should keep a close eye on breakout confirmation candles and volume spikes in the coming days. Risk-reward is highly favorable at this point in the wedge, making it a timely opportunity in the altcoin segment. The technicals align well with broader market optimism, setting the stage for a possible trend reversal and extended move higher.✅ Show your support by hitting the like button and✅ Leaving a comment below! (What is You opinion about this Coin)Your feedback and engagement keep me inspired to share more insightful market analysis with you!

CryptoWithJames
STRAXUSDT UPDATE

Pattern: Falling Wedge BreakoutCurrent Price: \$0.04890Target Price: \$0.079,Target % Gain: 60.09%Technical Analysis: STRAX has broken out of a falling wedge pattern on the 12H chart with strong bullish momentum. A clear breakout with volume surge indicates potential continuation toward the measured target.Time Frame: 12HRisk Management Tip: Always use proper risk management.

Rasulberdi_Ashiraliyev
STRAX/USDT – Triangle Breakout from Support Zone

STRAX/USDT long trade idea:💡 STRAX/USDT LONG TRADE SETUP (4H Chart)📈 Trade Idea:We're currently seeing STRAX respecting a strong ascending trendline while simultaneously testing a key horizontal support zone (highlighted in orange). Price has also formed a bullish descending triangle breakout pattern, where the current candle is showing signs of rejection from the demand zone.📊 Technical Confluence:- Strong support area between $0.0500 – $0.0510 (historically respected zone).- Price is bouncing off the ascending trendline, indicating bullish strength.- Descending triangle breakout potential to the upside.- Clear risk/reward setup with a favorable R:R ratio.✅ Entry Zone:Around $0.0510 🎯 Target (TP): Around $0.0640 ❌ Stop Loss (SL): Below $0.0485🧠 Trade Logic: This setup is based on the expectation that the support zone and trendline will hold, leading to a breakout of the descending trendline and a potential continuation move to the upside. The structure provides a well-defined invalidation level, making risk management easier.🔔 Always manage your risk and use proper position sizing.
MasterAnanda
Stratis: The Altcoins Bull Market Is Here

Let me show you this price pattern and dynamic because it is great, it reveals what is coming to all of the Altcoins available for trading within the Altcoins market.» Stratis (STRAXUSDT) peaked in December 2024. The same as with the rest of the market.» After this high a correction developed. This is true for 99% of the trading pairs.» There was a major low in February 2025. Another low mid-March 2025. Finally, an All-Time Low happened on the 7th of April. This is true for many other Altcoins with some variations.» After the 7-April market low, prices started to grow slowly. This is where most of the pairs are right now. No new lows but no signification bullish action either, yet.» Now, STRAXUSDT produced a strong bullish breakout just start. This will be true for the entire market and all those pairs that you requested through Your Top Altcoins Choice.» STRAXUSDT is now up 110% since the 7-April low and 73% within the last 48 hours. A strong bullish breakout yesterday. This is only the start.It will be an awesome bull market —life changing.Namaste.
CryptoWithJames
STRAXUSDT UPDATE

STRAXUSDT is a cryptocurrency trading at $0.04440, with a target price of $0.07000. This represents a potential gain of over 80%. The technical pattern observed is a Bullish Falling Wedge, indicating a possible trend reversal. This pattern suggests that the downward trend may be coming to an end. A breakout from the wedge could lead to a significant upward movement in price. The Bullish Falling Wedge is a positive indicator, signaling a potential price surge. Investors are showing optimism about STRAXUSDT's future performance. The current price may present a buying opportunity. Reaching the target price would result in substantial returns for investors. STRAXUSDT is positioned for a potential breakout and significant gains.
Disclaimer
Any content and materials included in Sahmeto's website and official communication channels are a compilation of personal opinions and analyses and are not binding. They do not constitute any recommendation for buying, selling, entering or exiting the stock market and cryptocurrency market. Also, all news and analyses included in the website and channels are merely republished information from official and unofficial domestic and foreign sources, and it is obvious that users of the said content are responsible for following up and ensuring the authenticity and accuracy of the materials. Therefore, while disclaiming responsibility, it is declared that the responsibility for any decision-making, action, and potential profit and loss in the capital market and cryptocurrency market lies with the trader.