
STORJ
Storj
| تریدر | نوع سیگنال | حد سود/ضرر | زمان انتشار | مشاهده پیام |
|---|---|---|---|---|
No results found. | ||||
Price Chart of Storj
سود 3 Months :
سیگنالهای Storj
Filter
Sort messages by
Trader Type
Time Frame

BandForBands
استورج (STORJ) آماده انفجار: سود 500 درصدی در کمین شکست خط مقاومت!
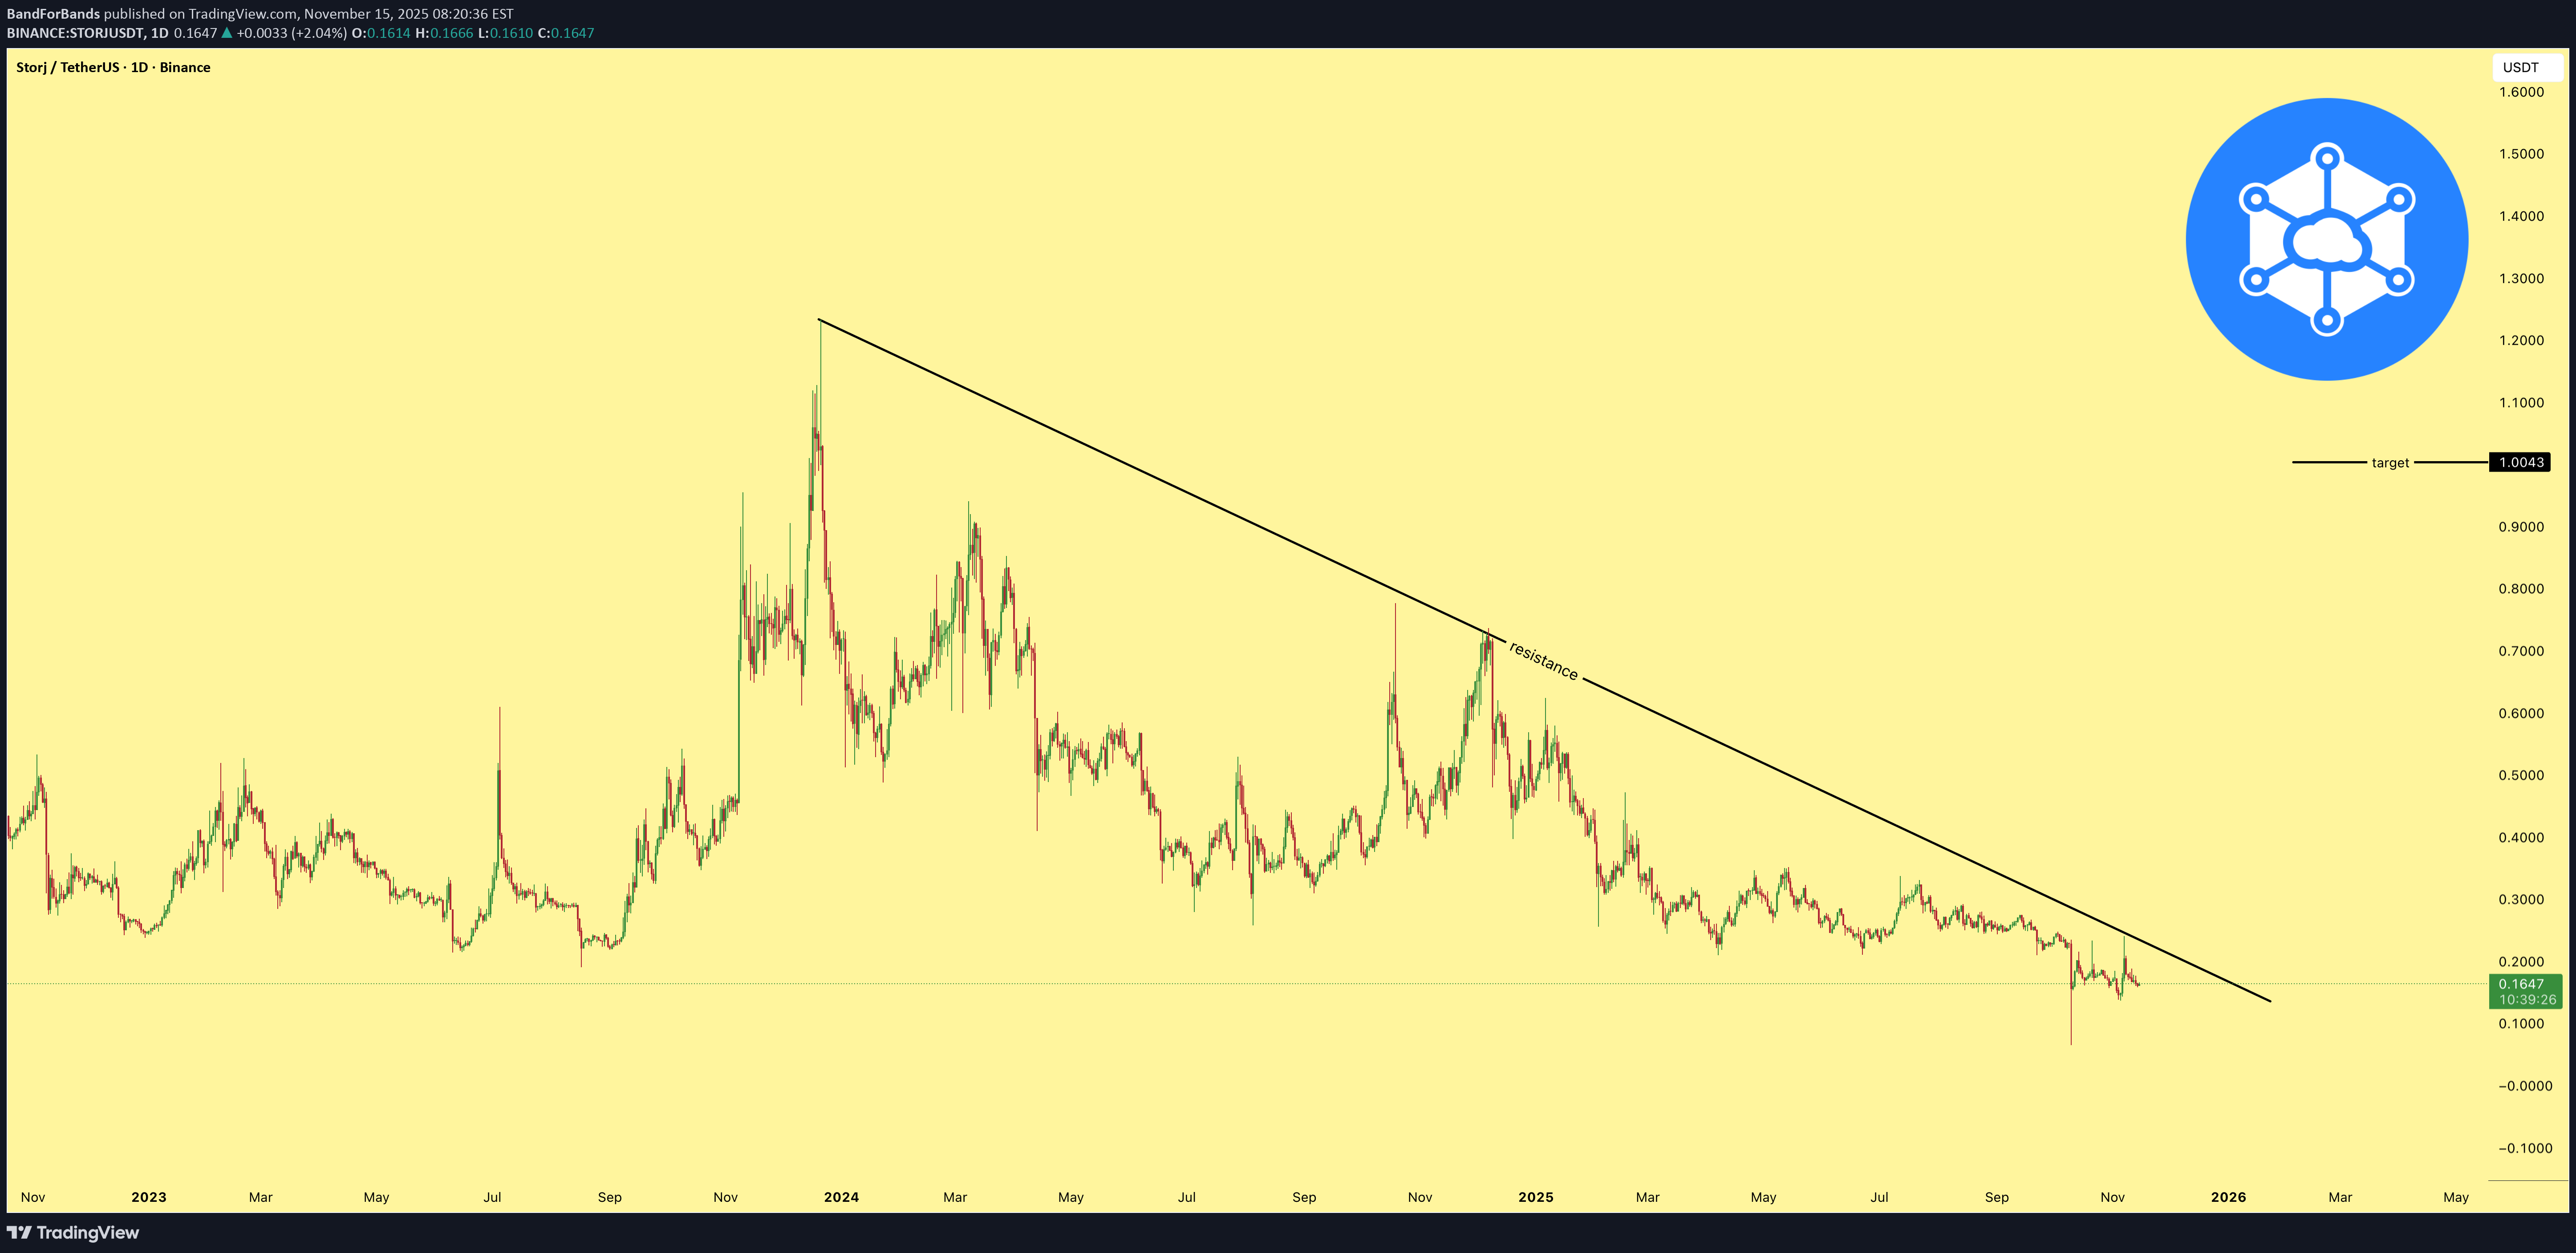
STORJ has a clean setup forming, and once it breaks the diagonal resistance line there is a potential 500 percent gain from the current price. The structure is tight, momentum is building, and this breakout could be explosive.

FortuneAI
آینده ذخیرهسازی ابری (STORJ و ICP): چرا این کوینها صعودی به نظر میرسند؟
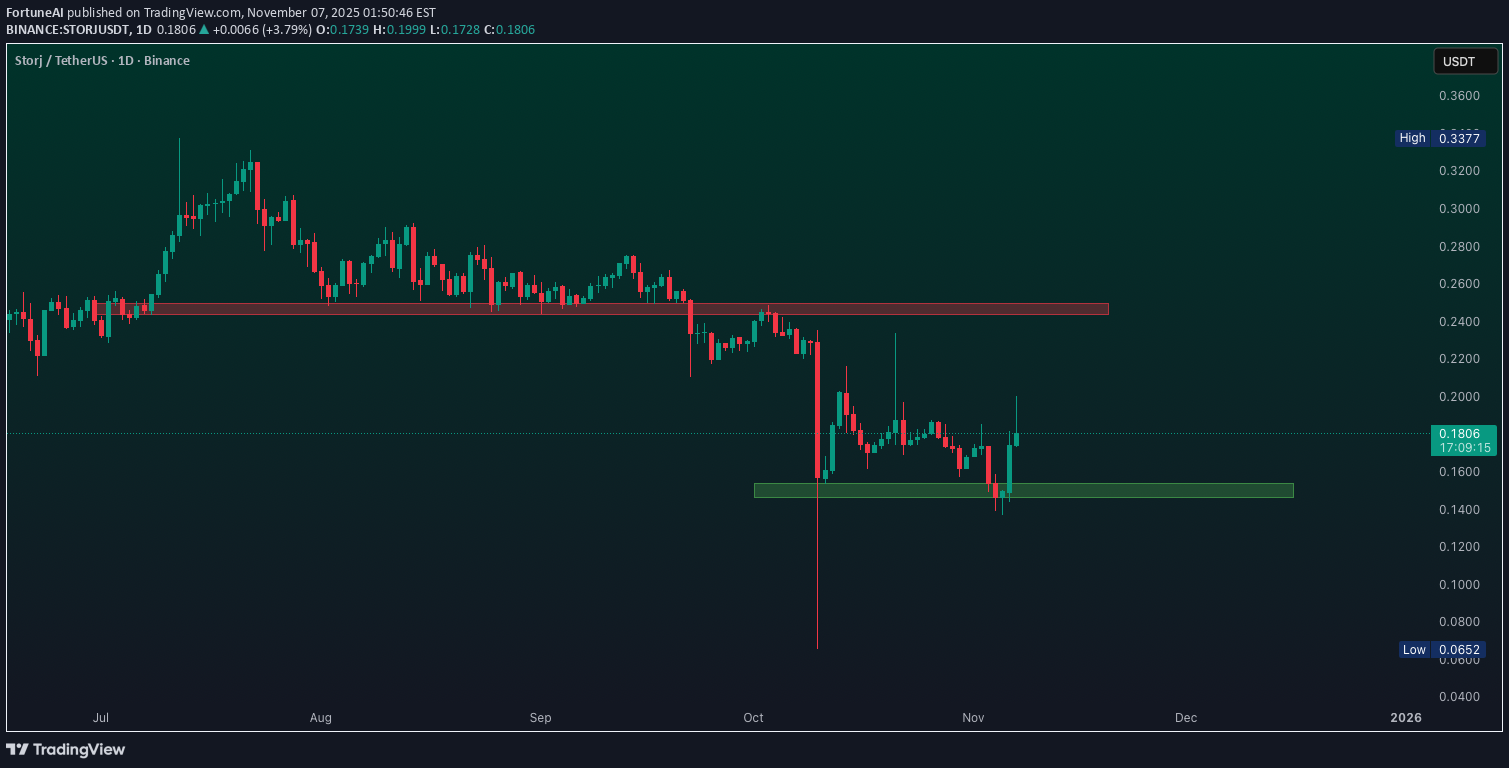
STORAGE Coins are bullish, Keep an eye on them and use proper risk management. This Narrative Looks strong with bullish TechnicalsEnjoy, PUMPING HARD AS EXPECTED, take partial profit

Bithereum_io
تحلیل تکنیکال STORJ: منتظر شکست مقاومت بلندمدت برای ورود به موج صعودی!
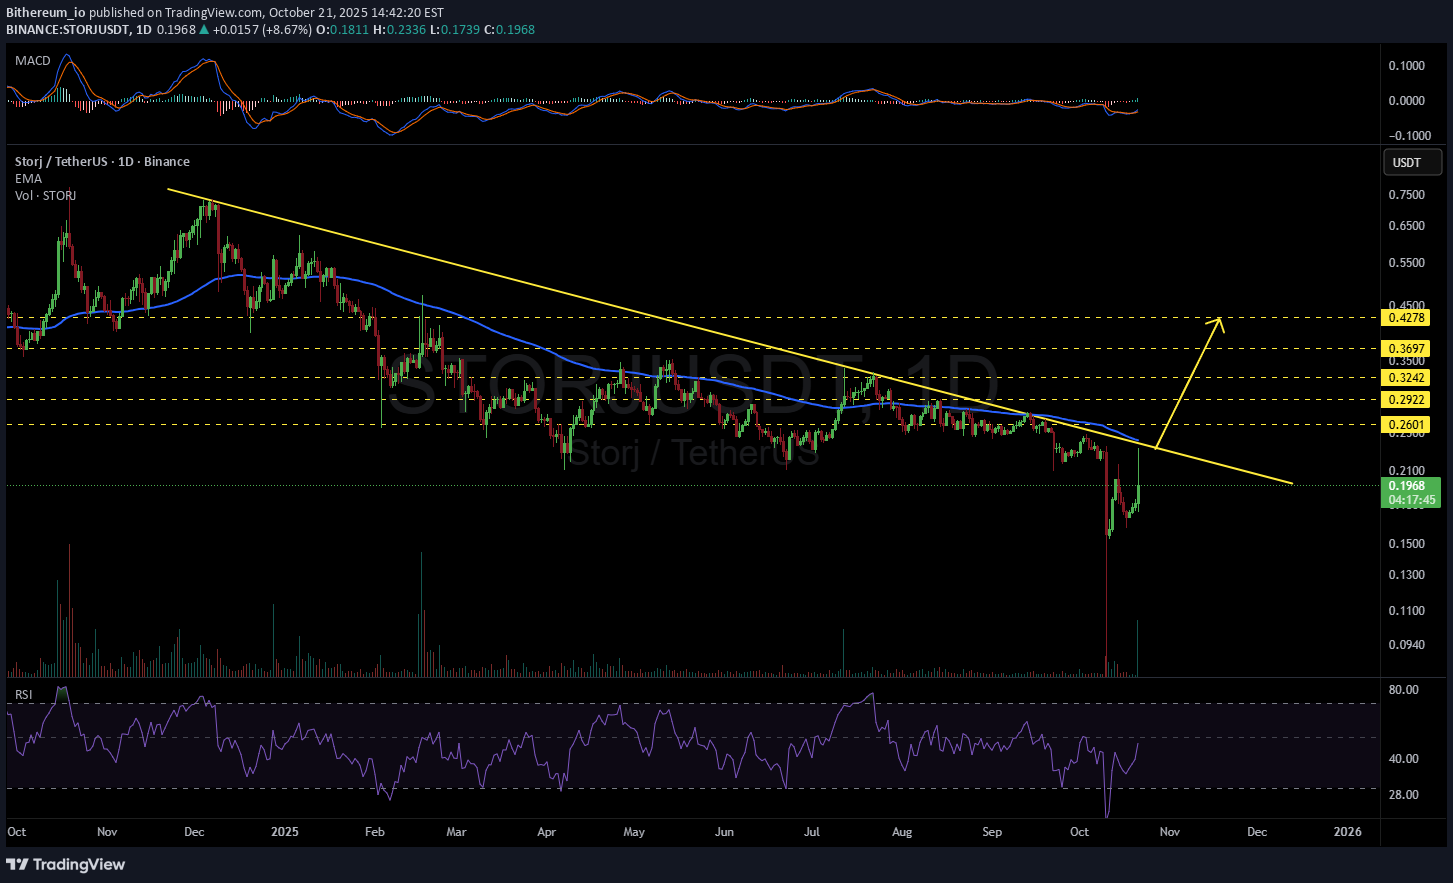
#STORJ has spiked to the long-term descending resistance with strong volume on the daily chart, but has faced a rejection for now. Keep an eye on it — it looks promising. Consider buying only after a solid breakout. In that case, the potential targets are: 🎯 $0.2601 🎯 $0.2922 🎯 $0.3242 🎯 $0.3697 🎯 $0.4278 ⚠️ Always remember to use a tight stop-loss and maintain proper risk management.

CryptoNuclear
STORJ/USDT — Decisive Zone: Reversal or Breakdown?
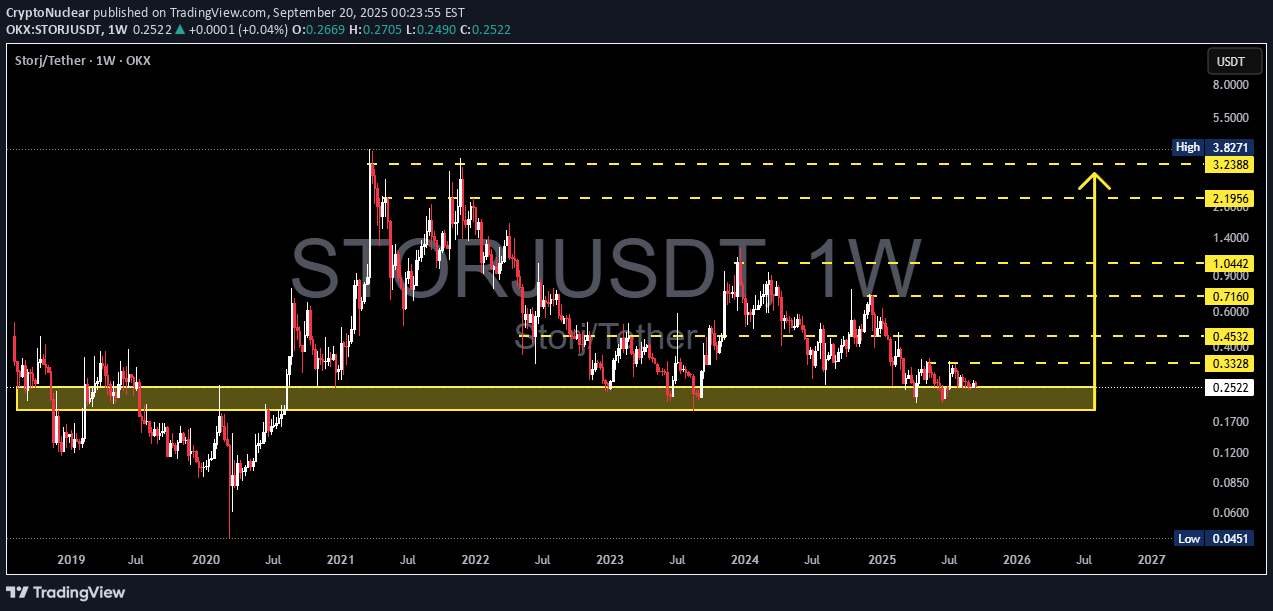
Current Situation: STORJ/USDT is trading around 0.2523 USDT, sitting right on top of a multi-year support zone (0.17 – 0.33 USDT). This is not just any technical level—it has acted as a foundation for price action multiple times since 2019. Every dip into this zone has historically triggered demand and rebounds. However, this time things look different: Price has been consolidating at support for a longer time. Lower highs since the 2021 peak signal ongoing seller pressure. The market is now at a critical decision point: Will STORJ bounce strongly, or will it finally lose its historical support? --- 🔹 Price Structure & Pattern Base/Accumulation Zone: The yellow area (0.17 – 0.33) is a long-term demand zone. Holding here could lead to a major reversal. Bearish Pressure: Larger structure still points to a long-term downtrend. Confirmation: A weekly close above 0.3328 would be the first real bullish signal. --- 🔸 Bullish Scenario (Bounce from Support) 1. Condition: Weekly candle closes above 0.3328 with solid volume → sign buyers are back. 2. Targets: 0.4532 (first resistance) 0.7160 (psychological target) 1.0442 (major resistance, trend reversal zone) 3. With strong momentum, higher levels are possible: 2.1956 → 3.2388. 📈 Upside potential from 0.2523: to 0.3328 → +31.9% to 0.4532 → +79.6% to 0.7160 → +183.8% to 1.0442 → +313.9% (These can be used as staged profit targets for swing/position traders.) --- 🔸 Bearish Scenario (Breakdown of Support) 1. Condition: Weekly close below 0.17 → signals a breakdown of the historical support. 2. Implication: Likely continuation of the long-term downtrend, targeting 0.12 → 0.0451 (all-time low). 3. Be cautious of breakdown + retest: price may dip below support, retest the zone (0.17–0.20) as new resistance, and continue lower. 📉 Downside potential from 0.2523: to 0.17 → −32.6% to 0.12 → −52.4% to 0.0451 → −82.1% --- 🔹 Key Insights The 0.17 – 0.33 zone is the "golden area": either the base of a multi-month reversal or the floor that gives way to new lows. Conservative traders should wait for confirmation above resistance before entering aggressively. Aggressive traders may accumulate at support with a tight SL below 0.17. Risk management is crucial: the potential rewards are large, but so are the risks. --- 📌 Conclusion STORJ is at a make-or-break level. If support holds → rally potential toward 1.0+ USDT and beyond. If it fails → downside continuation opens targets at 0.12 and possibly 0.0451. The market is waiting to see who wins: buyers defending historical accumulation or sellers pressing for a deeper breakdown. --- #STORJ #STORJUSDT #Crypto #Altcoin #PriceAction #SupportResistance #TechnicalAnalysis #Breakout #Bearish #Bullish

Coin-Hastasi
#Storj grafigi
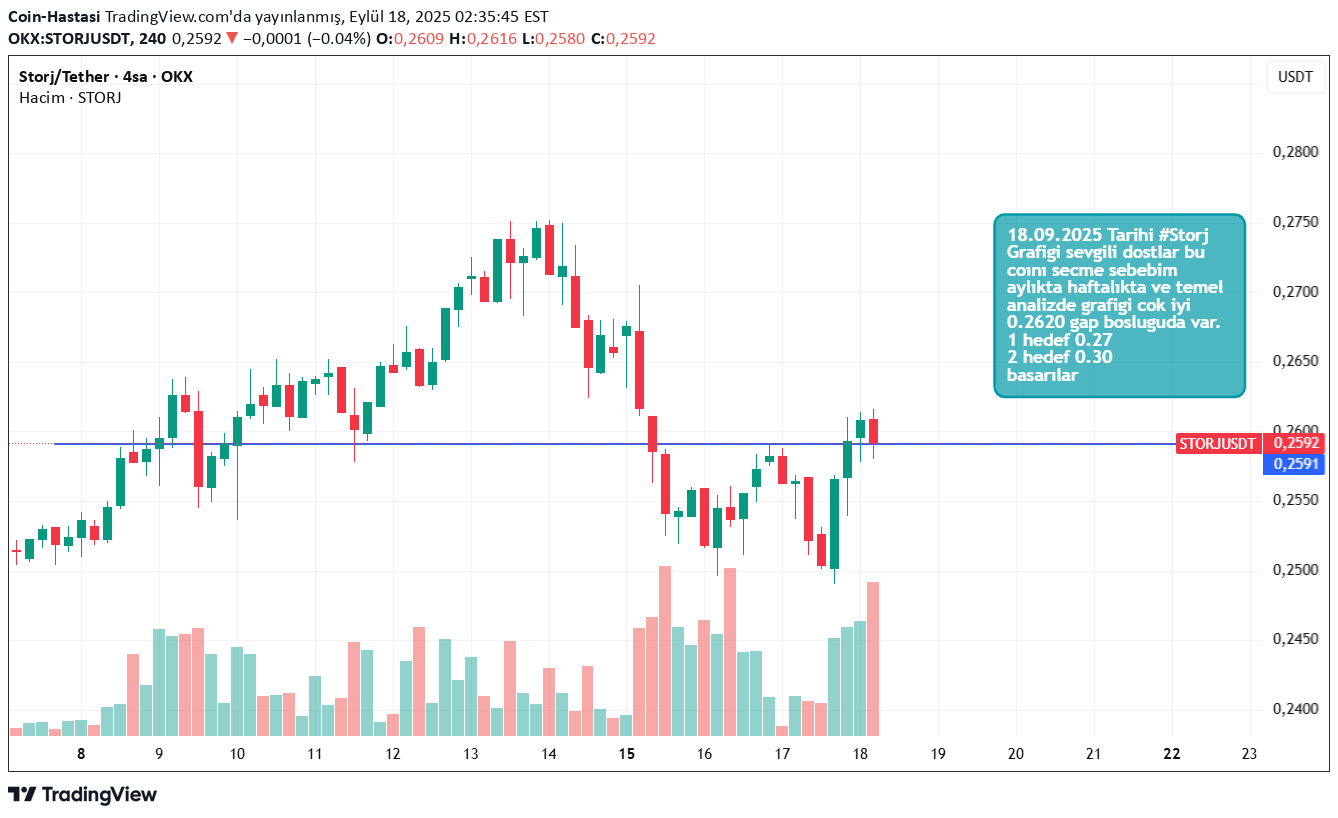
Hello Storj I think it should go now

trader_61203
خرید در حین کاهش تا ۰.۲۳ تتر
Buy استورج in reducing prices by 0.8
trader_61203
خرید پله ای تا ۰.۲۵
Buying a step on time reducing prices
trader_61203

weslad
storjusdt buy opportunity
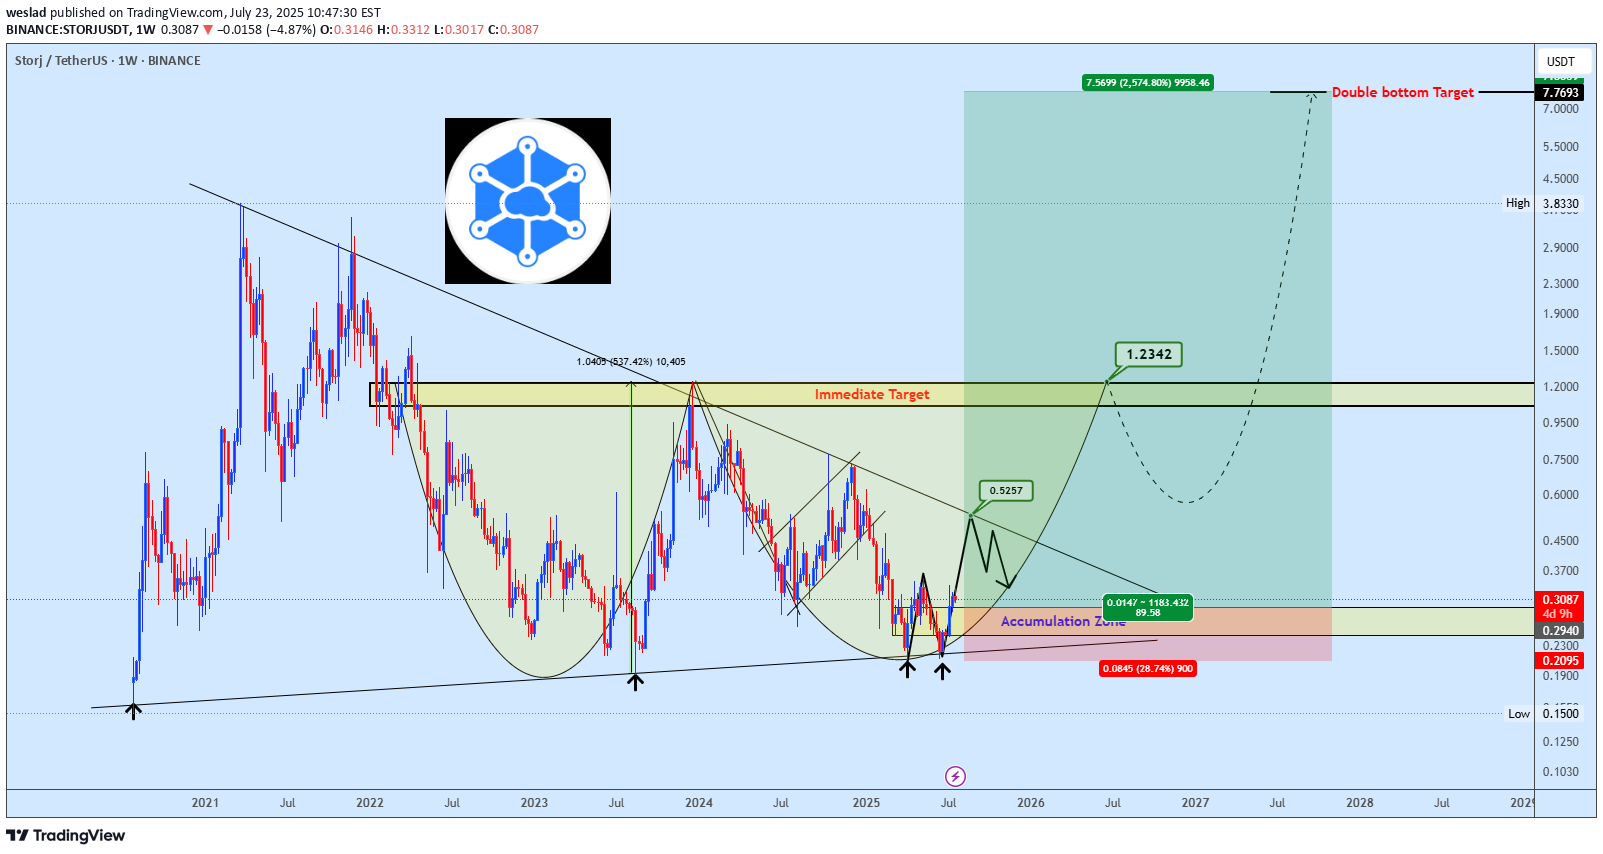
STORJUSDT is forming a classic double bottom within a symmetrical triangle structure. Price is currently reacting from the highlighted accumulation zone, which aligns with a strong demand area. The immediate objective is a move toward $0.525, the triangle’s upper boundary, where minor rejection is anticipated. A successful breakout above this level will shift focus to the double bottom neckline, with the final target aligning with the full measured move as illustrated on the chart.

YouKnowTheVibes
Moon boy
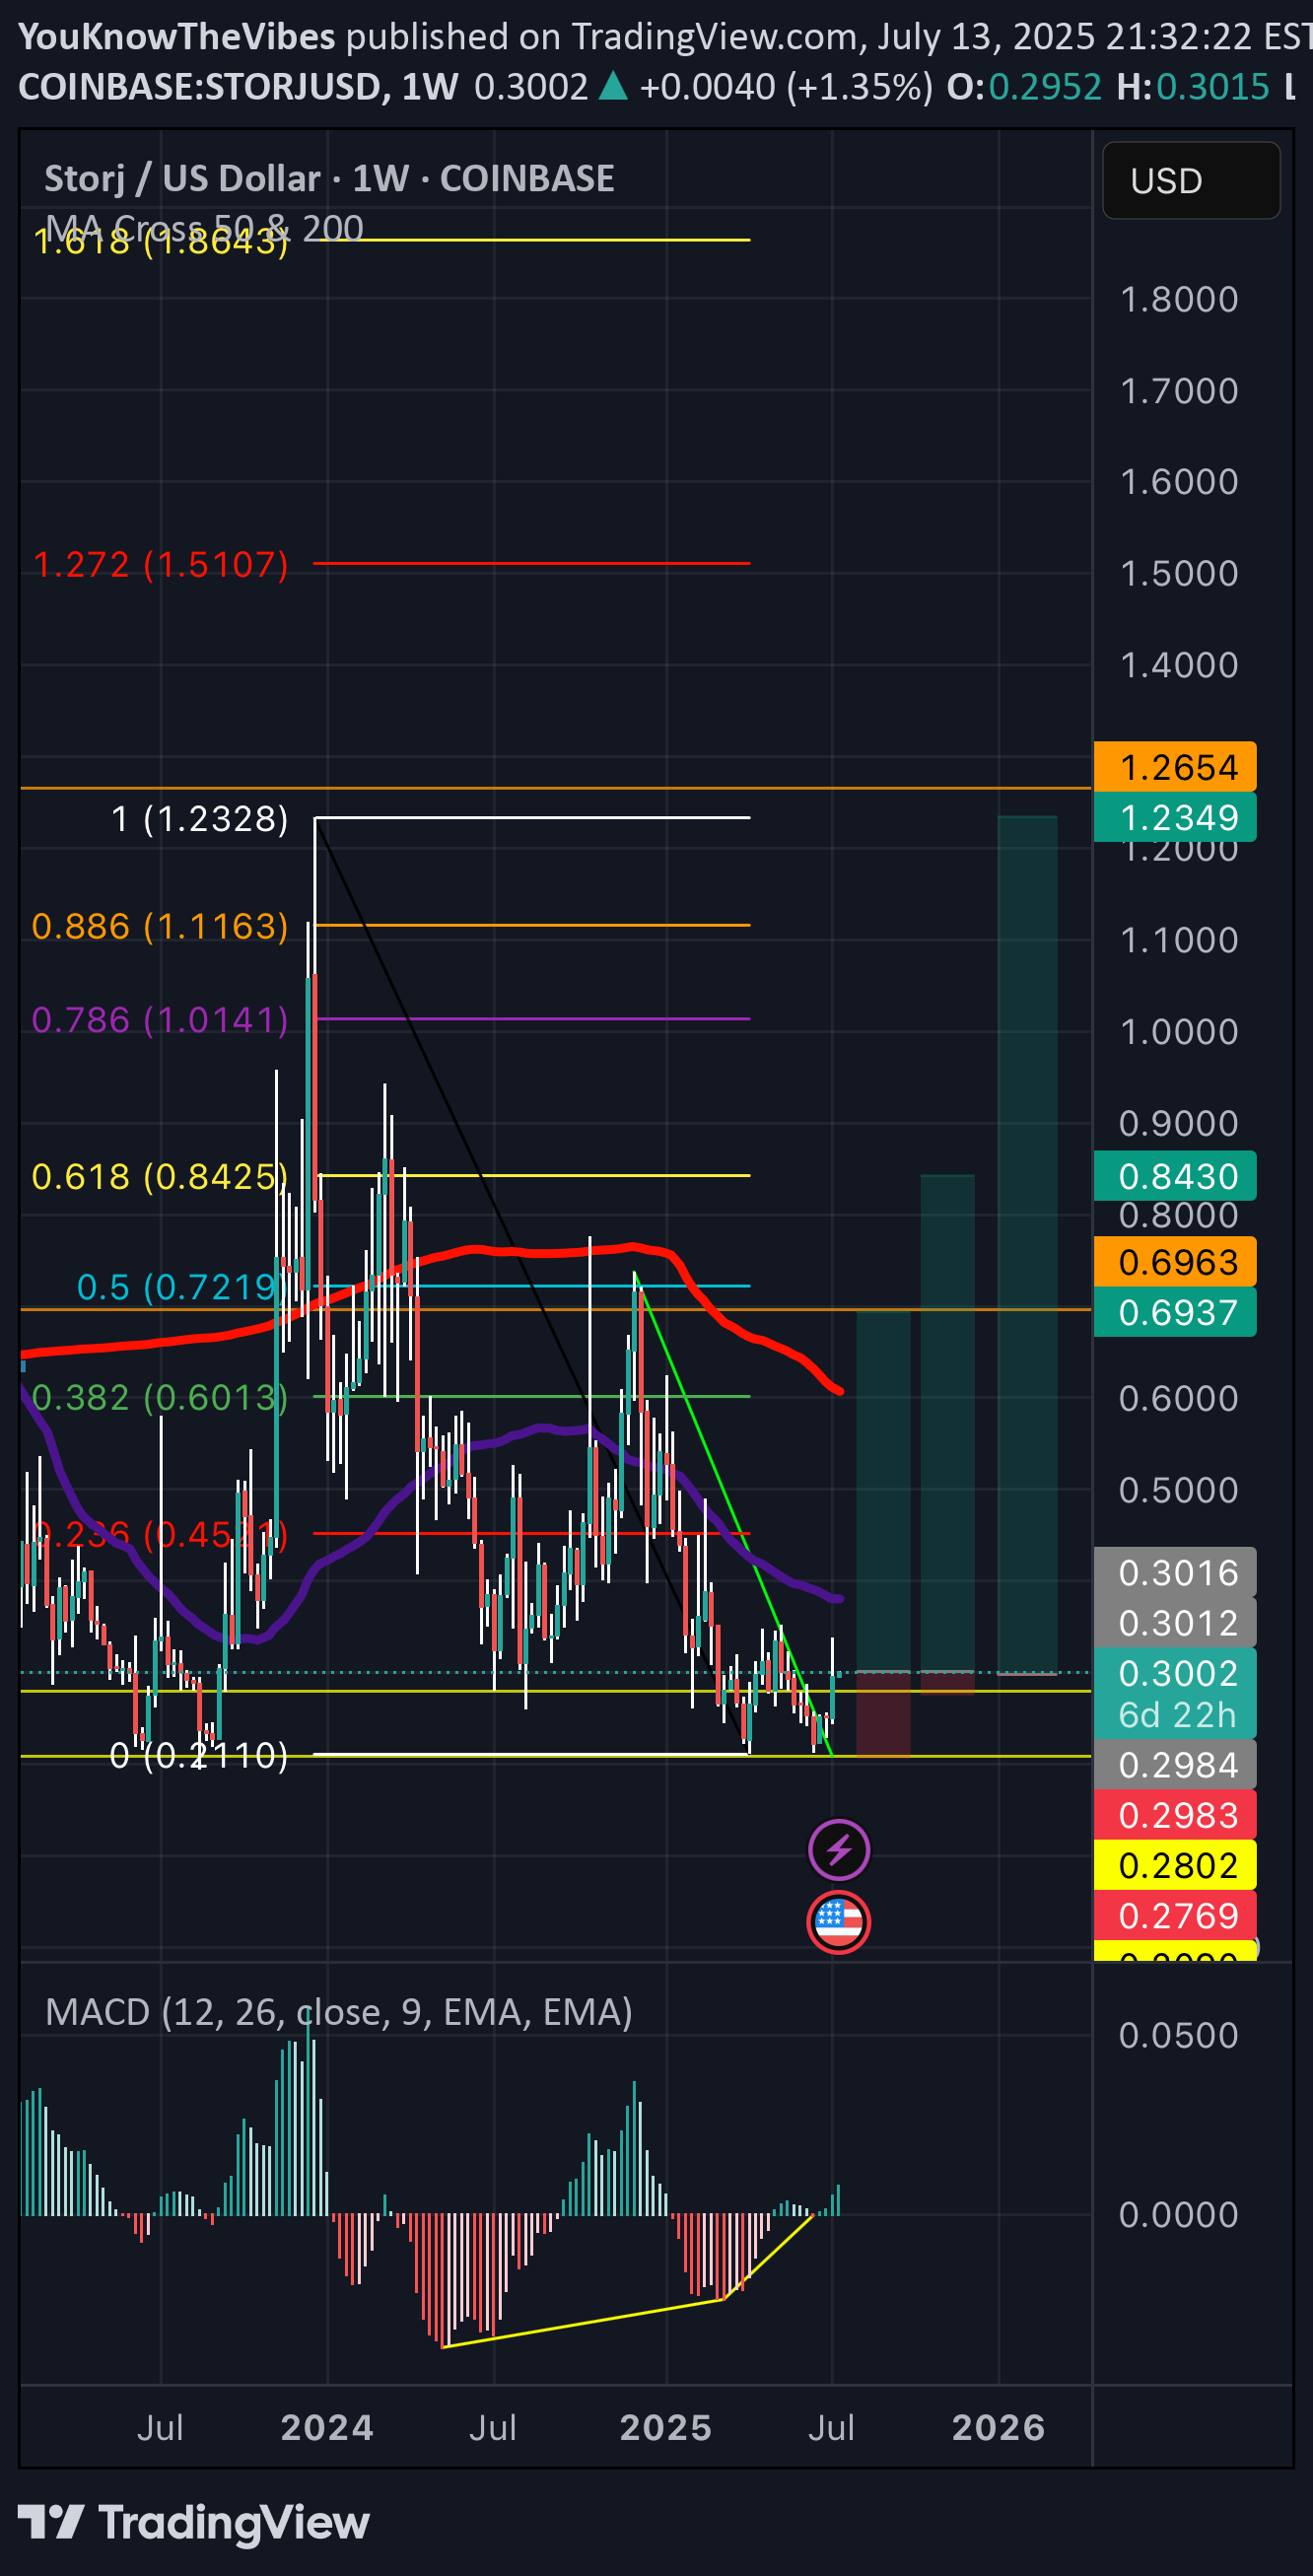
Clear double bottom with triple class A bullish divergence easy trade. Set those SL and stick to your TP. Best of luck!
Disclaimer
Any content and materials included in Sahmeto's website and official communication channels are a compilation of personal opinions and analyses and are not binding. They do not constitute any recommendation for buying, selling, entering or exiting the stock market and cryptocurrency market. Also, all news and analyses included in the website and channels are merely republished information from official and unofficial domestic and foreign sources, and it is obvious that users of the said content are responsible for following up and ensuring the authenticity and accuracy of the materials. Therefore, while disclaiming responsibility, it is declared that the responsibility for any decision-making, action, and potential profit and loss in the capital market and cryptocurrency market lies with the trader.