
STEEM
Steem
| تریدر | نوع سیگنال | حد سود/ضرر | زمان انتشار | مشاهده پیام |
|---|---|---|---|---|
No results found. | ||||
Price Chart of Steem
سود 3 Months :
سیگنالهای Steem
Filter
Sort messages by
Trader Type
Time Frame

pullbacksignal
سیگنال خرید STEEM/USDT: استراتژی میانمدت با اهداف سود مشخص
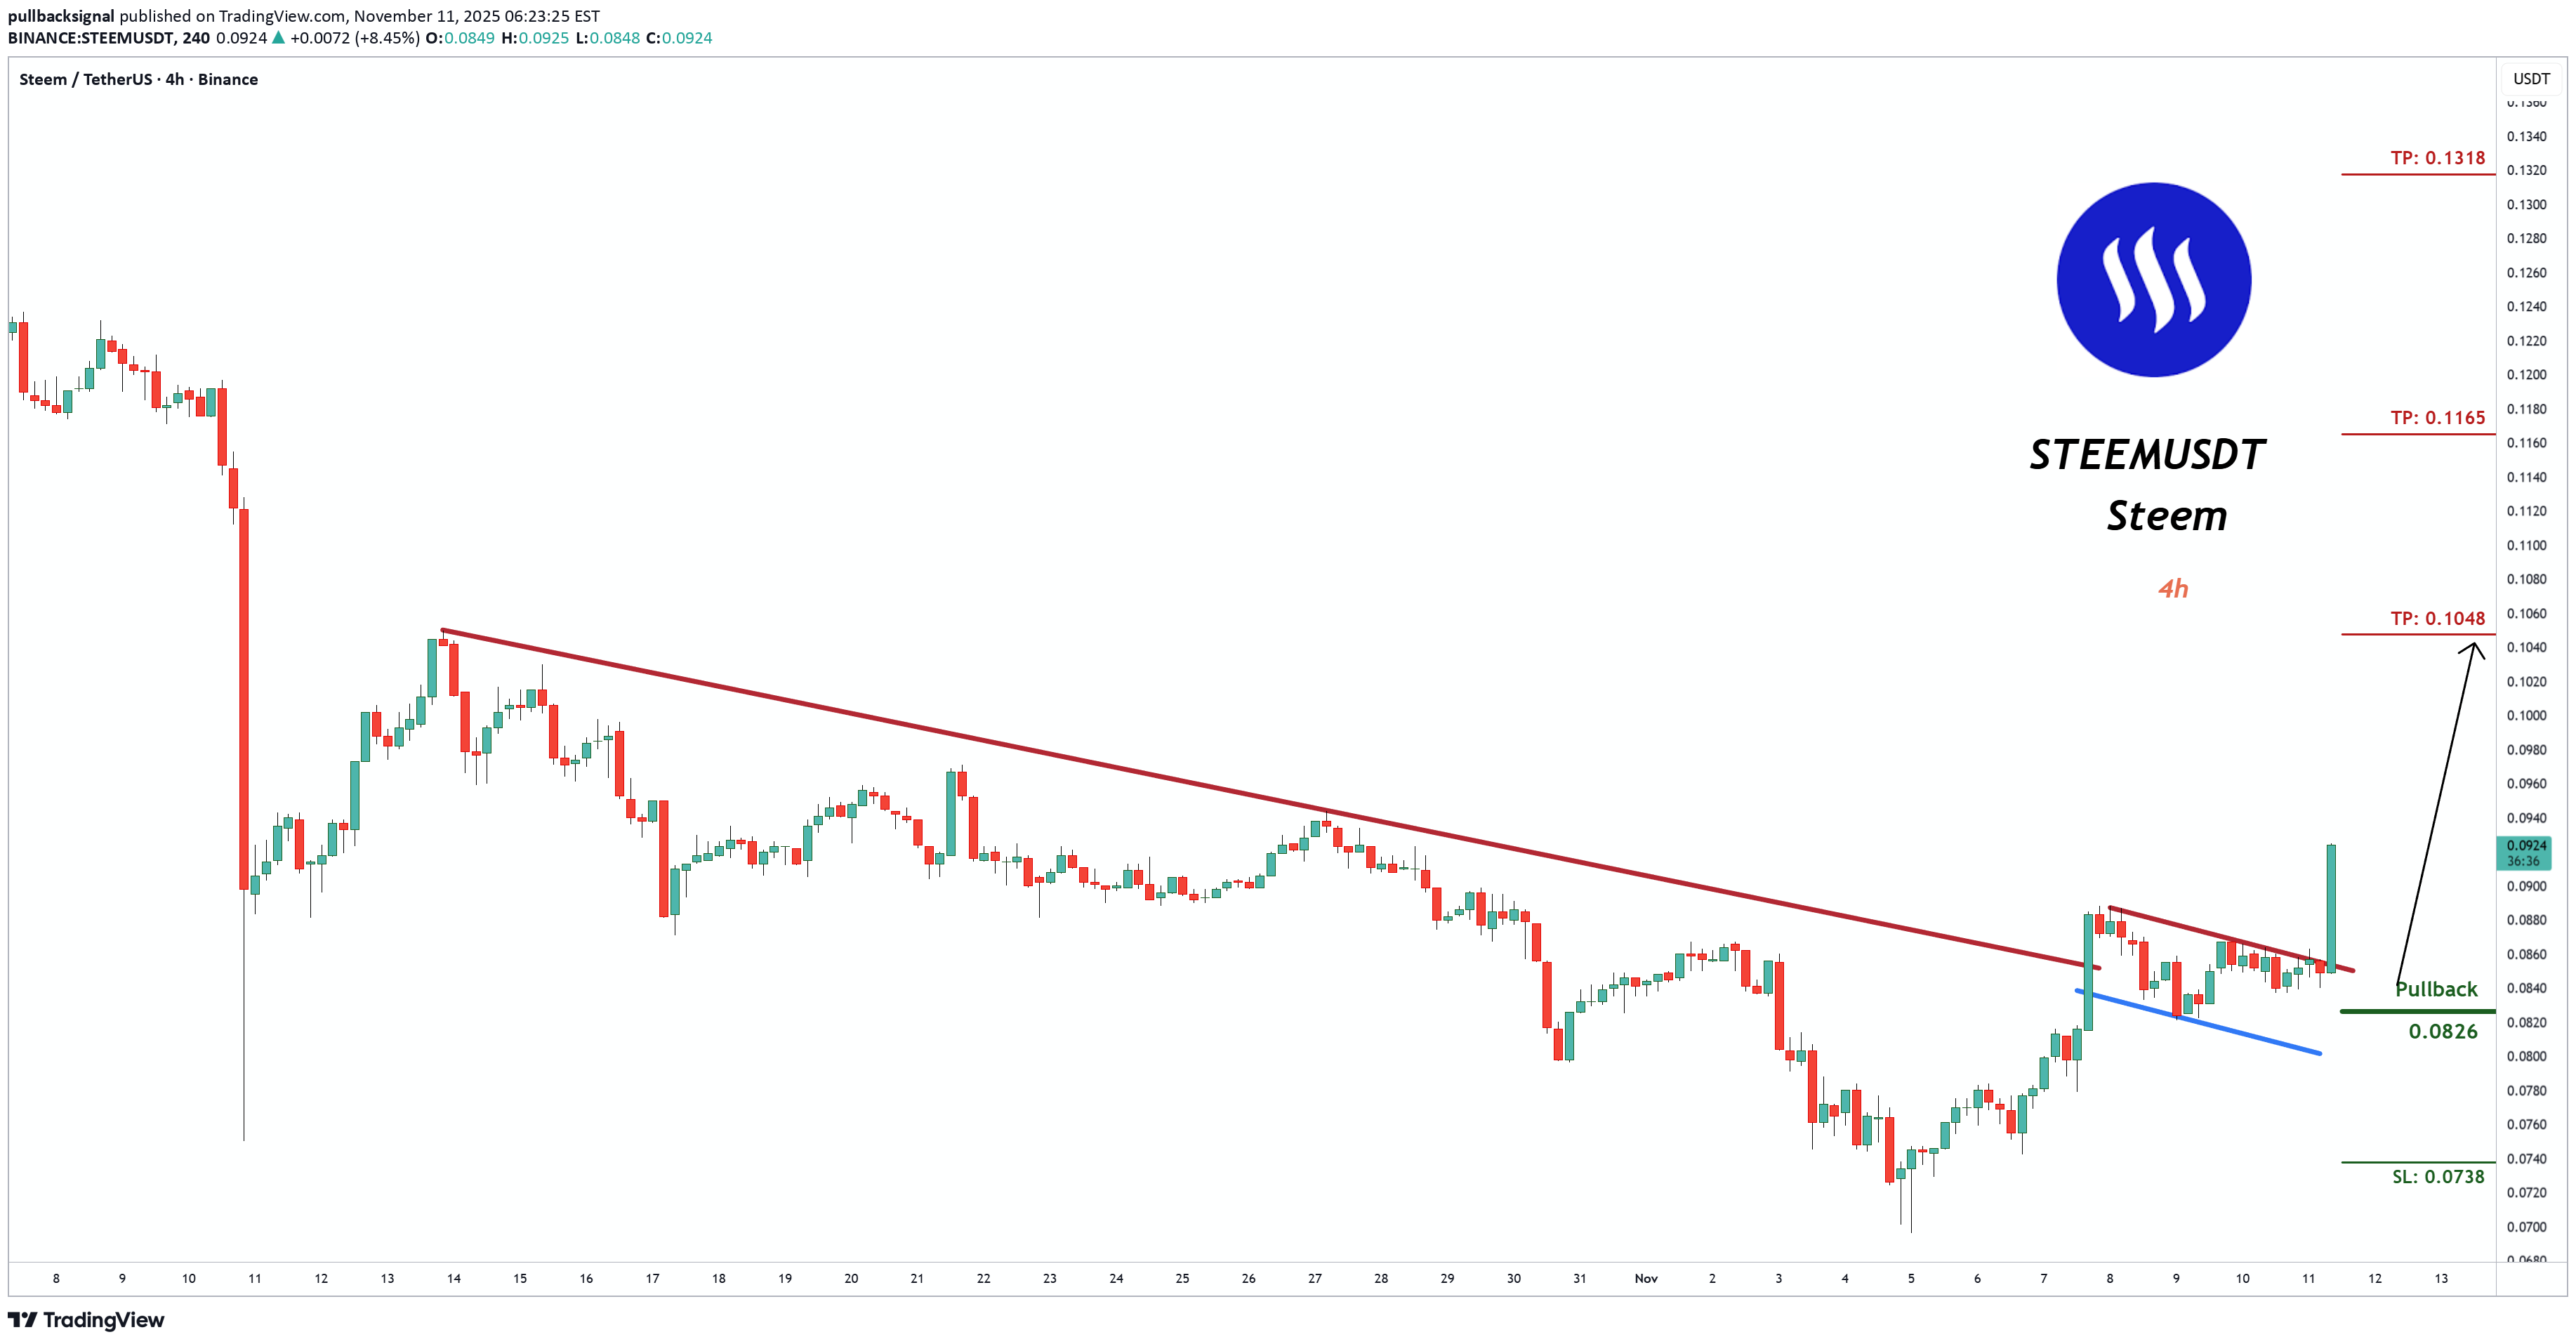
Trading Setup: There is a Trading Signal to Buy in STEEMUSDT Steem (h4) (Spot) Traders can open their Buy Trades NOW ⬆️Buy now or Buy on 0.0826 ⭕️SL @ 0.0738 🔵TP1 @ 0.1048 🔵TP2 @ 0.1165 🔵TP3 @ 0.1318 What are these signals based on? Classical Technical Analysis Price Action Candlesticks Fibonacci RSI, Moving Average , Ichimoku , Bollinger Bands Risk Warning Trading Forex, CFDs, Crypto, Futures, and Stocks involve a risk of loss. Please consider carefully if such trading is appropriate for you. Past performance is not indicative of future results. If you liked our ideas, please support us with your likes 👍 and comments .

bakbak88
Somi might have same scenario case like steem
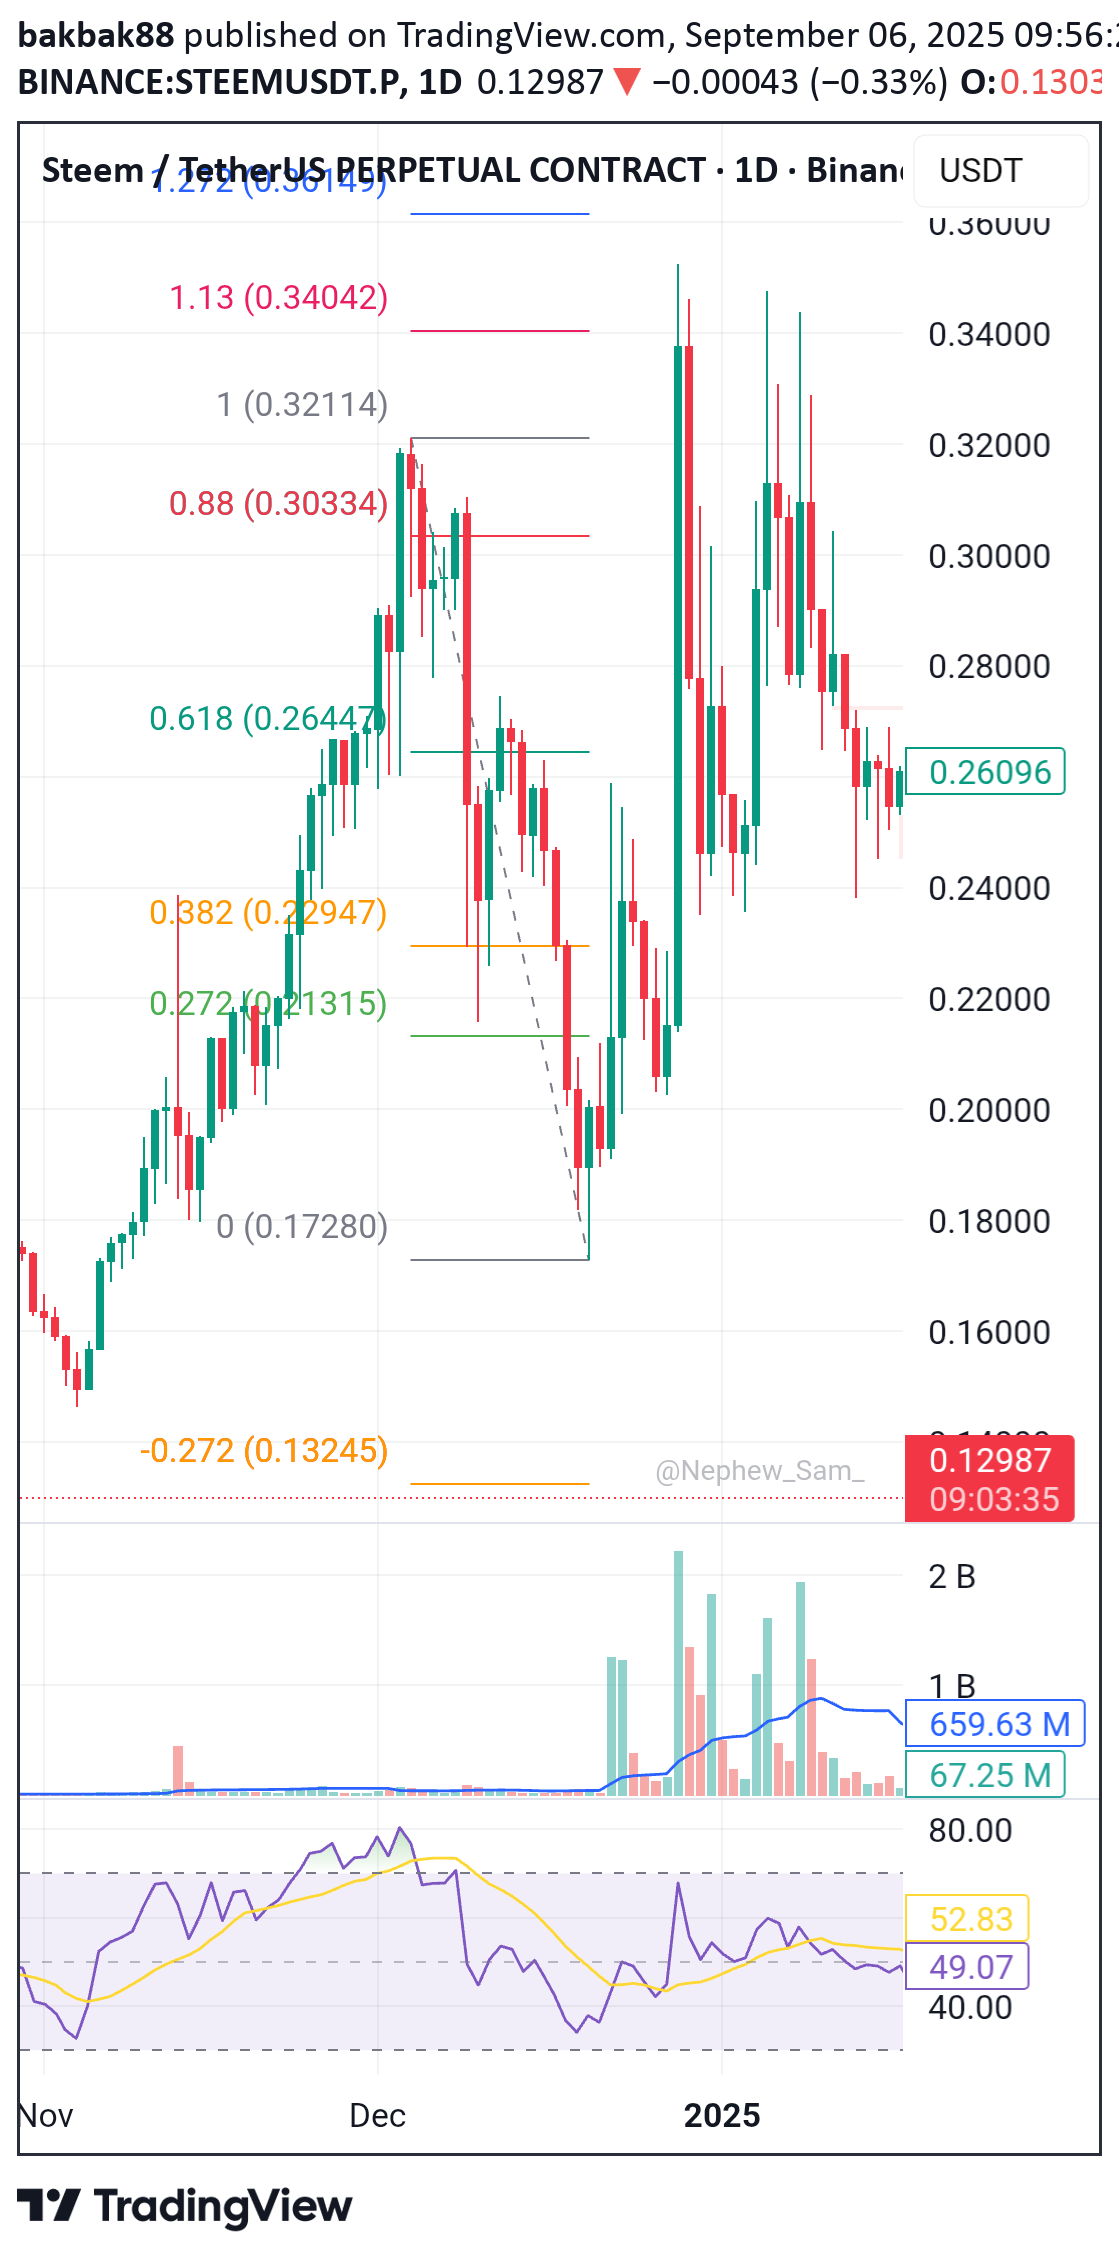
Steem having same similar pattern like somi on last year. Looks like same operator. There is bottom high volume. When the price pump.. daily chart close below fibo 1.13 and start to do fake out pattern.. The most realistic for somi price target will be 1.13.. If daily chart close below 1.13b at 8am (+8gmt).. it is best tp area.

TraderAAG

Rasulberdi_Ashiraliyev
"STEEM Long Opportunity from Support"

STEEM/USDT is showing signs of a bullish reversal after testing a key demand zone around 0.1392–0.1473. Price has respected the 0.705 Fibonacci level and formed support at 0.1485, suggesting potential for an upward move.Trade Setup:Entry: 0.1485Stop-Loss: 0.1392 (below demand zone)Target: 0.1745 (previous high / 0 Fibonacci)Risk:Reward Ratio: ~1:2.8A clean rejection from support with confluence of Fibonacci levels and a possible breakout structure. As long as price stays above the demand zone, long bias remains valid.Not financial advice. Always do your own research.

EkyFabyanto
Golden Cross means Golden Opportunity?

Here's What You Need to Know About Moving Averages One of the signs of the beginning of a bullish trend is the golden cross — a crossover between two moving averages. The shorter-period moving average (closer to the price) crosses above the longer-period moving average (farther from the price). When this happens, it could be a signal to consider buying or opening a long position, especially if supported by candlestick confirmation. The target is usually set higher than the previous high. Case Study: STEEMUSDT The price began trading above the EMA 20 (white line) and EMA 50 (pink line), then the EMA 20 crossed above the EMA 50 — forming a golden cross. But instead of entering immediately, you should wait for a price retracement back to the EMAs, allowing them to act as support (also known as dynamic support, since EMAs move with price). In this case, a bullish engulfing candlestick pattern appeared right at the EMAs. The confirmation level is at 0.1303, which means the price needs to close above this level to validate the bounce from the EMAs. The invalidation level is below the bullish engulfing candle — at 0.1270. Target prices: Target I: 0.1570 – 0.1632 Target II: 0.1802 – 0.1887 You might be wondering: How do I choose which target to aim for? Let me explain — the main target is 0.1802 – 0.1887 because it’s above the previous high (in a bullish trend, price tends to form higher highs). Then why include 0.1570 – 0.1632? Even though we aim for the higher target, we still need to be cautious of potential resistance in that zone. Once the price hits that level, observe how it reacts. If there’s a significant rejection or price drop, consider reducing your position to secure profits. But if the price keeps pushing up with strong momentum, let the profits run. So in this case, 0.1570 – 0.1632 acts more like a level of awareness rather than a fixed take-profit target. Let me know what you think about this post! Would love to hear your thoughts and how I can support your trading journey with more technical insights or educational content like this. 🙌Price seems to be struggling around the 0.1570 – 0.1632 resistance zone. In this kind of setup, it might be better to either close or reduce your position and wait for a better entry signal. But if you decide to hold STEEMUSDT , make sure the price stays above 0.1429. A move below that level could be a sign to exit the position.

MahoniSupra
Steem Fikrim

A attack will come, but it can come into contact with this support again and come from here that may continue to rise, I guess this is not the investment advice I will follow

CryptoNuclear


VIPROSE

⚪️ SSTEEM 4D TimeframeSimple & Bullish structure 🐃Accumulation within key support → breakout → potential re-accumulation for the next leg upSSTEEM heading toward $0.5474 looks inevitable ✈️🎯 Target 1: $0.4105🎯 Target 2: $0.5474

MasterTraderTR

Some speculative movements are likely to be seen in the STEEMUSDT pair. Similar movements were seen in the past in the KETETH pair. Do not open a trade without doing your own research. YTD.

kriptosherlock
STEEM / 4H

After the contact with the 0.2394 support, the falling STEEM was broken with the acceleration of purchases! We can observe that long positions work better if permanence is achieved after the breakout. In case of weakness at the important resistance levels shown in the chart, it is useful to reduce the weight in the positions.
Disclaimer
Any content and materials included in Sahmeto's website and official communication channels are a compilation of personal opinions and analyses and are not binding. They do not constitute any recommendation for buying, selling, entering or exiting the stock market and cryptocurrency market. Also, all news and analyses included in the website and channels are merely republished information from official and unofficial domestic and foreign sources, and it is obvious that users of the said content are responsible for following up and ensuring the authenticity and accuracy of the materials. Therefore, while disclaiming responsibility, it is declared that the responsibility for any decision-making, action, and potential profit and loss in the capital market and cryptocurrency market lies with the trader.