
SFP
SafePal
| تریدر | نوع سیگنال | حد سود/ضرر | زمان انتشار | مشاهده پیام |
|---|---|---|---|---|
 yassoo-x2Rank: 1188 | خرید | حد سود: تعیین نشده حد ضرر: تعیین نشده | 11/15/2025 | |
 Alpha-GoldFXRank: 32114 | خرید | حد سود: تعیین نشده حد ضرر: تعیین نشده | 11/27/2025 |
Price Chart of SafePal
سود 3 Months :
سیگنالهای SafePal
Filter
Sort messages by
Trader Type
Time Frame
Alpha-GoldFX
الگوی گُوِه نزولی SFPUSDT: سیگنال انفجار بزرگ ۴۰ درصدی!
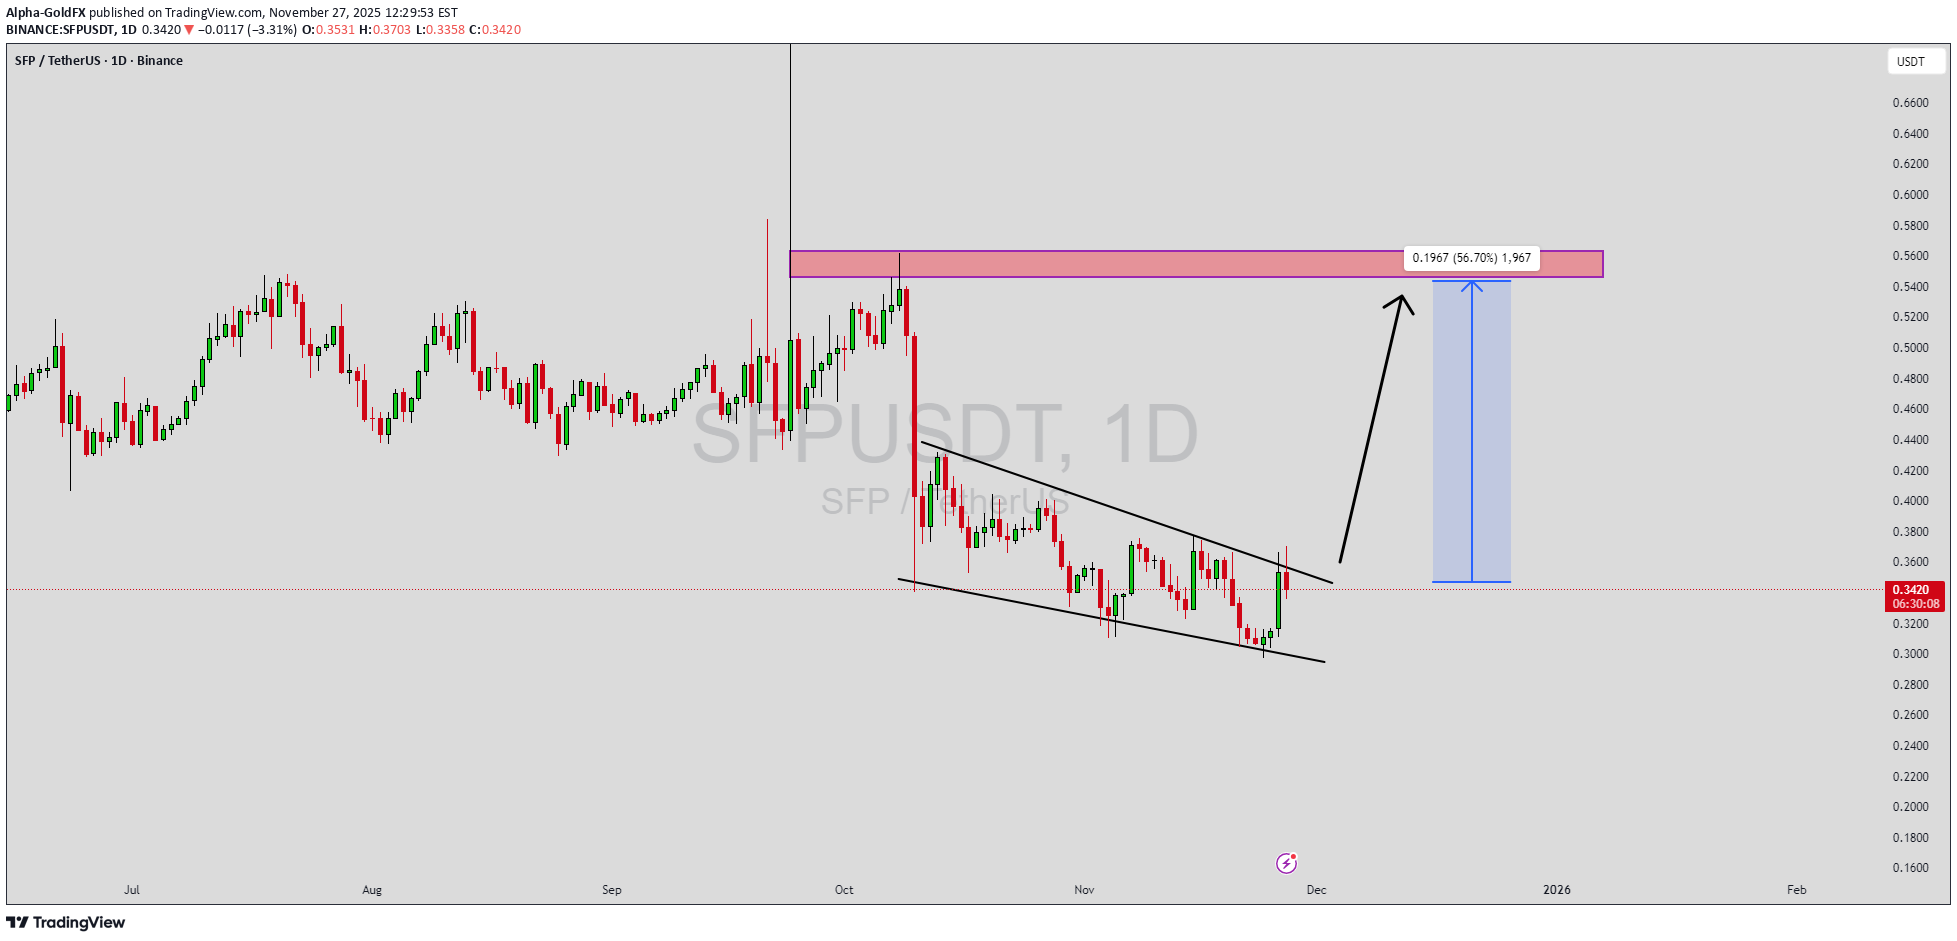
SFPUSDT is forming a clear falling wedge pattern, a classic bullish reversal signal that often indicates an upcoming breakout. The price has been consolidating within a narrowing range, suggesting that selling pressure is weakening while buyers are beginning to regain control. With consistent volume confirming accumulation at lower levels, the setup hints at a potential bullish breakout soon. The projected move could lead to an impressive gain of around 40% to 50% once the price breaks above the wedge resistance. This falling wedge pattern is typically seen at the end of downtrends or corrective phases, and it represents a potential shift in market sentiment from bearish to bullish. Traders closely watching SFPUSDT are noting the strengthening momentum as it nears a breakout zone. The good trading volume adds confidence to this pattern, showing that market participants are positioning early in anticipation of a reversal. Investors’ growing interest in SFPUSDT reflects rising confidence in the project’s long-term fundamentals and current technical strength. If the breakout confirms with sustained volume, this could mark the start of a fresh bullish leg. Traders might find this a valuable setup for medium-term gains, especially as the wedge pattern completes and buying momentum accelerates. ✅ Show your support by hitting the like button and ✅ Leaving a comment below! (What is your opinion about this Coin?) Your feedback and engagement keep me inspired to share more insightful market analysis with you!

Bithereum_io
تحلیل SFP: کانال نزولی شکسته میشود یا سقوط ادامه دارد؟ مسیر صعودی بعدی کجاست؟
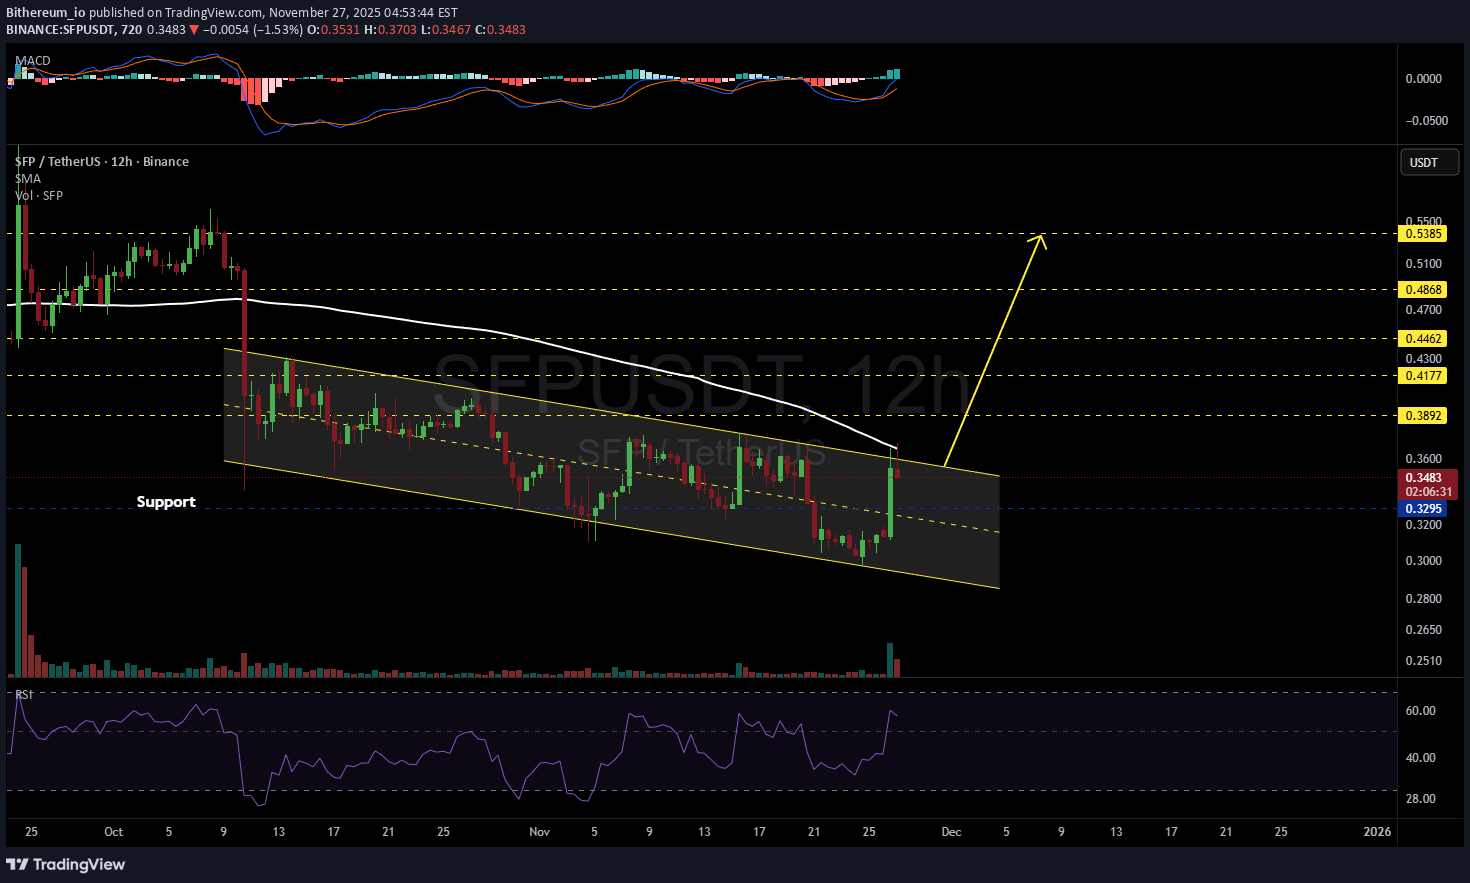
#SFP is moving inside a descending channel on the 12H timeframe. It attempted to break out of the channel but was rejected by the SMA100. Keep an eye on it — price may retest the support before the next leg up. If it breaks above both the channel resistance and the SMA100, the potential targets are: 🎯 $0.3892 🎯 $0.4177 🎯 $0.4462 🎯 $0.4868 🎯 $0.5385 ⚠️ Always remember to protect your capital with a proper stop-loss and disciplined risk management.
yassoo-x2
تحلیل روزانه SFP/USDT: آیا قیمت به زودی اوج میگیرد؟ (مراقب این سطوح باشید)
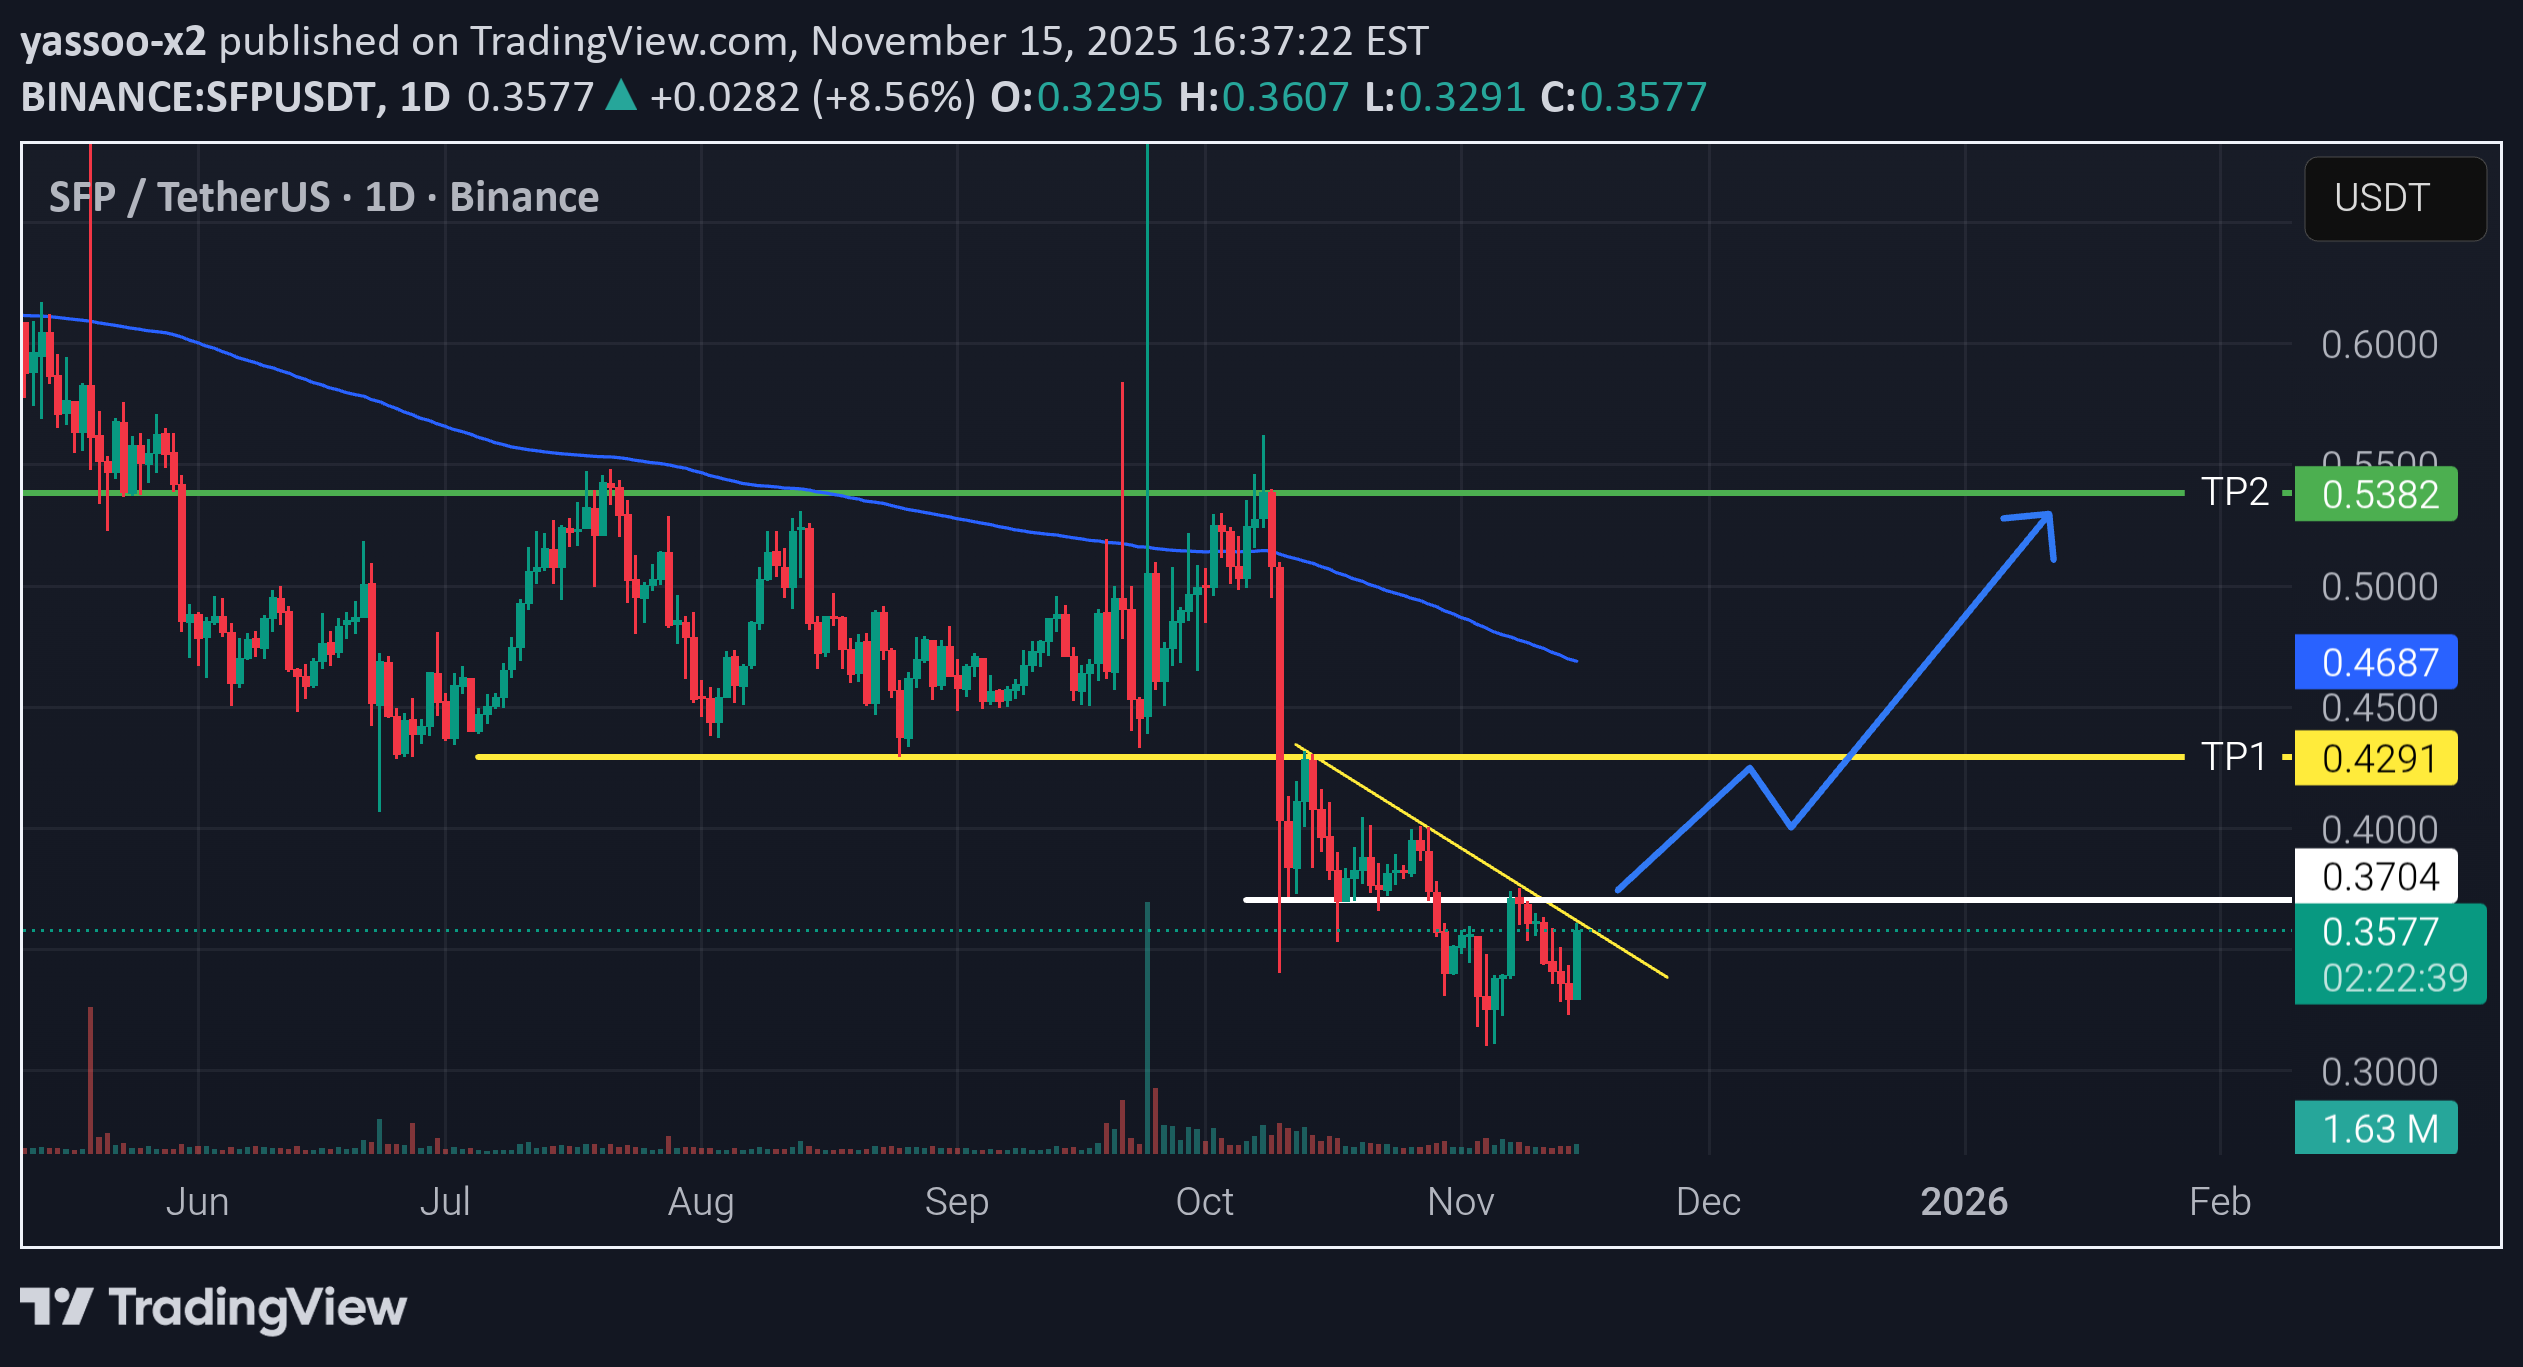
SFP is attempting a breakout from a descending trendline after forming a strong support base around 0.35. A successful breakout can trigger a bullish continuation toward key resistance levels. Key Levels to Watch: 🔹 Entry Zone: Above 0.3704 (confirmed break) 🔹 TP1: 0.4291 🔹 TP2: 0.5382 🔹 Major Resistance: 0.4687 Bullish Scenario: A clean breakout and retest of the trendline could push price toward TP1, and a strong continuation may reach TP2. Invalidation: Daily close back below 0.3500. Chart looks promising, but waiting for confirmation is crucial. 📊💡

sladkamala123
افت شدید SFP: پایان روند صعودی و شروع سقوط قیمتی؟
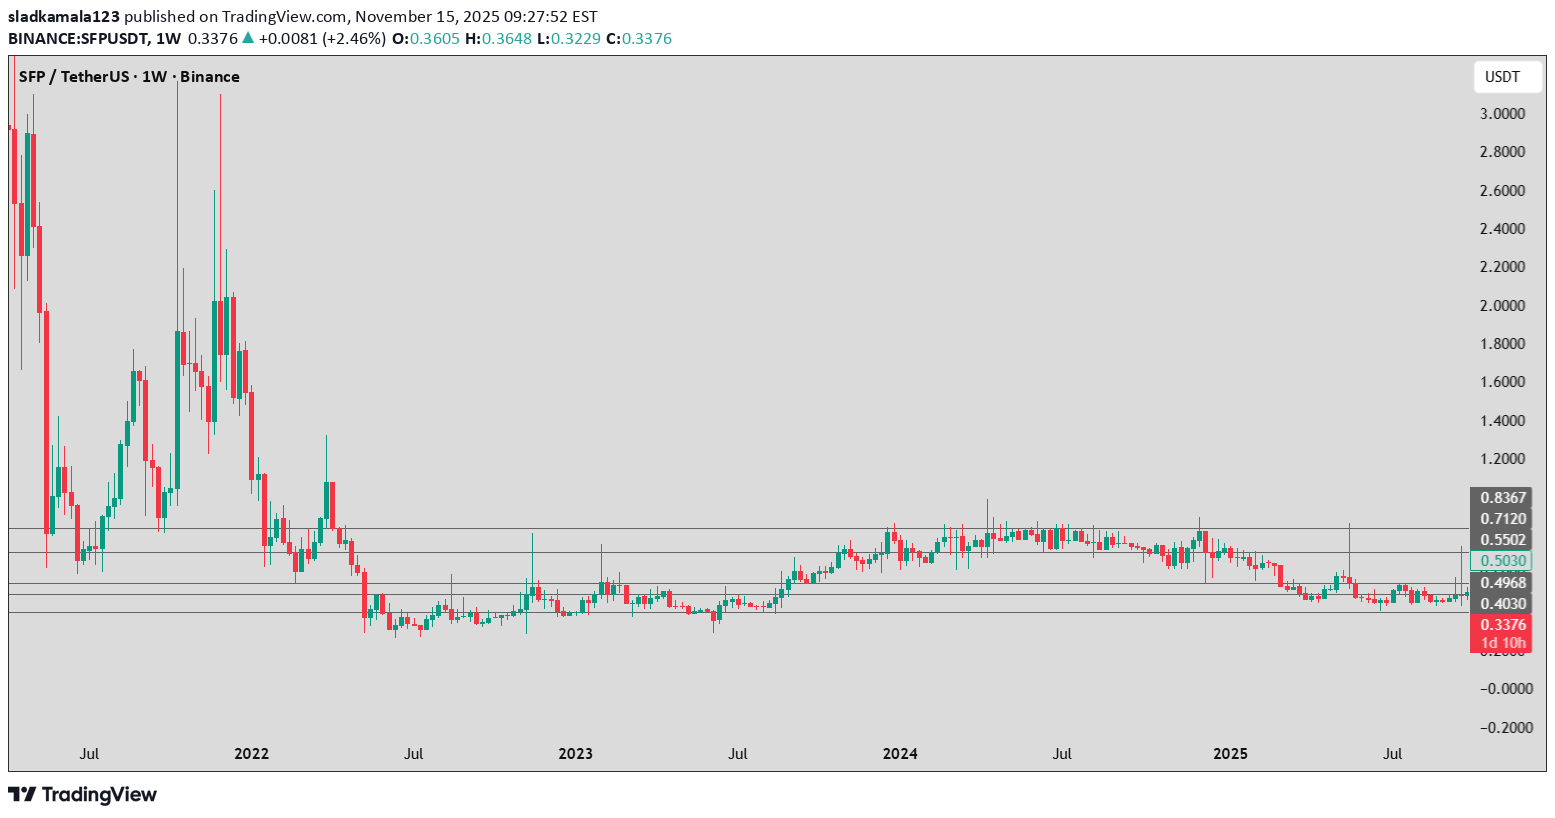
SFP is out of trend — it has been moving horizontally for 2 years, indicating a stagnation of interest. The price has been forming lower highs since the beginning of 2024, which strengthens the bearish structure. The current candle is red, but not extreme, which suggests weak but consistent selling pressure.

CakmaUstad
آینده SFP: شکست خطوط حیاتی و آغاز حرکت بزرگ!

He approached the weekly falling break. He broke his part in the diary. It is expected to start the weekly formation.

CryptoCheckGroup
سیگنالهای انفجاری SFP/USDT: آیا صعود بزرگ در راه است؟

Although the weekly shows strength in the 82 period bollinger band. However I've noticed large wicks appearing in the chart, nearly doubling the price. CCI is transitioning upward seemingly, and price is about to enter the weekly bollinger. which would trigger a mean reversion condition. It's my expectation that accumulation has been occurring in this small cap. Additionally, on the daily timeframe there is compression on all wave-pm periods larger than 14. With the short 14 period high, but eventually going to compress as well. This signals a large move on the horizon. On the monthly chart there is a cci roll up signal, indicating a flip in trend pending. Reliably the last time cci rolled a signal into trend it worked.

UmutTrades
SFPUSDT | Watching the Blue Boxes for Bullish Breakouts

SFPUSDT has settled into a well‑defined area of interest and I’ll be focused on how price behaves inside the blue box. This zone has acted as support in prior pullbacks and now it could offer traders an opportunity for a quick upside move.🟦 Blue Boxes = Support ZonesThis areas has repeatedly attracted buyers and could act as a springboard. When price returns here, it’s a signal to pay close attention.📈 Trade PlanLow Time Frame BreakoutsWait for a clear breakout on a 1hour/4hour chart inside the blue box. That tells us buyers are stepping in decisively.Volume and CDV ConfirmationA genuine move will be backed by rising trading volume and positive shifts in Cumulative Delta Volume. Without those confirmations it’s safer to stay on the sidelines.Defined RiskPlace stops just below the blue box so your downside is limited if support fails.🤝 Why Trust This SetupI focus on the setups that align volume, structure, and order flow with proven precision. My followers consistently see results because each level I share comes from real‑time market behavior and thorough analysis. Trade with the market’s confirmation and you’ll know you’re in sync with smart money rather than chasing noise.📌I keep my charts clean and simple because I believe clarity leads to better decisions.📌My approach is built on years of experience and a solid track record. I don’t claim to know it all but I’m confident in my ability to spot high-probability setups.📌If you would like to learn how to use the heatmap, cumulative volume delta and volume footprint techniques that I use below to determine very accurate demand regions, you can send me a private message. I help anyone who wants it completely free of charge.🔑I have a long list of my proven technique below:🎯 ZENUSDT.P: Patience & Profitability | %230 Reaction from the Sniper Entry🐶 DOGEUSDT.P: Next Move🎨 RENDERUSDT.P: Opportunity of the Month💎 ETHUSDT.P: Where to Retrace🟢 BNBUSDT.P: Potential Surge📊 BTC Dominance: Reaction Zone🌊 WAVESUSDT.P: Demand Zone Potential🟣 UNIUSDT.P: Long-Term Trade🔵 XRPUSDT.P: Entry Zones🔗 LINKUSDT.P: Follow The River📈 BTCUSDT.P: Two Key Demand Zones🟩 POLUSDT: Bullish Momentum🌟 PENDLEUSDT.P: Where Opportunity Meets Precision🔥 BTCUSDT.P: Liquidation of Highly Leveraged Longs🌊 SOLUSDT.P: SOL's Dip - Your Opportunity🐸 1000PEPEUSDT.P: Prime Bounce Zone Unlocked🚀 ETHUSDT.P: Set to Explode - Don't Miss This Game Changer🤖 IQUSDT: Smart Plan⚡️ PONDUSDT: A Trade Not Taken Is Better Than a Losing One💼 STMXUSDT: 2 Buying Areas🐢 TURBOUSDT: Buy Zones and Buyer Presence🌍 ICPUSDT.P: Massive Upside Potential | Check the Trade Update For Seeing Results🟠 IDEXUSDT: Spot Buy Area | %26 Profit if You Trade with MSB 📌 USUALUSDT: Buyers Are Active + %70 Profit in Total🌟 FORTHUSDT: Sniper Entry +%26 Reaction🐳 QKCUSDT: Sniper Entry +%57 Reaction📊 BTC.D: Retest of Key Area Highly Likely📊 XNOUSDT %80 Reaction with a Simple Blue Box!📊 BELUSDT Amazing %120 Reaction!📊 Simple Red Box, Extraordinary ResultsI stopped adding to the list because it's kinda tiring to add 5-10 charts in every move but you can check my profile and see that it goes on..

dubfiregama
This can push higher from here.

Expect SFP to rise +50% on spot. First target 0.31$. Stop-Loss 0.189$.
dubfiregama
TRADE. This can push higher from here.
Expect SFP to rise +65% on spot. Target 0.88$. Stop-Loss 0.49$.My entry point 0.525 $

Harold_123

SSFP has been forming a large symmetrical triangle since its listing. The market makers have deliberately used two stages over more than 1,000 days to consolidate.▍Stage 1: Consolidation lasted from 05/2022 to 10/2023, spanning 521 days (marked with a blue box).▍Stage 2: Consolidation started in 10/2023 (marked with a green box). If we estimate 521 days for this stage as well, the time point will fall on 03/16/2025, which coincides with the end of the large symmetrical triangle.Trading volume has been in a long-term downtrend. When volume shrinks to its limit, a clear breakout direction will emerge. Coupled with the upcoming peak bull market phase, it's likely to break upwards.There’s an old saying in investing: the longer the consolidation, the higher the breakout. The key players have spent 2.5 years patiently consolidating, concentrating the tokens in strong hands.When coins like this break out, they tend to "take the elevator" straight up, leaving no chance to buy in later.Based on the expected breakout range of the triangle, the maximum potential upside is approximately 43x from the breakout point, targeting a price of $34.I believe this is the perfect time to enter. What do you think?
Disclaimer
Any content and materials included in Sahmeto's website and official communication channels are a compilation of personal opinions and analyses and are not binding. They do not constitute any recommendation for buying, selling, entering or exiting the stock market and cryptocurrency market. Also, all news and analyses included in the website and channels are merely republished information from official and unofficial domestic and foreign sources, and it is obvious that users of the said content are responsible for following up and ensuring the authenticity and accuracy of the materials. Therefore, while disclaiming responsibility, it is declared that the responsibility for any decision-making, action, and potential profit and loss in the capital market and cryptocurrency market lies with the trader.