
RUNE
THORChain
| تریدر | نوع سیگنال | حد سود/ضرر | زمان انتشار | مشاهده پیام |
|---|---|---|---|---|
No results found. | ||||
Price Chart of THORChain
سود 3 Months :
سیگنالهای THORChain
Filter
Sort messages by
Trader Type
Time Frame

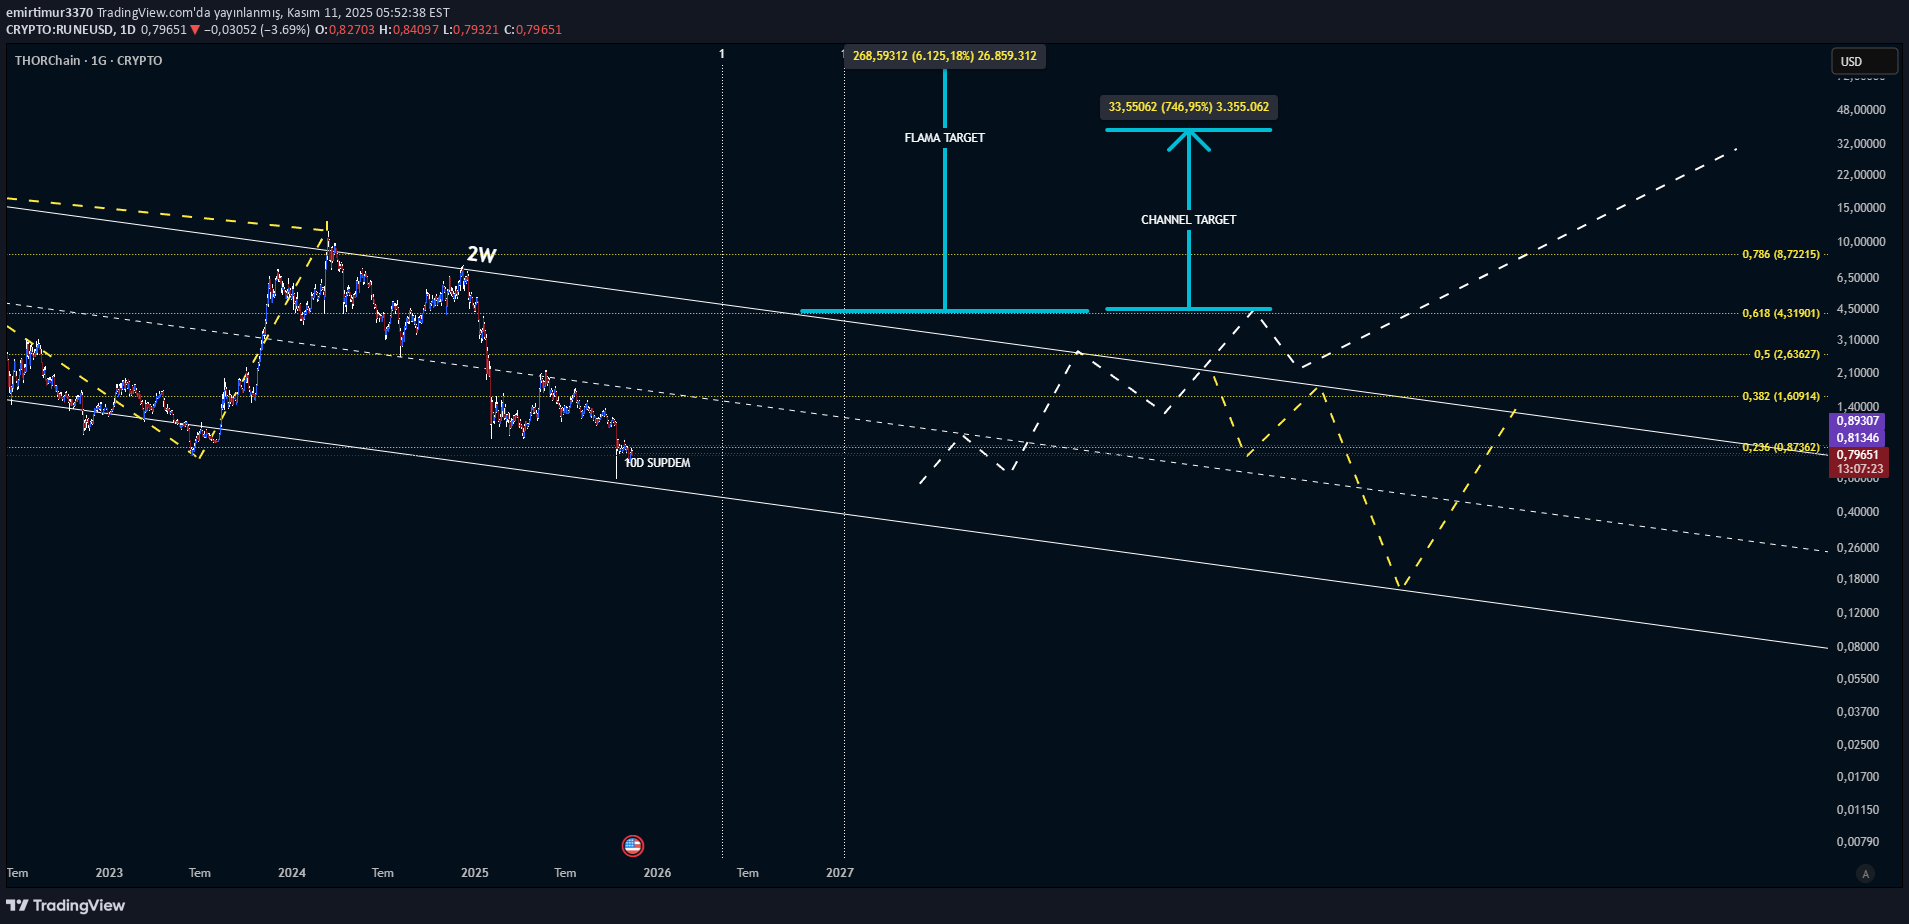
CRYPTO:RUNEUSD RUNEBTC ANALİZİ İLE UYUMLU SAYIM
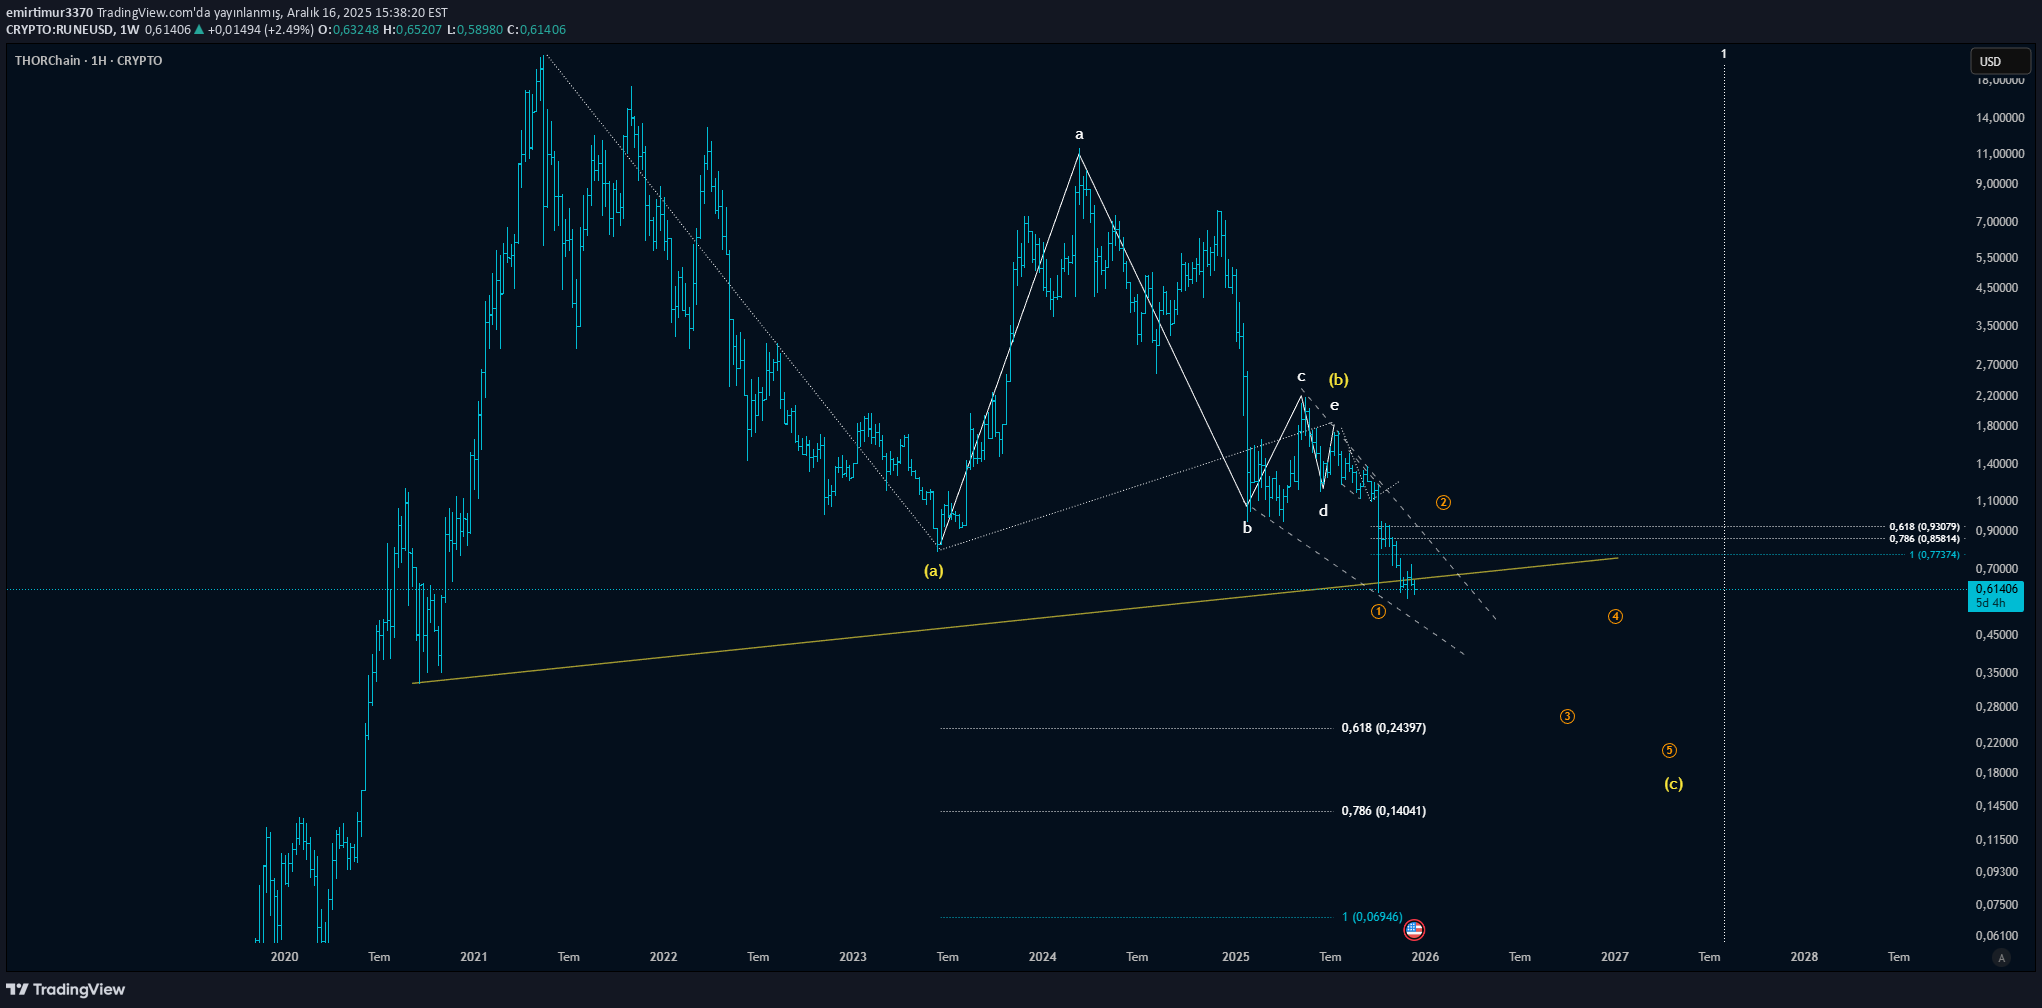
My latest RUNEBTC analysis: ytd.Thetausd was actually in a similar scenario.
CRYPTO:RUNEBTC KORELASYONU İLE GERİ DÖNÜŞ 2027'YE Mİ KALDI?
This zigzag scenario in RUNEBTC indicates that the return may occur in the 2026-2027 season. YTD. In the coming period, it may try to test the falling trend to complete the formation. Latest Runeusd analysis:
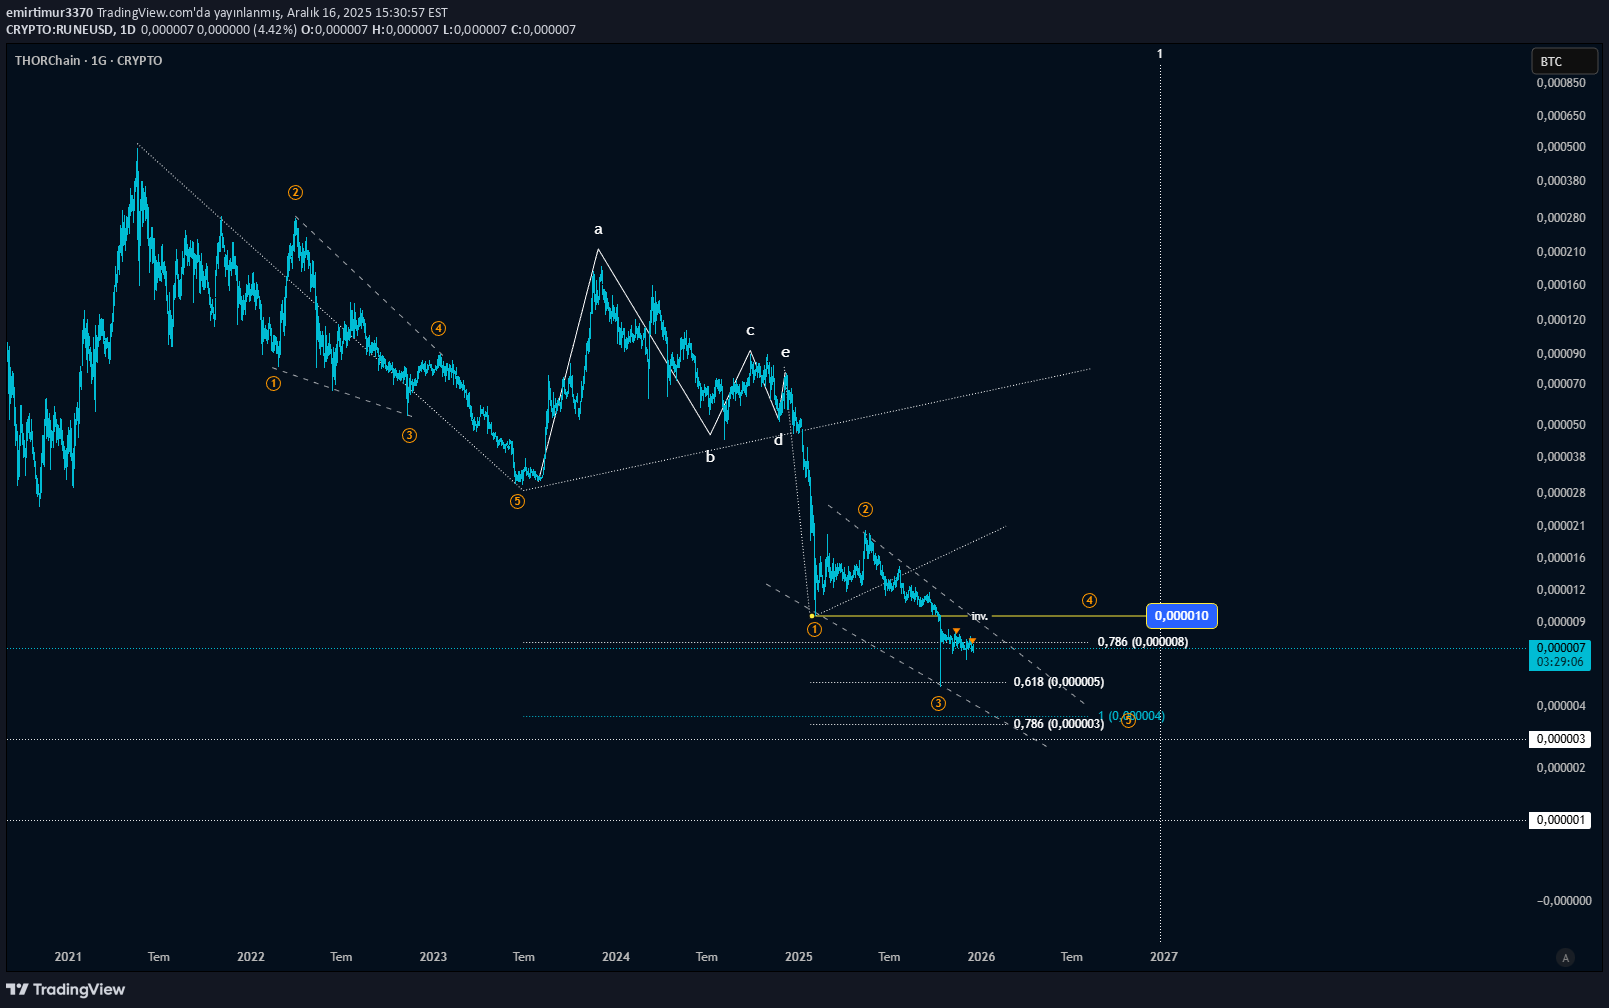
CRYPTO:RUNEUSD EWA MAKRO DÜZELTME
Double zigzag possibility in Runeusd Previous technical analysis:

alfra
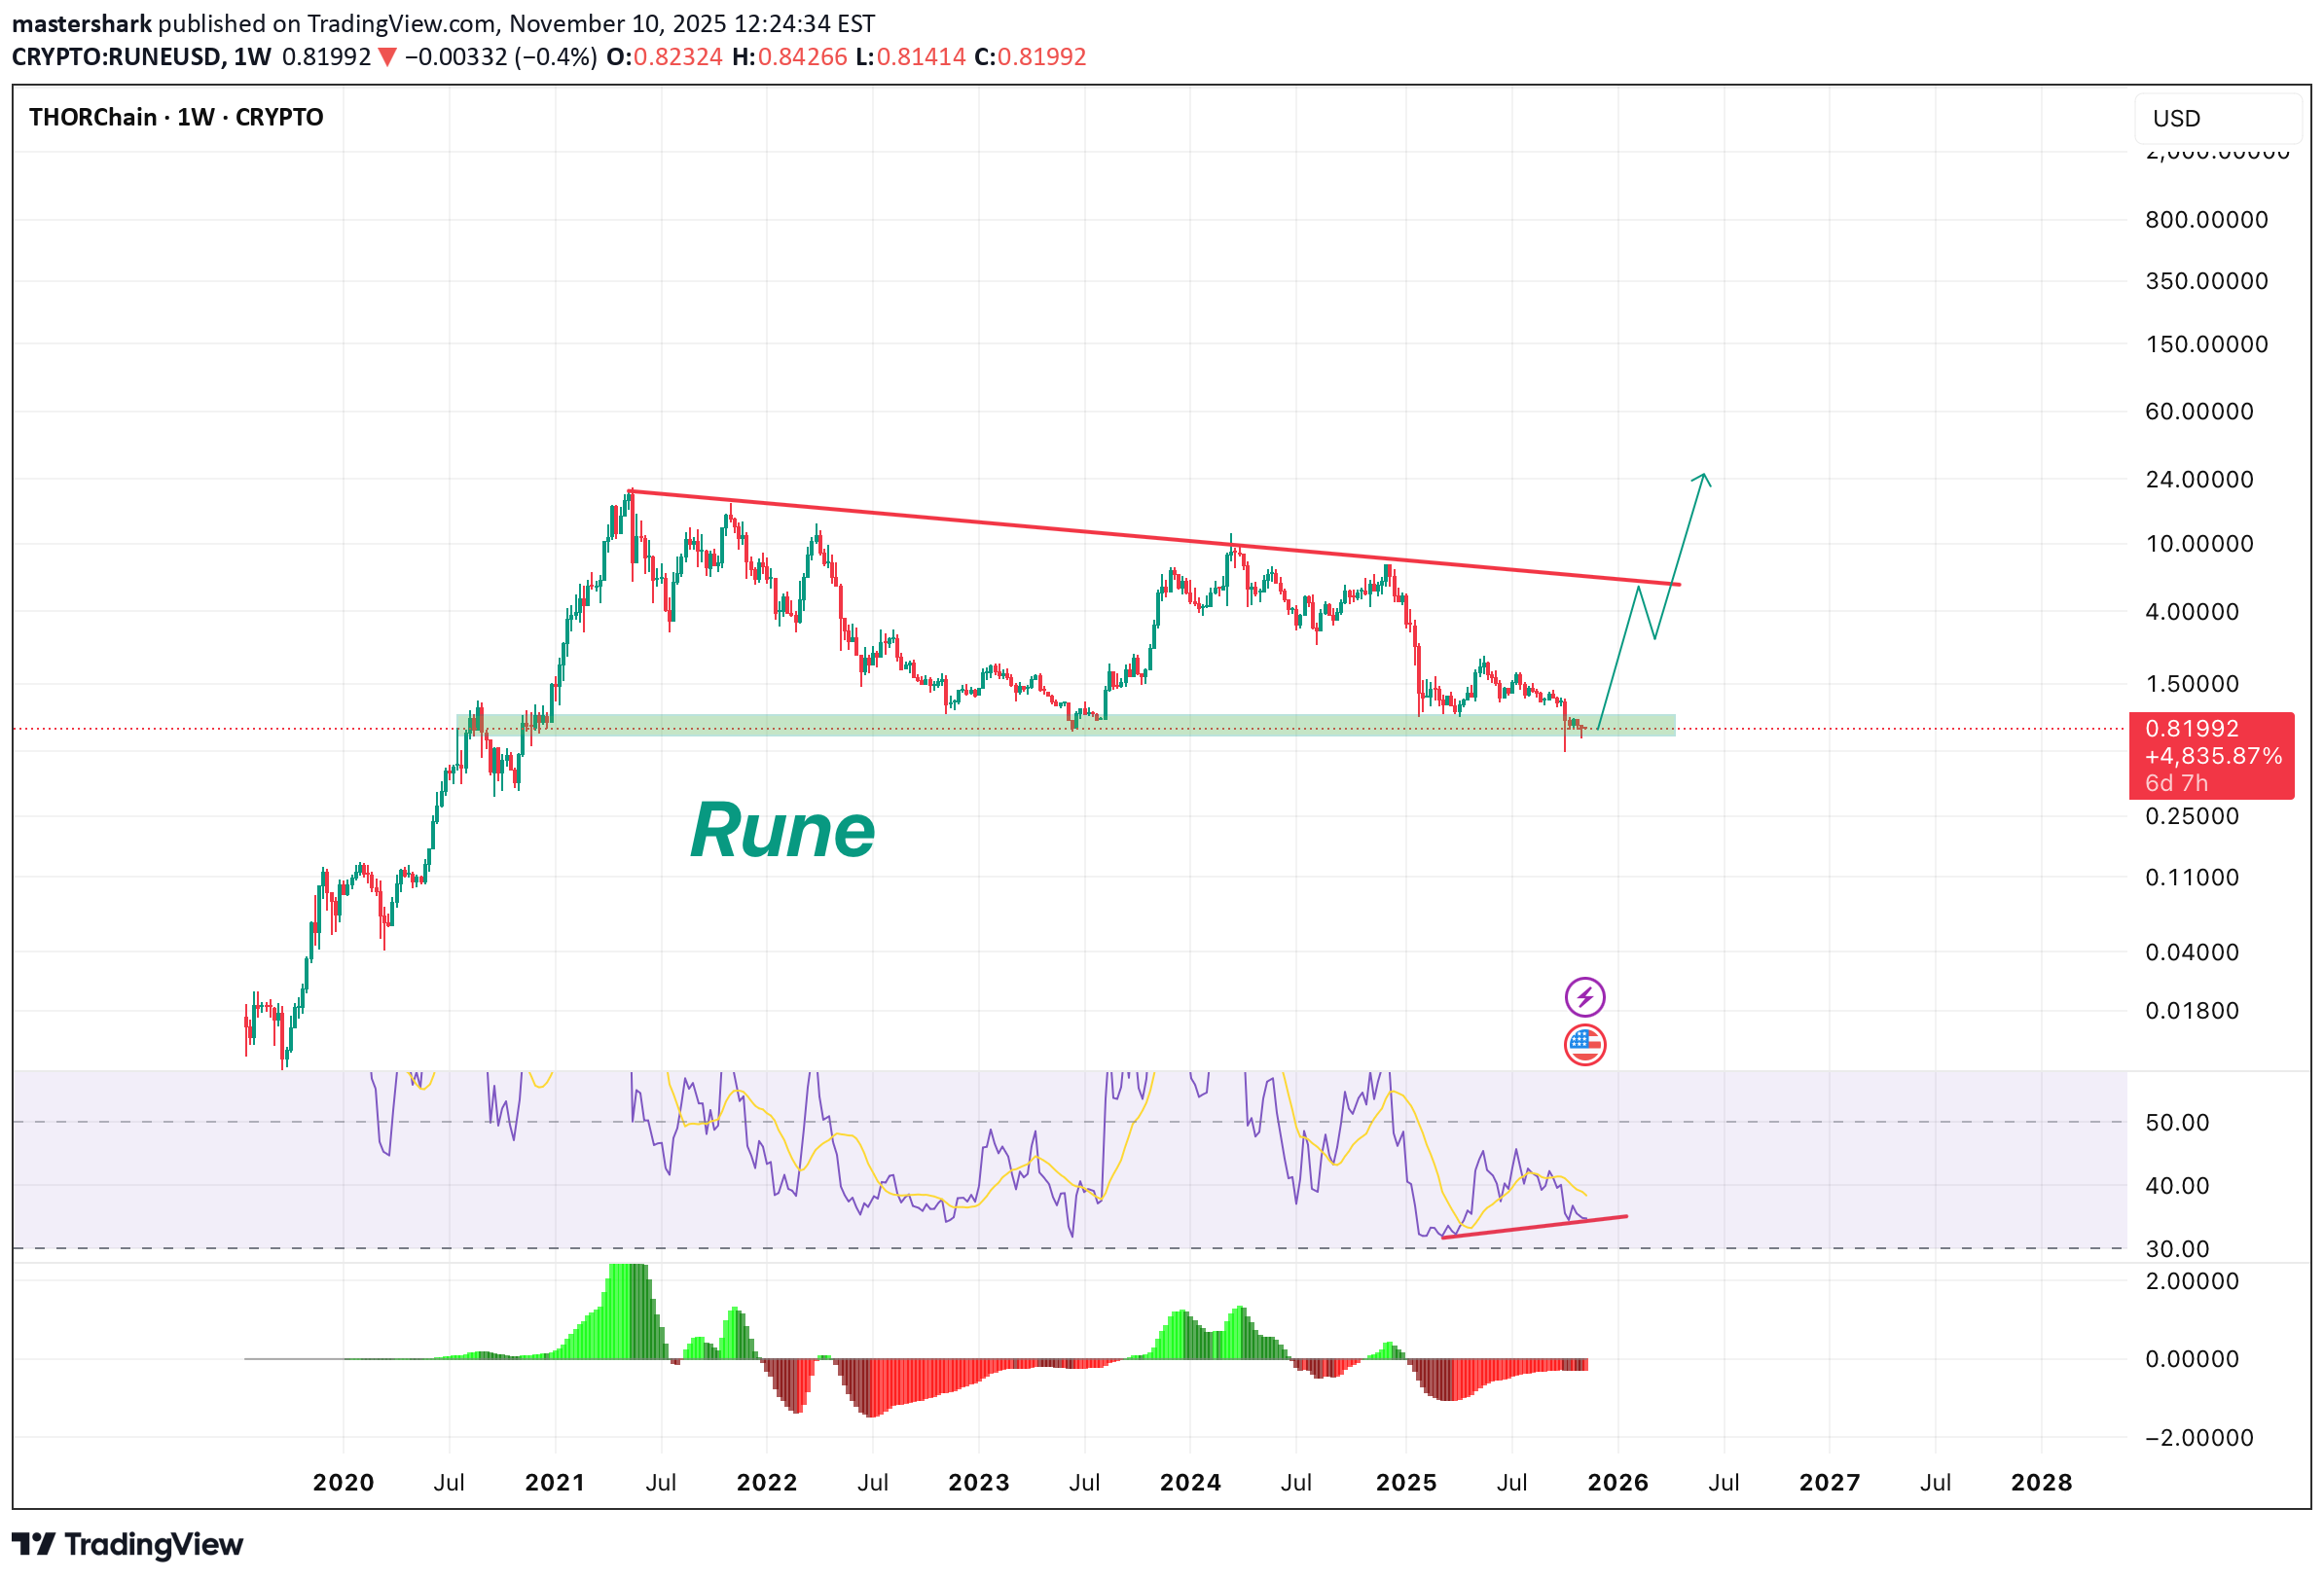
RUNE - oversold! will it hold?
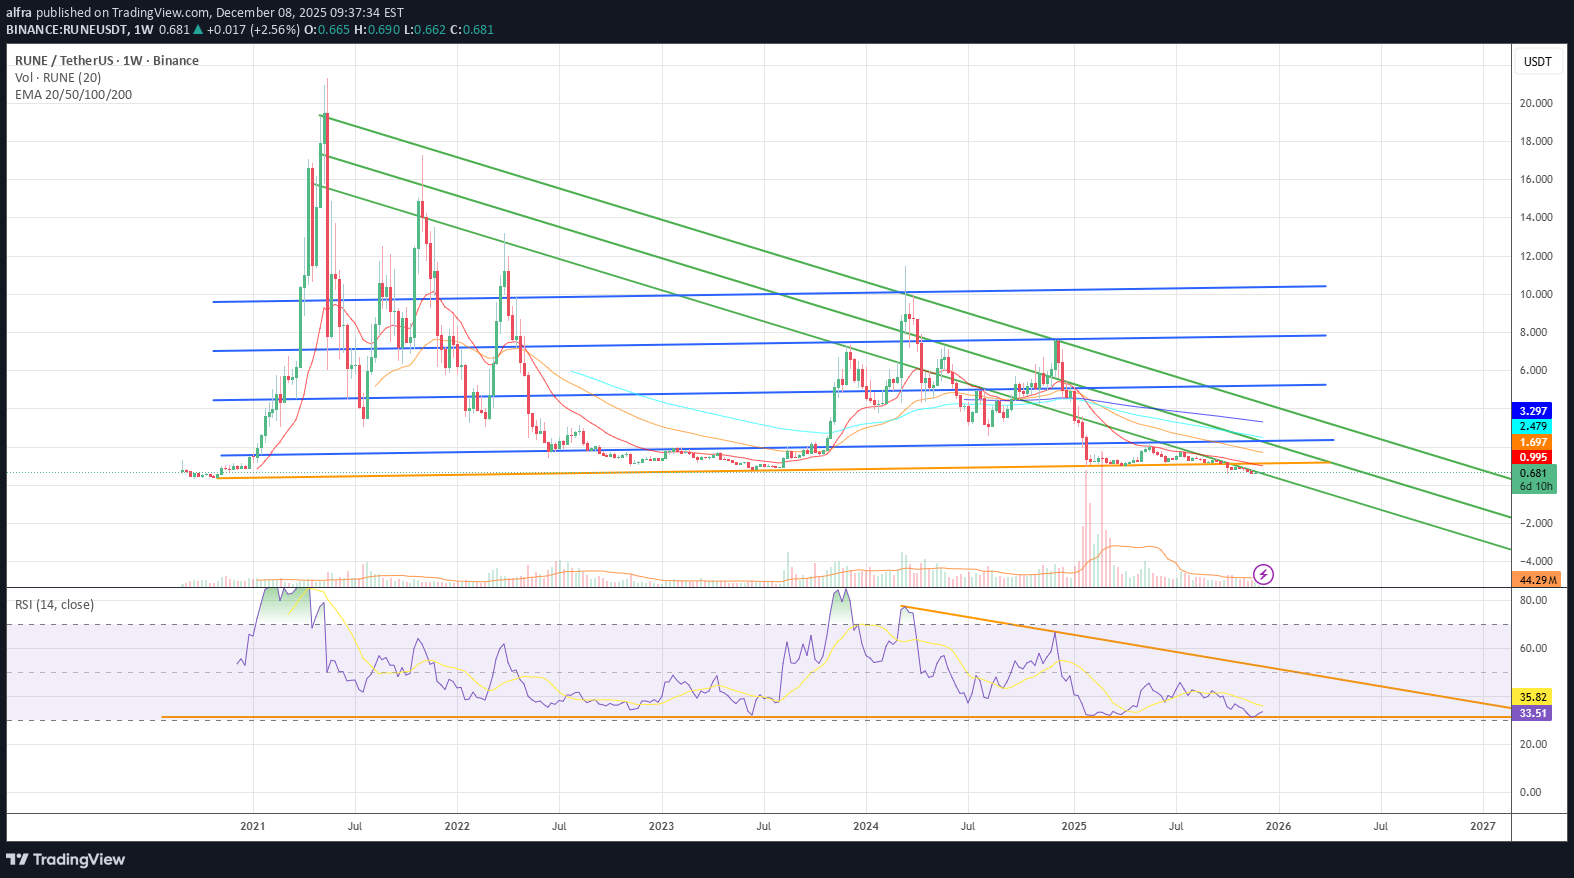
I don’t see any significant negative shift in fundamentals — if anything, I sense a possible fundamental strengthening for THORChain. The first blue line (price above roughly $2) remains my minimum target. Given the weekly RSI levels are historically this oversold (on Binance), a bounce to the first target looks plausible. If momentum returns, a second target around $4 also seems within reach. Fundamental Strength — Why RUNE / THORChain could support higher targets Here are the main reasons why fundamentals might back a bullish move: Key utility token for a fully decentralized cross-chain swap network. RUNE is not just another “token,” but the settlement asset for all liquidity pools on THORChain — every asset that sits in THORChain’s pools is paired 1:1 with RUNE. That means every swap fundamentally requires RUNE, creating structural demand as long as usage grows. Security and network bonding increase demand — not just trading demand. Validators (node operators) must bond RUNE (often 2× the amount pooled) to secure the network. As activity, liquidity or total value locked on THORChain increases, the amount of RUNE needed for bonding rises — which can lead to upward pressure on RUNE’s price. Multi-chain, permissionless cross-chain liquidity — well positioned in DeFi infrastructure. THORChain enables native asset swaps across different blockchains without wrapped tokens or centralized intermediaries, which is a unique and attractive value proposition in DeFi. As cross-chain demand and adoption grows, RUNE’s role becomes more central. Tokenomics offer a clean setup. Circulating supply of RUNE is ~ 350 M (with total supply on protocol docs roughly ~425 M — though supply mechanisms may evolve). Because RUNE is required for all swaps / liquidity / staking / governance / security, its demand isn’t merely speculative — it’s functional. Given that structure, a rally — especially after deep oversold pressure — could very well be underpinned by real utility demand, not just speculative interest. That aligns with your bullish target zones.
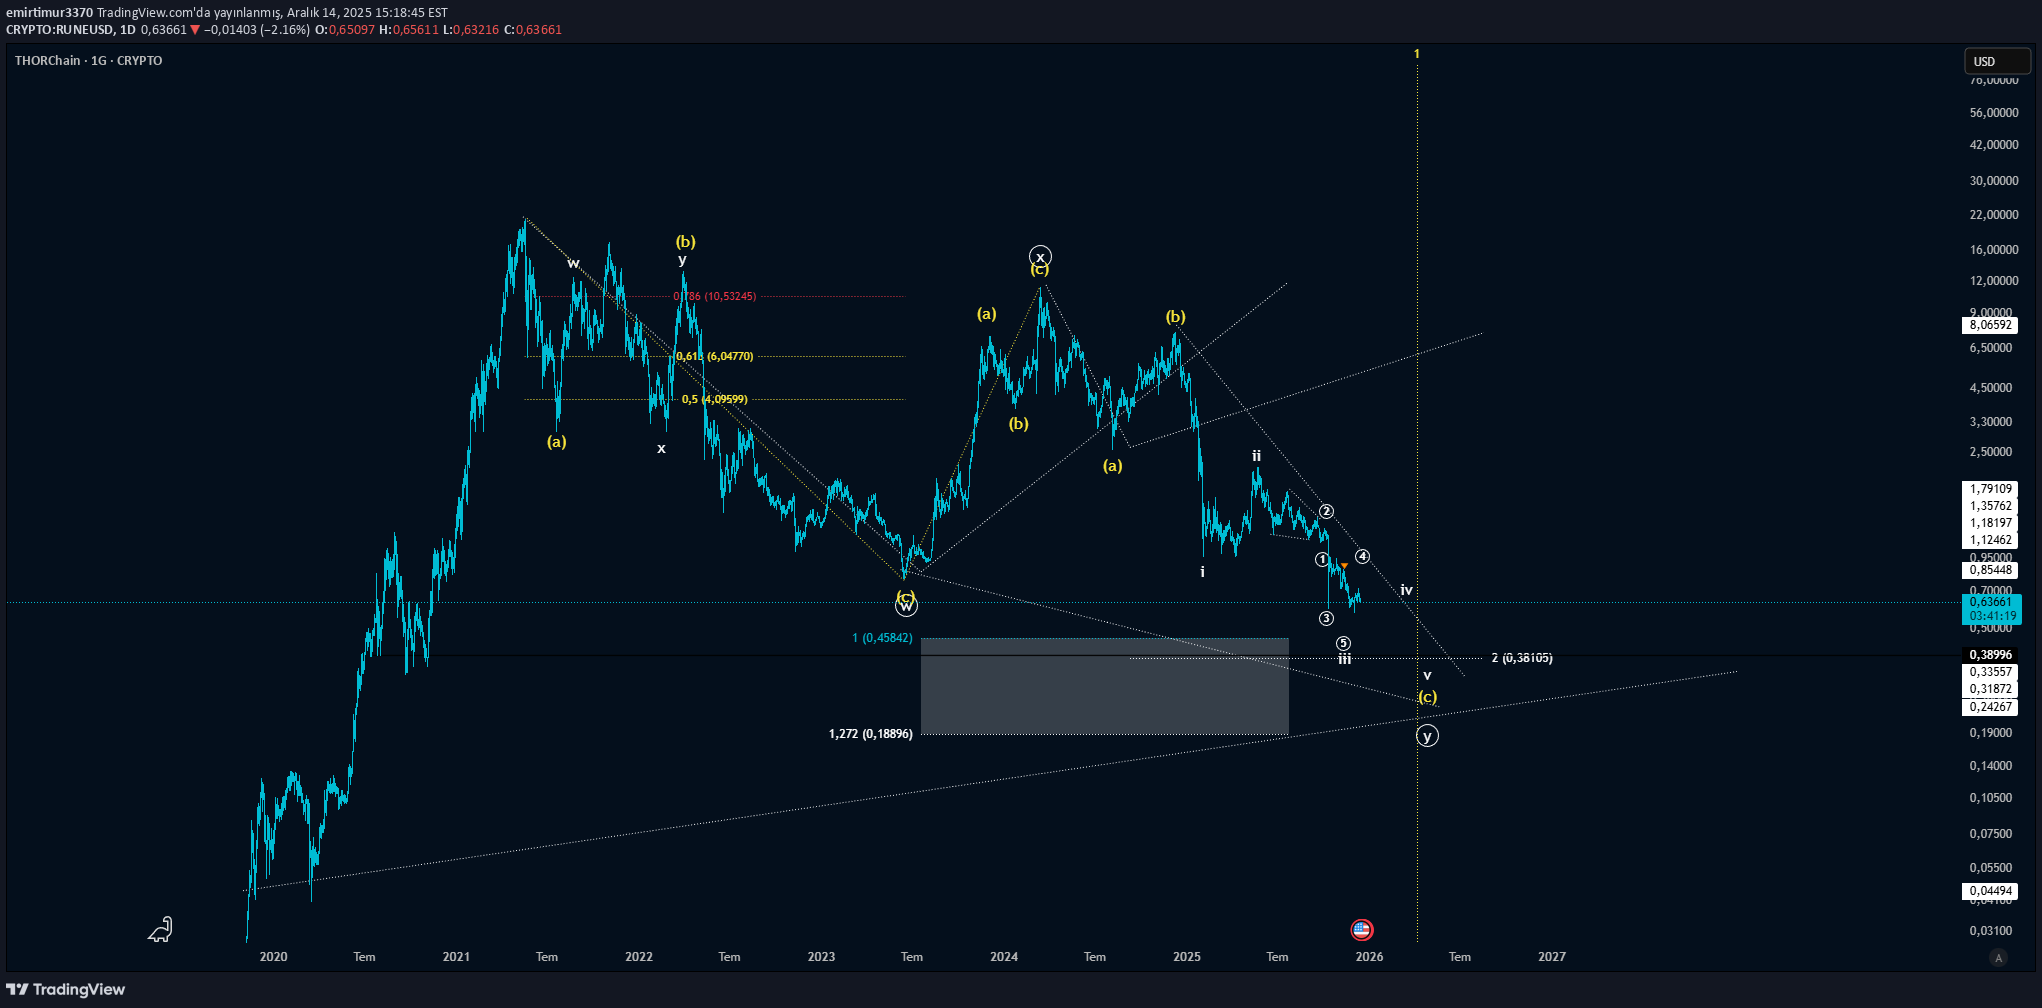
تحلیل تکنیکال و نقشه راه RUNE/USD: اهداف قیمتی و نقاط ورود کلیدی
My opinion on trading targets and trade entry locations on RUNEUSD is YTD. It is specified not to be. Details are on the chart. Good luck. The graph is Logarithmic.

رون (Rune) دوباره اوج میگیرد؟ تحلیل کف قیمت و زمان خرید طلایی!
I’m so excited about Rune . It’s an essential to the market and will do great in the green like it used to , it’s very cheap and worth stacking, last cycle and this one are pretty much rhythm wise, you can see it in the macd behaviour, for me it’s the bottom sign and I anticipate a slow reversal in coming weeks. Stay safe guys

Bithereum_io
تحلیل تکنیکال RUNE/USDT: آیا این حمایت قوی، مسیر صعودی به سمت ۱.۸ دلار را باز میکند؟
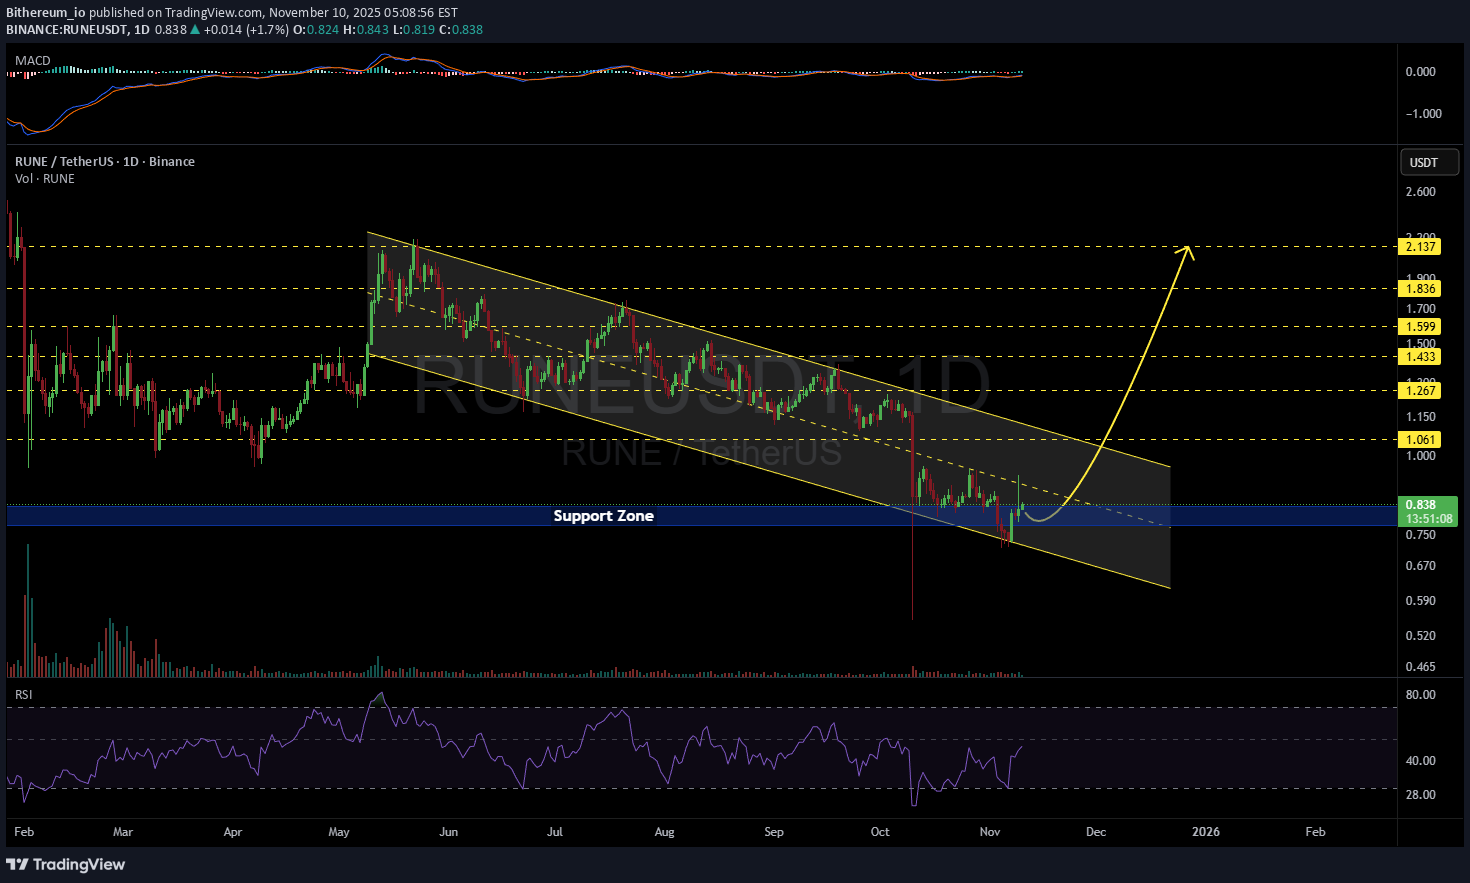
#RUNE is currently trading within a descending channel on the daily chart and is sitting on a strong support zone. For the bullish scenario to remain valid, it must hold above this level. In case of a breakout above the channel resistance, the potential upside targets are: 🎯 $1.061 🎯 $1.267 🎯 $1.433 🎯 $1.599 🎯 $1.836 🎯 $2.137 ⚠️ Always use a tight stop-loss and maintain proper risk management.

CryptoNuclear
RUNE در نقطه حساس: آیا صعود بزرگ در راه است یا سقوط نهایی؟ (تحلیل کلیدی قیمت)
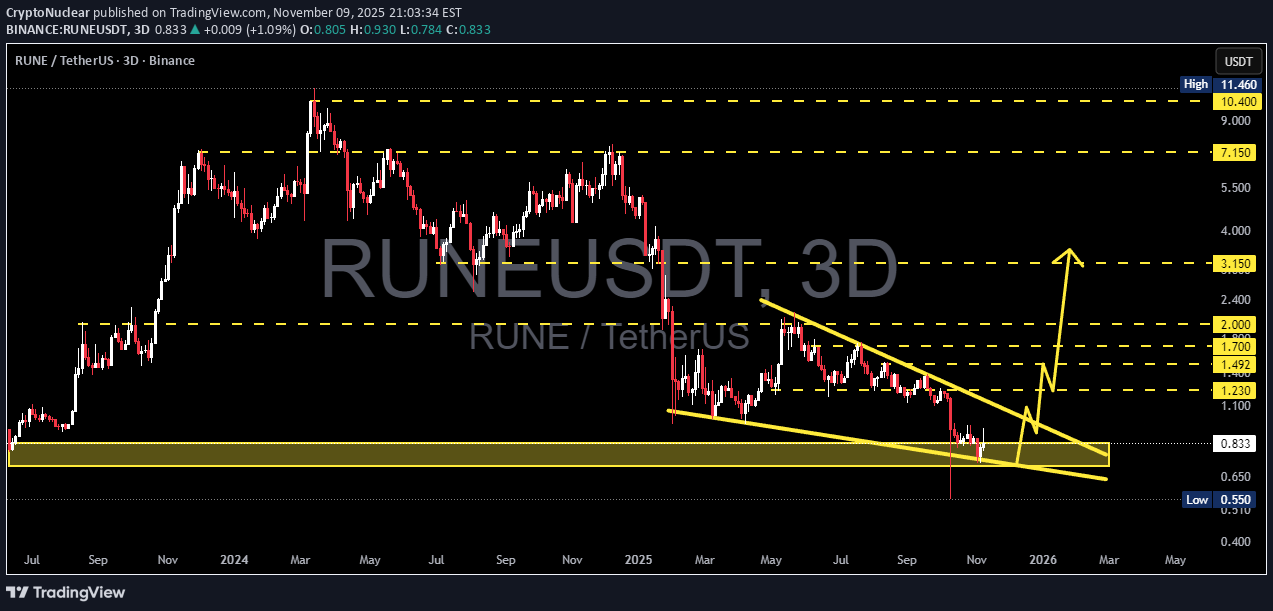
After a prolonged downtrend from the peak around $11.46, RUNE/USDT has now returned to the golden zone ($0.70–$0.833) — a major historical support area that once served as the launchpad for a massive rally. The price structure reveals a Falling Wedge pattern, a classic formation that often signals a potential trend reversal after a phase of exhaustion and distribution. However, despite this bullish potential, the market remains at a crucial inflection point — where every candle in this zone could mark the beginning of a strong rebound... or the confirmation of a deeper breakdown to new lows. --- Pattern & Structure Details Main Pattern: Falling Wedge / Descending Channel The narrowing trendlines indicate weakening selling pressure and potential for trend exhaustion. Major Support Zone: $0.70 – $0.833, a strong demand area that has acted as a key pivot since mid-2023. Key Resistance Levels (potential targets): R1: $1.23 R2: $1.49 – $1.70 R3: $2.00 – $3.15 Critical Low: $0.55 → a break below this level could open further downside towards $0.40 or even $0.30. --- Bullish Scenario (Potential Major Reversal) If price holds above $0.70–$0.833 and then breaks out above the wedge trendline, it could confirm a strong reversal signal. A 3D bullish candle with rising volume would serve as a powerful confirmation for a trend change. Step-by-step upside targets: T1: $1.23 → Initial resistance and short-term profit-taking zone. T2: $1.49 – $1.70 → Mid-term reaction area. T3: $2.00 – $3.15 → High-confidence target zone if a new bullish trend forms. A valid breakout in this area could mark the end of the capitulation phase and the beginning of a new accumulation phase, similar to previous pre-rally setups. --- Bearish Scenario (Final Breakdown Before Recovery) If the $0.70 zone fails to hold and a 3D candle closes below it, the wedge structure will lose strength, opening downside continuation targets at: $0.55 (previous low) as the first support, followed by $0.40 – $0.30 if heavy selling continues. However, beware of fake breakdowns (false breaks) followed by rapid recoveries — these often act as bear traps before a major bullish reversal. --- Analysis Summary 📊 RUNE is standing at a major decision point. The $0.70–$0.833 zone is the last line of defense — if it holds, a wedge breakout could ignite a new bullish leg. If it fails, the market may seek new lows before establishing a real bottom. This moment will determine whether we’re witnessing smart money accumulation or the final phase of capitulation before the next market cycle begins. #RUNE #RUNEUSDT #CryptoAnalysis #AltcoinWatch #FallingWedge #CryptoSetup #SupportZone #BullishScenario #BearishScenario #MarketDecision #CryptoTA #SwingTrade #TechnicalAnalysis

abdullahnasir2000
شکست طلایی ران (RUNE): فرصت خرید با سود تضمینی ۱۰ تا ۱۵ درصدی!
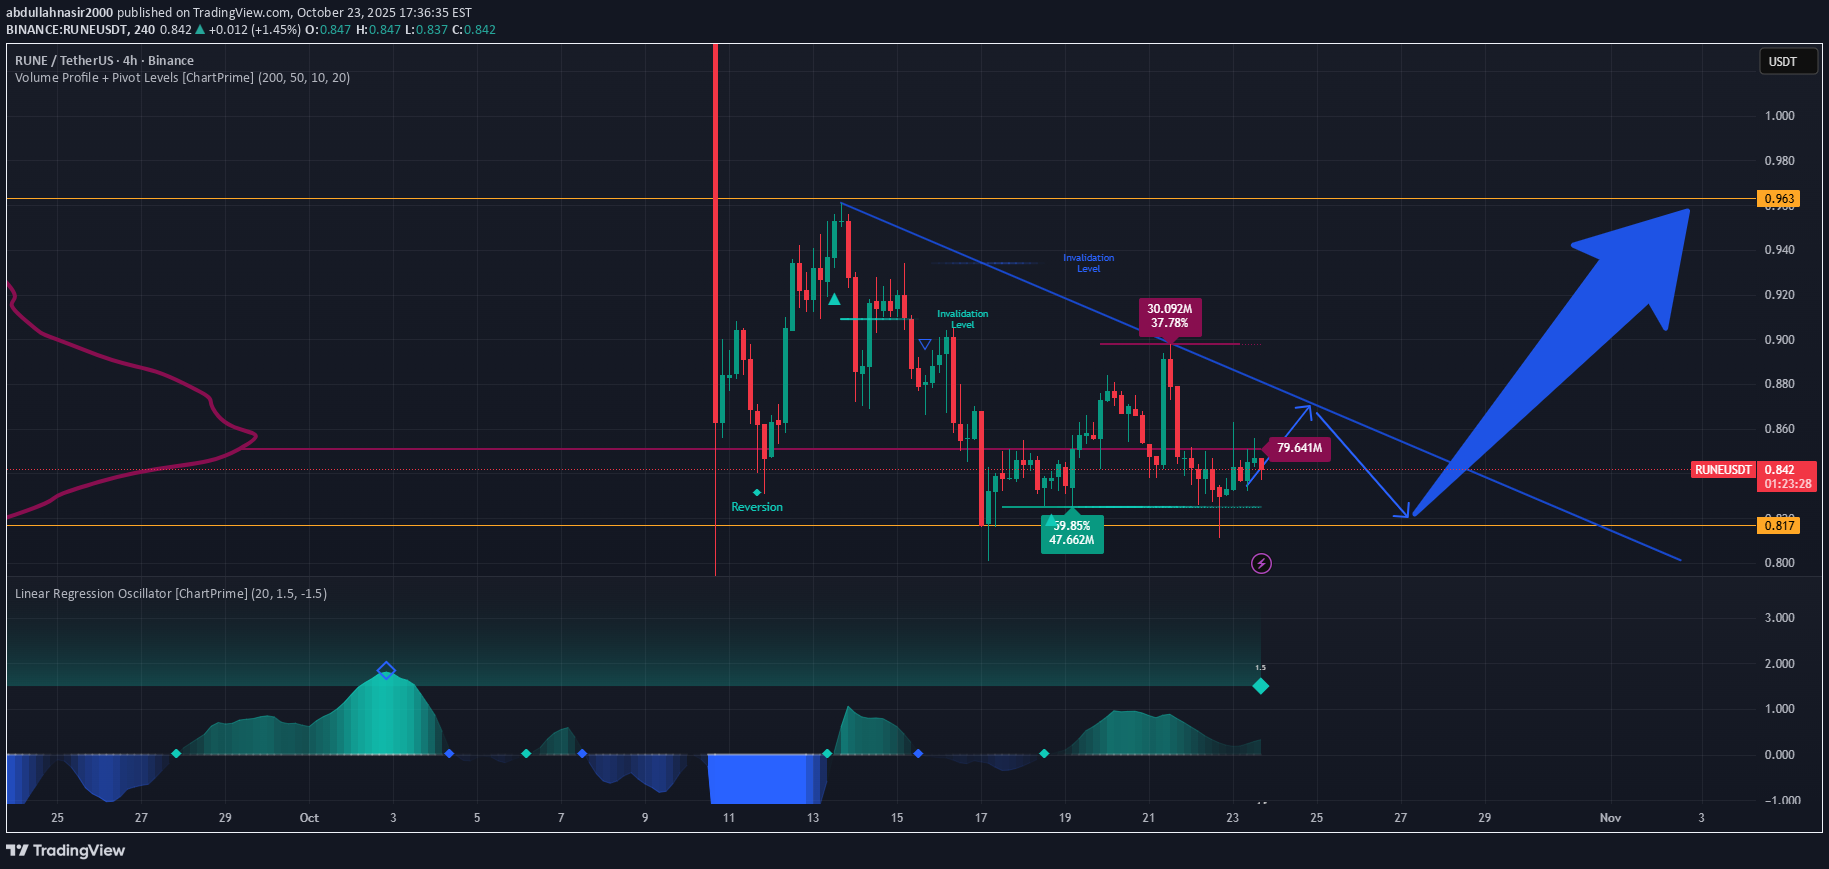
The upcoming week for all Altcoins are crucial especially for RUNEUSDT. A Bullish Wedge is forming making it a Perfect Position for Long for easy 10-15% Profit in Spot.

InnerCircleIDN
Rune Thor Chain Saatnya DCA
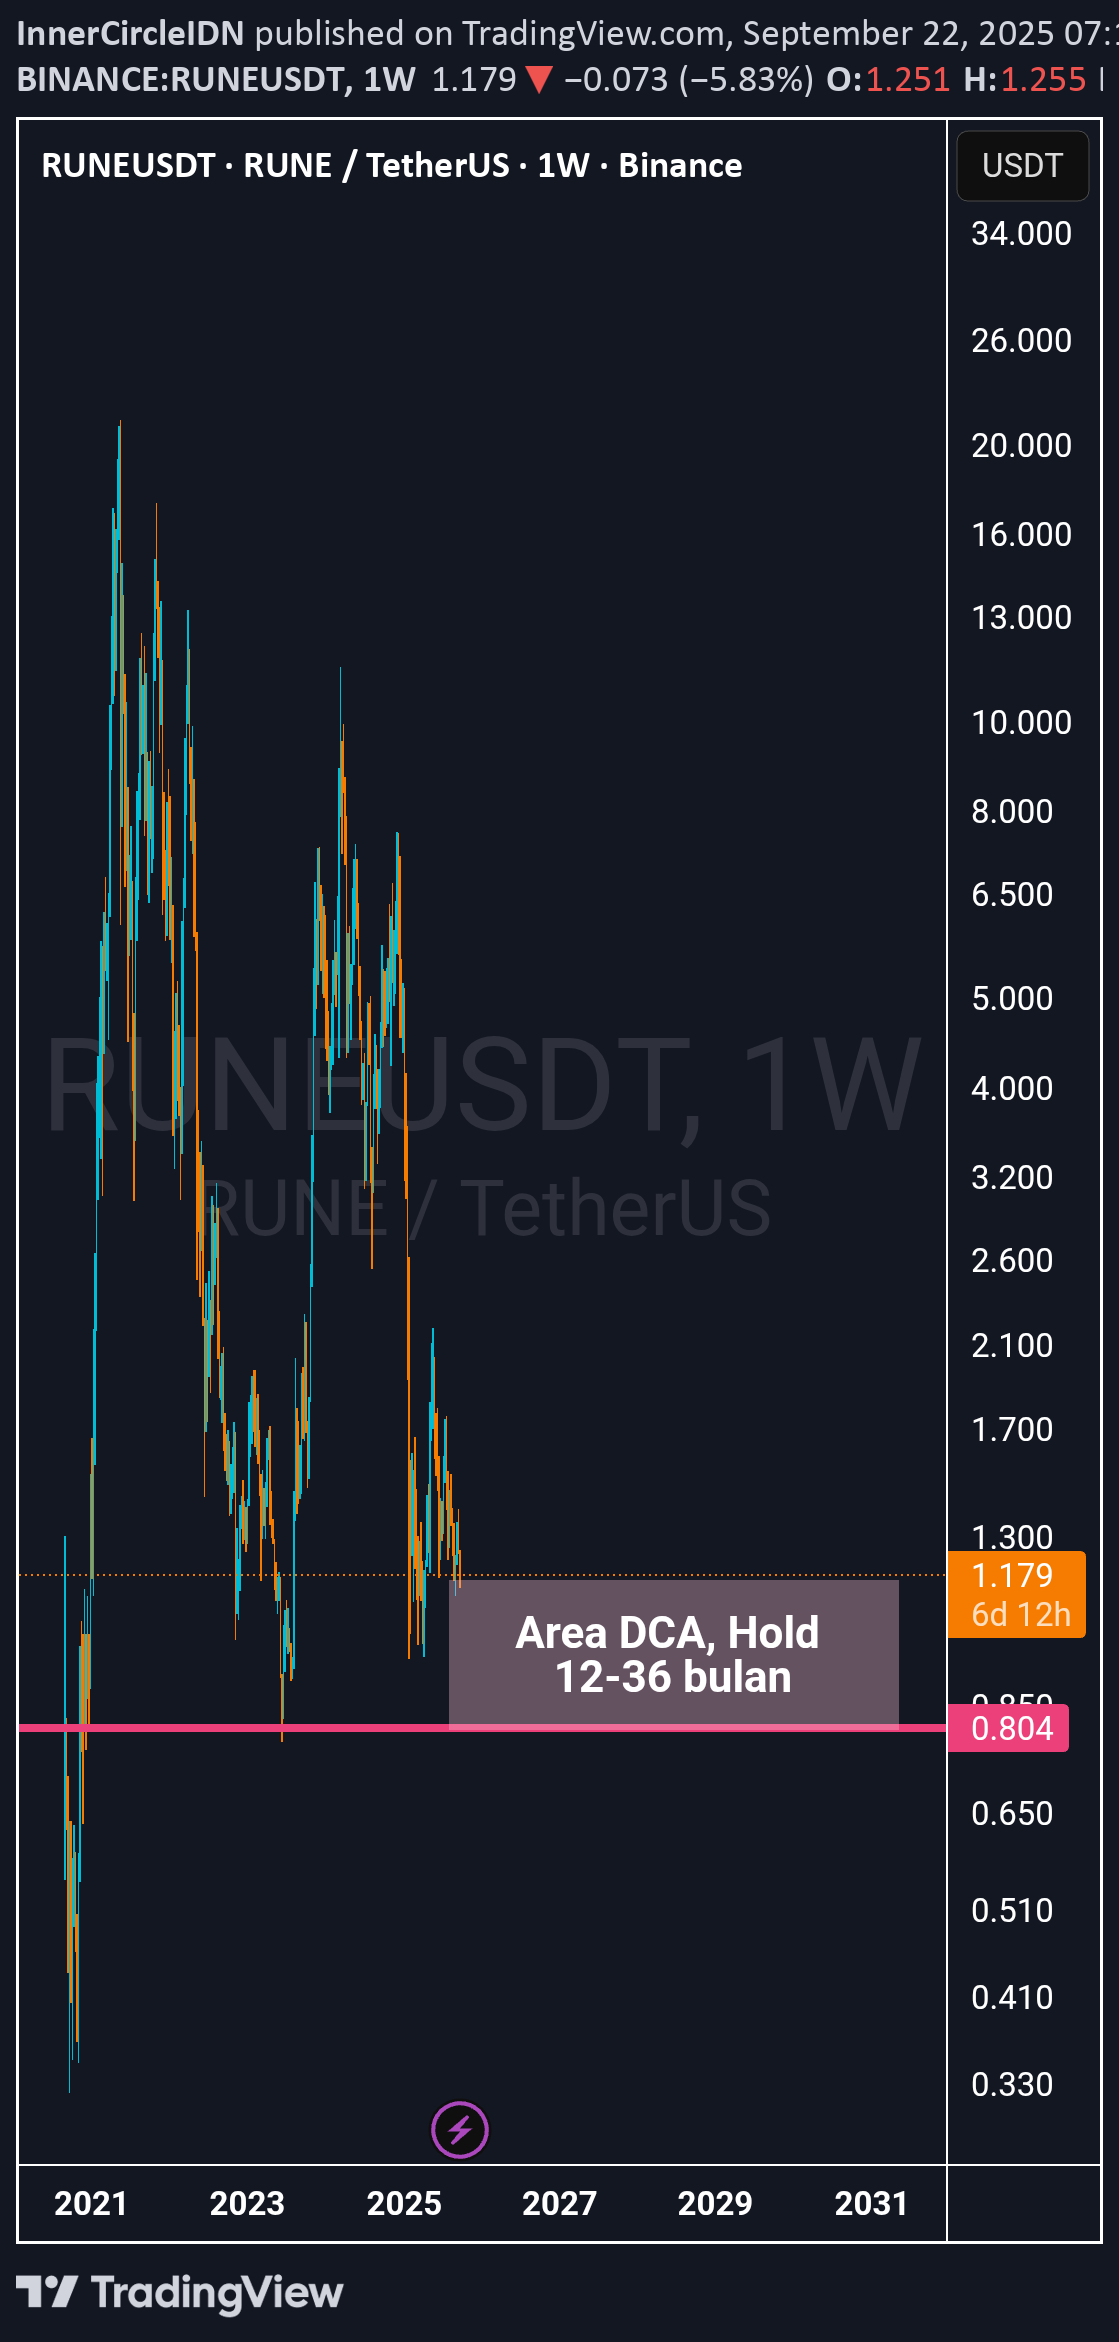
I used the latest market data and key events: a price of around $1.18–$1.27 and a circulating supply of ~351.3 million RUNE. THORChain is also dealing with a debt issue of ~$200 million (planned conversion to equity tokens/restructuring) that impacts risk and liquidity. Basic assumptions (used in calculations): Circulating supply (≈) = 351,300,000 RUNE. The current benchmark price is estimated at $1.27 (an example for calculating the current market cap). There are solvency/restructuring issues (≈ $200 million in debt) that increase short-term uncertainty. Conversion example — current market cap (illustration): 351,300,000 × $1.27 = 351,300,000 + (351,300,000 × 0.27) 351,300,000 × 0.27 = 94,851,000 ⇒ market cap ≈ $446,151,000. (Check price and supply sources for rounding). --- Price projection (3 scenarios) > Note: I also include an implied market cap for each target = target price × 351,300,000. 1) Optimistic Scenario (adoption + reputation recovery) Trigger assumptions: successful debt conversion without harming RUNE holders, increased integrations and swap volume, restored trust, surge in TVL and LP. Price Target (12–36 months): $8 – $20 Implied market cap $8 → 351,300,000 × 8 = $2,810,400,000. Implied market cap $20 → 351,300,000 × 20 = $7,026,000,000. Probability (subjective): ~15–25% (needs many positive things to happen). Short Rationale: RUNE could be valued as critical cross-chain infrastructure if swap volume and TVL grow rapidly. 2) Moderate Scenario (slow recovery/stability) Assumptions: restructuring is underway, services are gradually restored, volumes are slowly increasing, but regulation and competition remain pressing. Price Target (12–36 months): $2 – $6 Implied market cap $2 → $702,600,000. Implied market cap $6 → $2,107,800,000. Probability: ~45–60%. Rationale: Consumers and LPs gradually returning; the token is still far from its ATH, with room for upside if solvency issues don't destroy trust. 3) Pessimistic Scenario (loss of trust/regulation/liquidity) Assumptions: The restructuring fails or is highly detrimental to token holders, strict regulation, or a security incident/large LP withdrawal. Price target (6–24 months): $0.30 – $1.00 (or lower) Implied market cap $0.30 → 351,300,000 × 0.30 = $105,390,000. Implied market cap $1.00 → $351,300,000. Probability: ~20–35%. Rationale: Solvency and reputation issues could drive liquidity outflows. (Market data sources and restructuring/delay events: CoinGecko, CoinMarketCap, Cointelegraph, Messari — see news summary on servicing whales and $200M debt conversion plan). --- Practical recommendations/risk management rules 1. Position sizing (conservative advice): No more than 1–3% of total investment portfolio for speculative allocations like RUNE; If aggressive, limit to a maximum of 5%. 2. Logical entry points (based on a moderate scenario): buy incrementally in the $0.8–$1.8 range (dollar-cost averaging). 3. Stop-loss & take-profit: Conservative example — initial stop-loss 30–50% of entry price (depending on tolerance), gradual take-profit targets depending on the scenario (e.g., sell partially at $2–$6, then sell again at $8+). 4. Checkpoints (should be monitored weekly/monthly): Updates on $200M debt conversion & governance decisions. Total swap volume & 24-hour spot volume (rising indicates adoption). Total RUNE pooled / TVL & number of active validator nodes (determines security & liquidity). Legal/regulatory news and security audits. --- What can I build next (immediately) Pick one and I'll work on it now: 1. Create a numerical projection model (simple Monte-Carlo or deterministic scenario) that generates a probability curve and estimated date (I'm assuming supply and volume). 2. A concise dashboard (table) showing target price → implied market cap → % increase from current price. 3. A news and metrics notification checklist (a checklist format that you can monitor weekly).
Disclaimer
Any content and materials included in Sahmeto's website and official communication channels are a compilation of personal opinions and analyses and are not binding. They do not constitute any recommendation for buying, selling, entering or exiting the stock market and cryptocurrency market. Also, all news and analyses included in the website and channels are merely republished information from official and unofficial domestic and foreign sources, and it is obvious that users of the said content are responsible for following up and ensuring the authenticity and accuracy of the materials. Therefore, while disclaiming responsibility, it is declared that the responsibility for any decision-making, action, and potential profit and loss in the capital market and cryptocurrency market lies with the trader.