
alfra
@t_alfra

What symbols does the trader recommend buying?
Purchase History
پیام های تریدر
Filter
alfra
RUNE - oversold! will it hold?
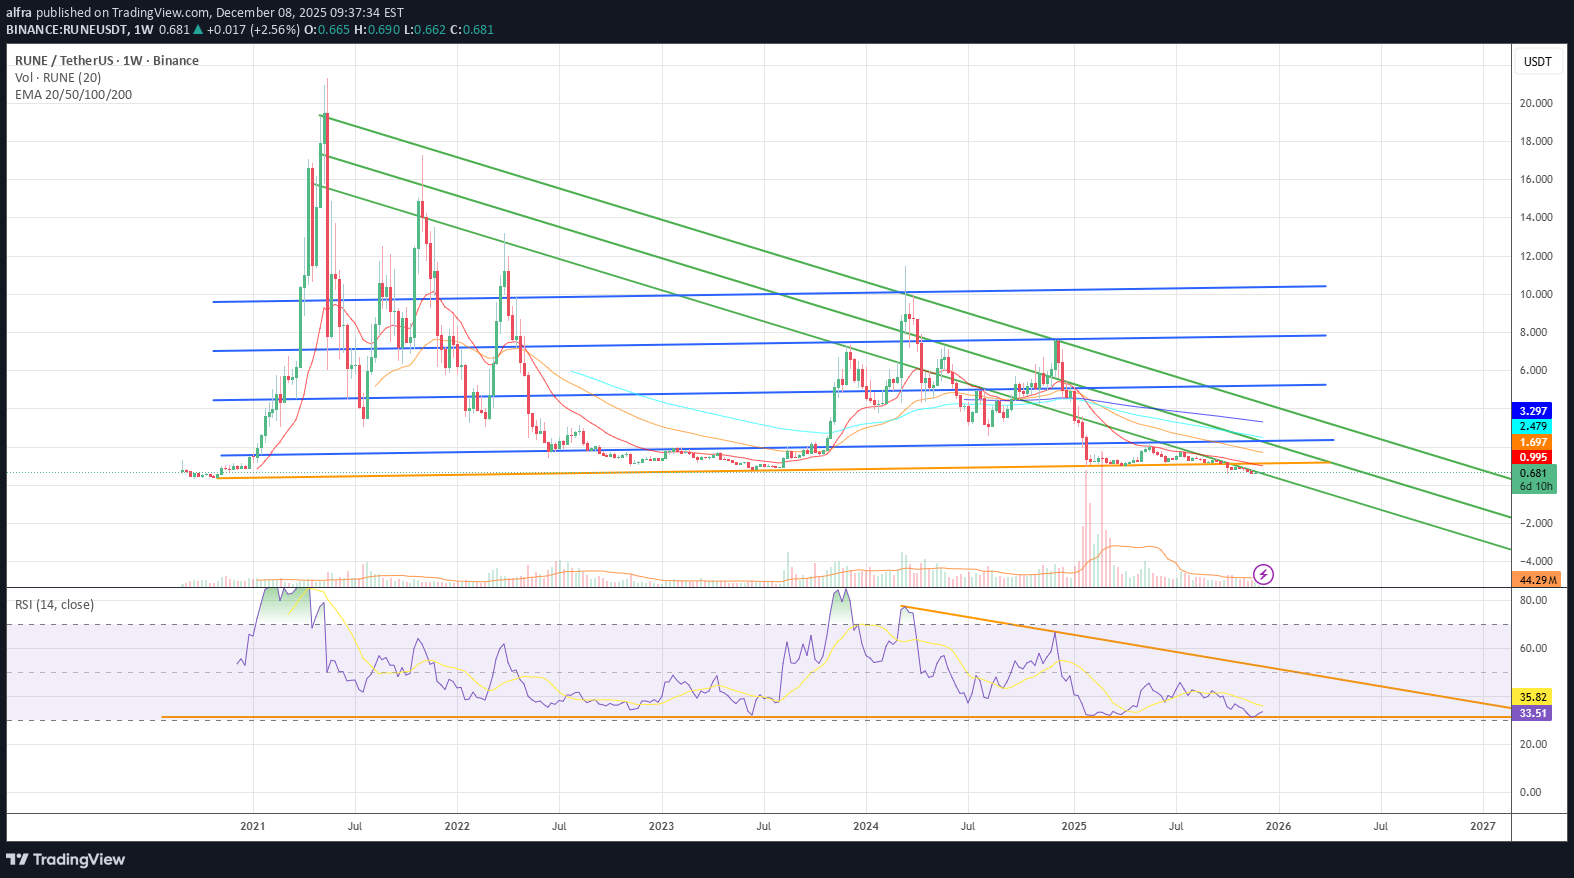
I don’t see any significant negative shift in fundamentals — if anything, I sense a possible fundamental strengthening for THORChain. The first blue line (price above roughly $2) remains my minimum target. Given the weekly RSI levels are historically this oversold (on Binance), a bounce to the first target looks plausible. If momentum returns, a second target around $4 also seems within reach. Fundamental Strength — Why RUNE / THORChain could support higher targets Here are the main reasons why fundamentals might back a bullish move: Key utility token for a fully decentralized cross-chain swap network. RUNE is not just another “token,” but the settlement asset for all liquidity pools on THORChain — every asset that sits in THORChain’s pools is paired 1:1 with RUNE. That means every swap fundamentally requires RUNE, creating structural demand as long as usage grows. Security and network bonding increase demand — not just trading demand. Validators (node operators) must bond RUNE (often 2× the amount pooled) to secure the network. As activity, liquidity or total value locked on THORChain increases, the amount of RUNE needed for bonding rises — which can lead to upward pressure on RUNE’s price. Multi-chain, permissionless cross-chain liquidity — well positioned in DeFi infrastructure. THORChain enables native asset swaps across different blockchains without wrapped tokens or centralized intermediaries, which is a unique and attractive value proposition in DeFi. As cross-chain demand and adoption grows, RUNE’s role becomes more central. Tokenomics offer a clean setup. Circulating supply of RUNE is ~ 350 M (with total supply on protocol docs roughly ~425 M — though supply mechanisms may evolve). Because RUNE is required for all swaps / liquidity / staking / governance / security, its demand isn’t merely speculative — it’s functional. Given that structure, a rally — especially after deep oversold pressure — could very well be underpinned by real utility demand, not just speculative interest. That aligns with your bullish target zones.
alfra
اهداف کوتاهمدت SYS: آیا زمان شروع چرخه جدید فرا رسیده است؟
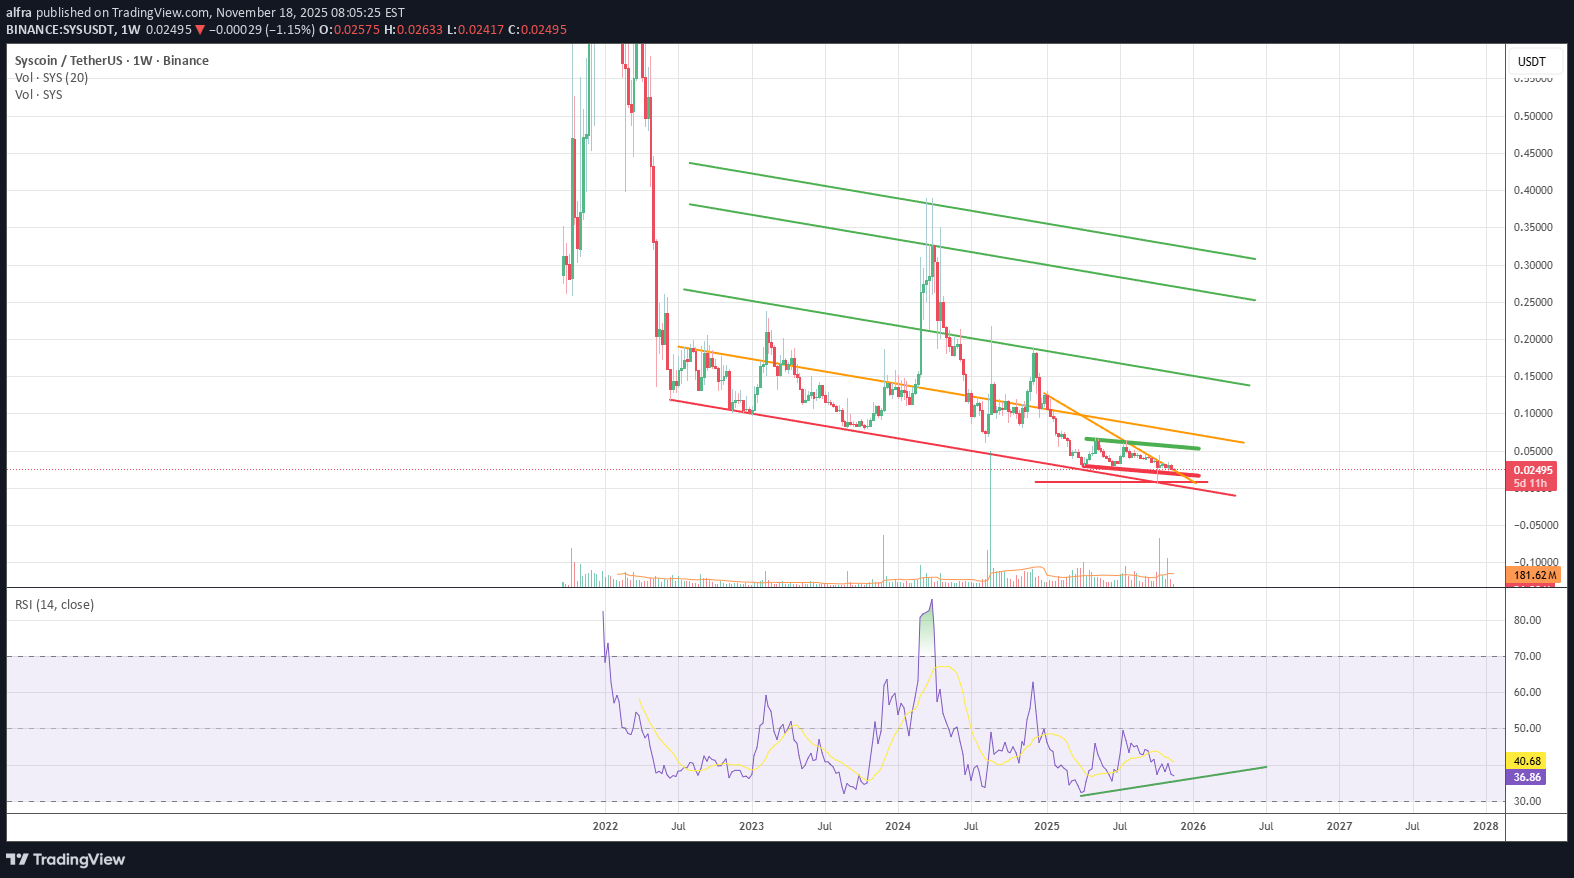
🔵 SYSUSDT Long-Term Cycle Projection (Macro View) 1) Current Structure SYS is sitting at the bottom of a multi-year descending channel. Price is tapping long-term support while the RSI forms a clear bullish divergence on the higher timeframes. This is typically a bottoming pattern seen before new cycles begin. 2) Short term goals Price range: 0.024–0.059 Market builds strength, volatility low, compression continues. Reclaiming 0.059 = first bullish trigger. Reclaiming 0.10 = confirmation of trend shift. - Bullish divergence confirmed. - Price at macro support. - Accumulation phase likely ongoing. - Break 0.10 to start the new cycle. - Long-term structure supports strong upside potential across 2025–2027.
alfra
سیستم کوین (SYS): پتانسیل انفجاری 5 برابری تا پایان سال؛ تحلیل تکنیکال صعودی!

There’s quite a lot happening around Syscoin (SYS) lately, but from a trading perspective, I see strong potential for a 5x move by year-end, considering its relatively small market cap. SYS aligns with several current market narratives — masternodes, zk-proofs, privacy, and “dino coin” appeal — which could attract renewed attention. Technically, there’s a bullish divergence on the weekly chart, supporting a potential reversal. In my view, a 3x–5x short to mid-term move is realistic, with 10x long-term still on the table (that upper green line). The only real issue right now seems to be low interest and awareness, but that can shift quickly once momentum picks up. It’s also worth noting that Syscoin is one of the oldest listed coins on Binance, launched back in 2014 — it has survived multiple cycles, which is impressive in itself.
alfra
فرصت خرید طلایی تراوالا (AVA): آیا این کف قیمتی برای سود دو برابری کافی است؟

AVA is trading near a long-term support zone around $0.37, a level that has repeatedly acted as a historical floor. The token has been consolidating for months within a descending channel, and current price action suggests potential accumulation. The broader trend remains neutral-to-bearish, but momentum indicators such as RSI are nearing oversold territory, hinting at possible reversal conditions. A breakout above the descending trendline and the 50-EMA could open the door to a short-term rally toward $0.47–$0.50. The key medium-term resistance is at $0.78 — roughly a 2× move from current levels. If price manages to close above that mark on strong volume, it would confirm a structural breakout and could trigger a broader bullish shift across the chart, with potential to revisit the $1+ region over time. Fundamentally, Travala has maintained a notable relationship with Binance and CZ (Changpeng Zhao). Binance previously backed TravelbyBit, which later merged with Travala, and the project migrated to Binance Chain early on. CZ has publicly acknowledged Binance’s early investment, and historically his mentions of AVA have driven strong upside volatility — showing that sentiment around Binance can directly influence AVA’s momentum. Trade idea: Entry zone: $0.37 – $0.42 (support region) Take-profit 1: $0.50 Take-profit 2 / Key resistance: $0.78 Stop-loss: below $0.34 (confirming support breakdown) Overall, AVA offers an asymmetric setup: limited downside near historical lows, with potential for a significant upside if the $0.78 barrier breaks. Watch for volume confirmation and Binance-related sentiment as catalysts.
alfra
RUNE - Make or break ...

RUNE is currently in a prolonged downtrend, respecting the descending resistance lines since its peak. Price is now approaching a critical horizontal support zone: 🔴 Key Support: $0.75 🟠 Minor Support Zone: $1.00 – $1.10 🟢 Major Resistance Levels: $2.50 (First trendline test) $4.00 (Second trendline) $6.00+ The price action is compressing near the lower boundary of the descending channel, while RSI is drifting toward oversold levels (RSI ~37.85). Historically, RUNE has seen relief rallies from this region. ⚠️ Scenarios to Watch: Bullish: Price holds above $0.75 and RSI enters oversold territory. Break and close above $1.10 could trigger a relief rally toward $2.50. Confirmation would come with increasing volume and break of descending trendline. Bearish: Breakdown below $0.75 support could open doors for further downside. Possible targets below $0.75: psychological levels at $0.50 or lower, especially if volume increases on the breakdown. 📈 RSI Indicator: RSI nearing oversold, currently ~37.85. No confirmed bullish divergence yet, but worth watching closely for potential reversal signals. 🧩 Strategy Notes: Conservative traders: Wait for reclaim of trendline and a close above $1.10–1.20 for safer entry. Aggressive traders: Look for bullish RSI divergence or price action confirmation around $0.75 for a potential bounce play. Risk management is crucial — set tight stop losses below critical levels. 🎯 Summary: RUNE is at a make-or-break zone. $0.75 is a crucial historical support. A bounce from here could send the price towards the first resistance at $2.50, while a breakdown may lead to further bearish momentum. Watch RSI and volume for clues!
alfra
PNUT / USDT – Daily Analysis

Bullish divergence spotted! Price is printing lower lows, but RSI is making higher lows — a classic bullish divergence pattern. This signals potential trend exhaustion on the downside. #PNUT is holding above a horizontal support level around 0.12–0.13 USDT, aligning with the divergence signal. Volume is tapering off, indicating decreasing selling pressure. RSI is currently around 37–38 and showing a higher low structure. Key levels to watch: Support: 0.1220–0.1300 USDT (current demand zone). Resistance: 0.1650 USDT (local high), followed by stronger resistance at 0.2000–0.2200 USDT. Scenario ideas: If PNUT can hold above support and RSI continues climbing, we might see a relief rally towards the next resistance zones. A breakdown below 0.1220 would invalidate this bullish setup and could lead to continuation of the downtrend. Still... bullish divergence then will become even more obvious.... Bias: bullish short-term, watching for confirmation. ⚠️ Not financial advice. Always manage your risk! #PNUT #Crypto #Altcoins #BullishDivergence #RSI #TradingView
alfra
LTO - Fly or DIE

Not much to add here. LTO has been included in the monitoring tag on Binance exchange and has taken a heavier hit, even delisted coins don't take such a hit lol. This could present an interesting trading opportunity. There’s still a bit of downside potential, but… Let’s see how this trade plays out. The orange line marks resistance and the first potential sell zone, while the green lines represent our targets—assuming the coin doesn’t get delisted from Binance.
alfra
EOS (rebranding to Vaulta) - Technical & Sentiment Outlook

Keeping it simple: I've outlined a clear trading channel on the chart. Following recent news about the "EOS" rebrand to "Vaulta" Banking in May 2025, it appears we've already formed a local double bottom around the $0.40 level. The next logical short-term target is $1.20, which I expect could be reached by the end of May, provided momentum continues. Beyond that, the long-term potential opens up significantly. I've highlighted my long-term target zone in yellow, while the bold green levels represent more speculative, optimistic scenarios—likely achievable only in the event of a broader altcoin supercycle. My realistic long-term price target stands at $6, which I believe is entirely attainable under favorable conditions. Anything beyond that would be considered a bonus.
alfra
Rune - Thorchain: A Mid-Term Opportunity Too Good to Ignore

Thorchain (RUNE) presents a compelling short-to-midterm opportunity that’s hard to pass up. Despite reports suggesting that North Korean hackers have used it to launder stolen Ethereum, the technical indicators are extremely bullish. Volume: One of the highest levels we've seen in a long time. RSI: Oversold on the weekly chart, signaling a strong potential for a rebound. Midterm Target: A 5x to 6x increase. This looks like the best buying opportunity at the moment—unless I’m overlooking something fundamental. If I am, feel free to share your thoughts in the comments. Thanks!
alfra
Toko trading idea

Toko currently has a market cap of $1M. CoinMarketCap and CoinGecko have now synchronized their data for this coin, but you can verify it directly here: Circulating Supply - api.tokoin.io/api/toko-circulating-supply Total Supply - api.tokoin.io/api/toko-total-supply Price targets: First goal: $0.0009 Second goal: $0.0013 Trade cautiously. The Twitter account is fairly active, they also released an updated whitepaper this month, so make sure to check it out.
Disclaimer
Any content and materials included in Sahmeto's website and official communication channels are a compilation of personal opinions and analyses and are not binding. They do not constitute any recommendation for buying, selling, entering or exiting the stock market and cryptocurrency market. Also, all news and analyses included in the website and channels are merely republished information from official and unofficial domestic and foreign sources, and it is obvious that users of the said content are responsible for following up and ensuring the authenticity and accuracy of the materials. Therefore, while disclaiming responsibility, it is declared that the responsibility for any decision-making, action, and potential profit and loss in the capital market and cryptocurrency market lies with the trader.