
RED
RedStone
| تریدر | نوع سیگنال | حد سود/ضرر | زمان انتشار | مشاهده پیام |
|---|---|---|---|---|
 Alpha-GoldFXRank: 31959 | خرید | حد سود: تعیین نشده حد ضرر: تعیین نشده | 12/5/2025 |
Price Chart of RedStone
سود 3 Months :
سیگنالهای RedStone
Filter
Sort messages by
Trader Type
Time Frame

Bithereum_io
رشد انفجاری RED: اهداف قیمتی هیجانانگیز پس از شکست مقاومت!
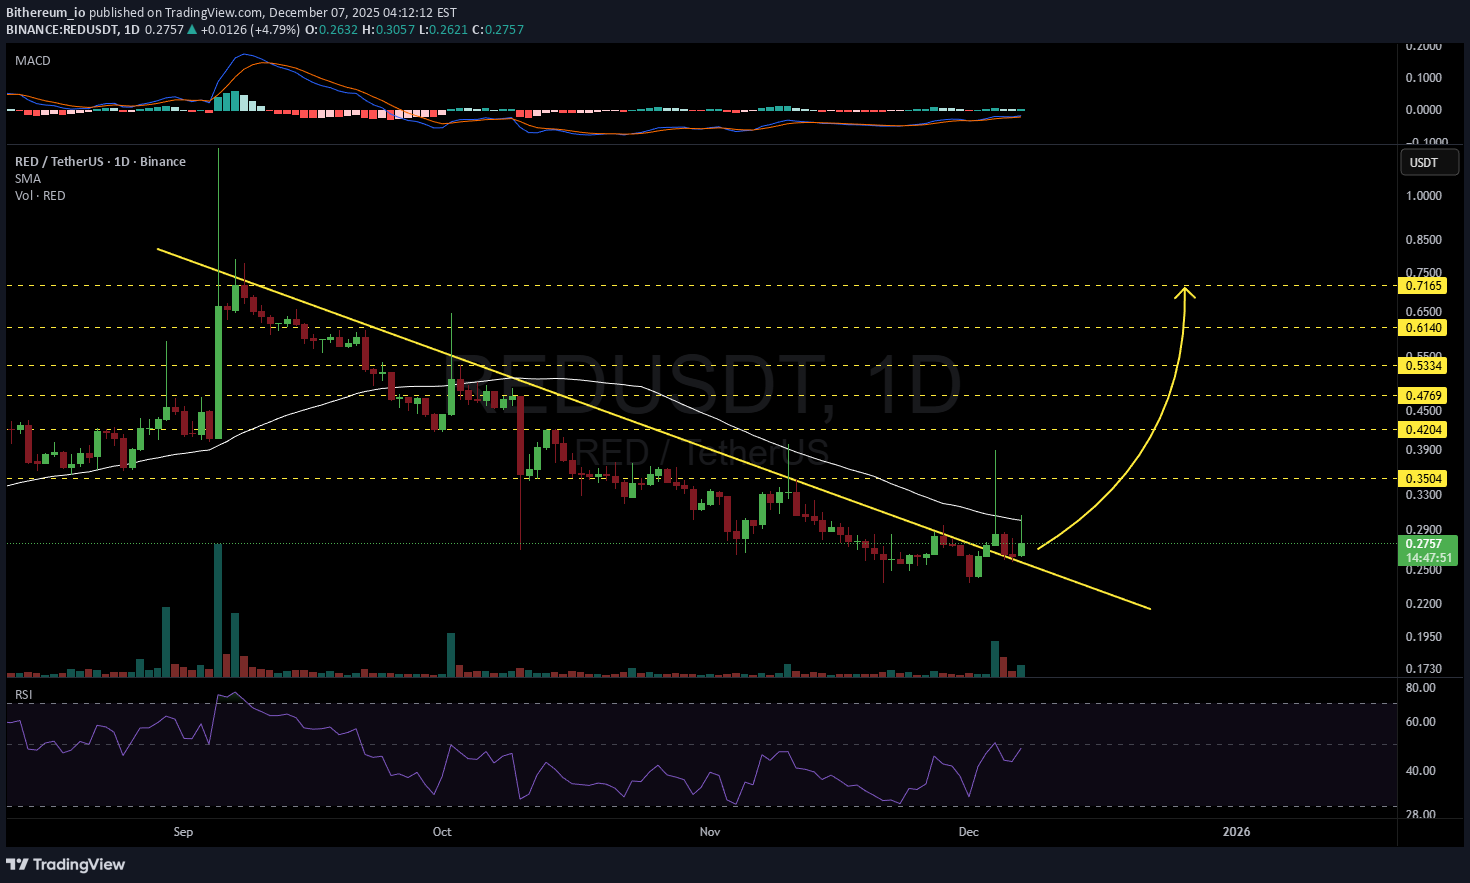
#RED has broken above the descending resistance and has successfully retested it. It is now facing the daily SMA50. In case of a breakout above it, the potential targets are: 🎯 $0.3504 🎯 $0.4204 🎯 $0.4769 🎯 $0.5334 🎯 $0.6140 🎯 $0.7165 ⚠️ Always remember to use a tight stop-loss and maintain proper risk management.
Alpha-GoldFX
سیگنال انفجاری REDUSDT: گوه نزولی نویدبخش صعود 100 درصدی!
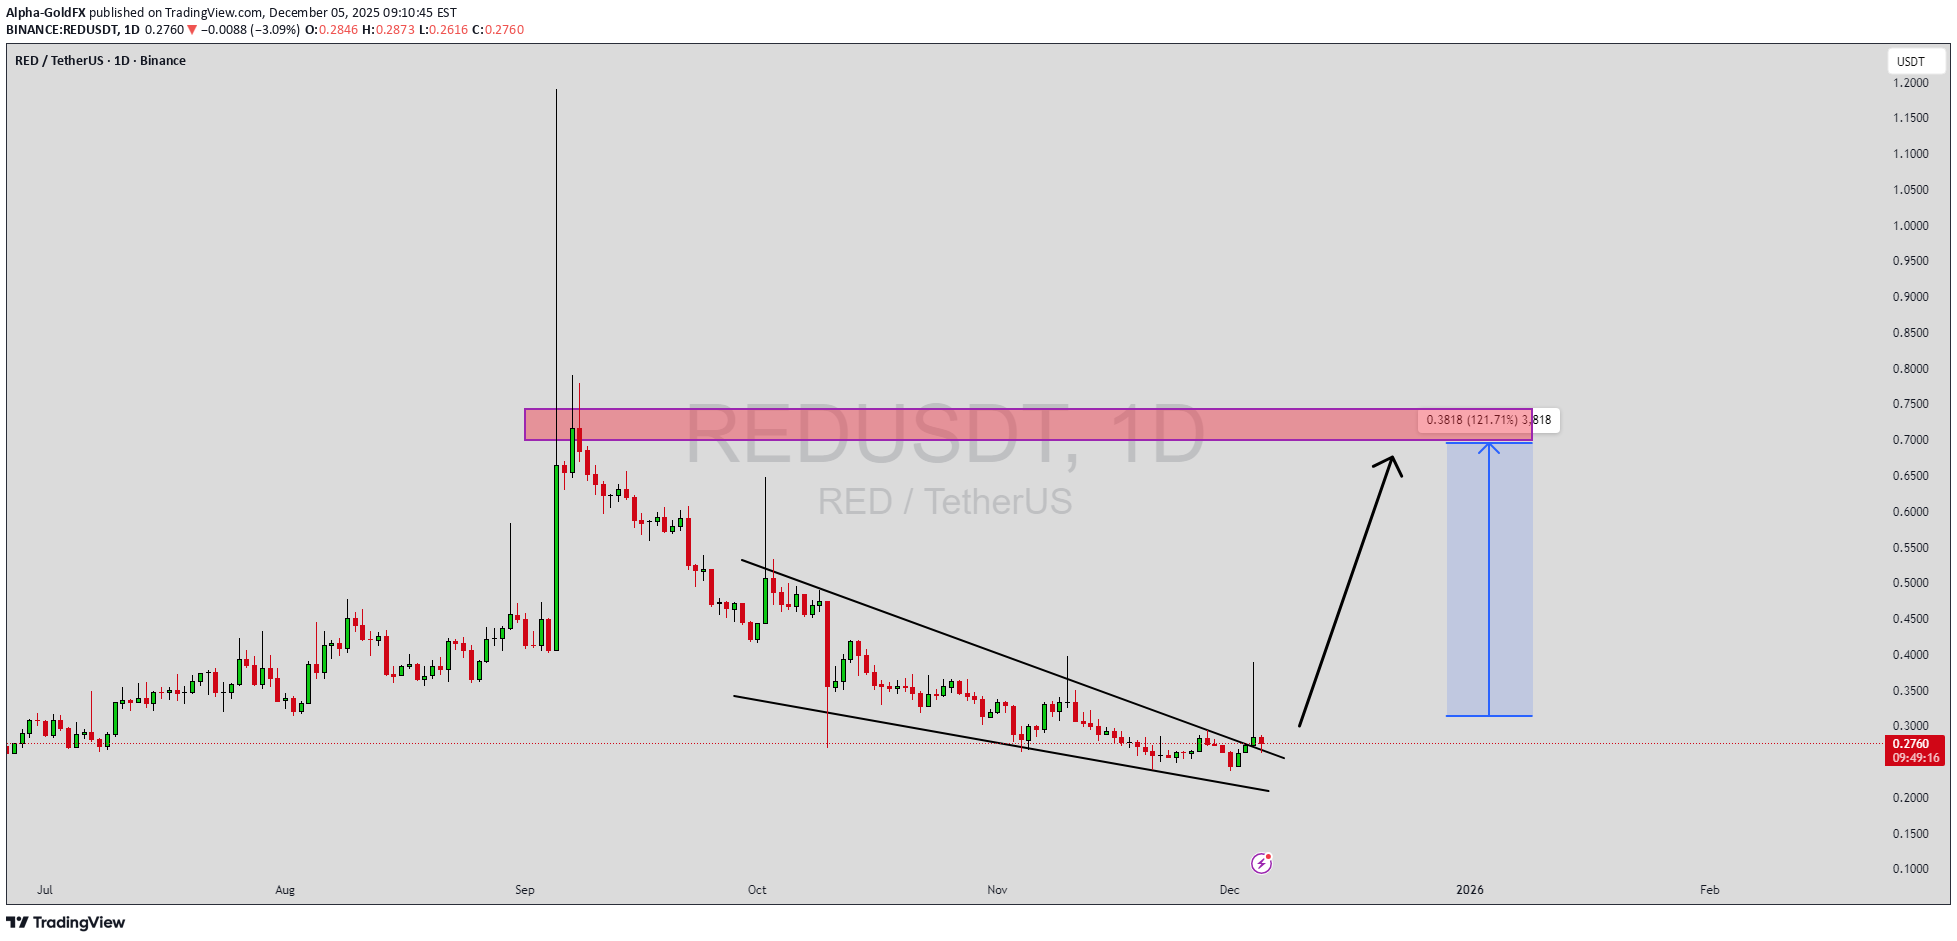
REDUSDT is forming a clear falling wedge pattern, a classic bullish reversal signal that often indicates an upcoming breakout. The price has been consolidating within a narrowing range, suggesting that selling pressure is weakening while buyers are beginning to regain control. With consistent volume confirming accumulation at lower levels, the setup hints at a potential bullish breakout soon. The projected move could lead to an impressive gain of around 90% to 100% once the price breaks above the wedge resistance. This falling wedge pattern is typically seen at the end of downtrends or corrective phases, and it represents a potential shift in market sentiment from bearish to bullish. Traders closely watching REDUSDT are noting the strengthening momentum as it nears a breakout zone. The good trading volume adds confidence to this pattern, showing that market participants are positioning early in anticipation of a reversal. Investors’ growing interest in REDUSDT reflects rising confidence in the project’s long-term fundamentals and current technical strength. If the breakout confirms with sustained volume, this could mark the start of a fresh bullish leg. Traders might find this a valuable setup for medium-term gains, especially as the wedge pattern completes and buying momentum accelerates. ✅ Show your support by hitting the like button and ✅ Leaving a comment below! (What is your opinion about this Coin?) Your feedback and engagement keep me inspired to share more insightful market analysis with you!

Mike-BTD
کف قیمت ردستون دیگر تکرار نمیشود؟ استراتژی جدید نهنگها برای انباشت!

RED price action is clearly being manipulated for whale accumulation. Bottom prices may never come again; taking advantage of 2nd opportunities is key. The current market structure is not providing an edge. Spot accumulation is ideal.

bakbak88
redusdt done a bullish reversal triangle pattern
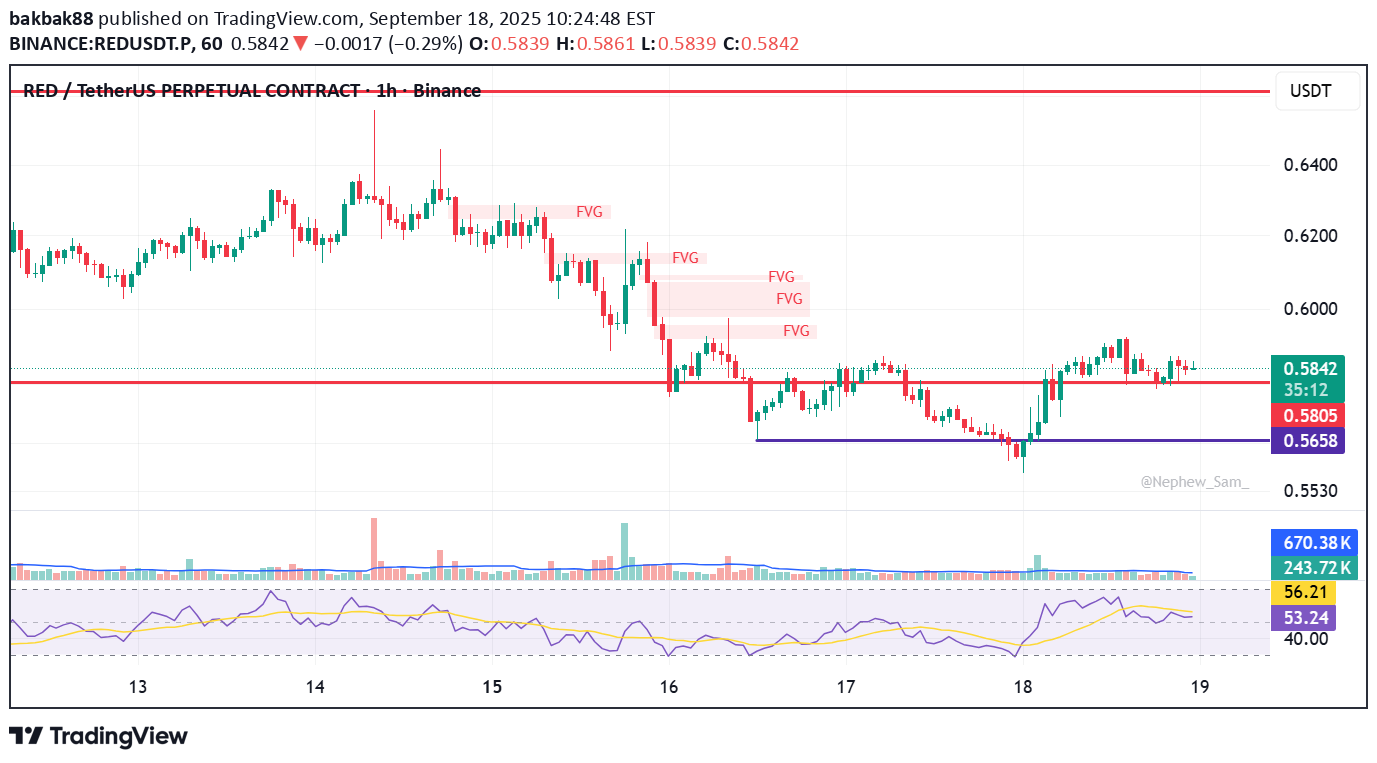
redusdt just done a bullish reversal triangle pattern in 1hr tf. it looks like is a successful reversal play to continuation pump above the moon. confluence with other factor: daily rsi momentum is 59. still remain in bullish momentum in higher time frame.

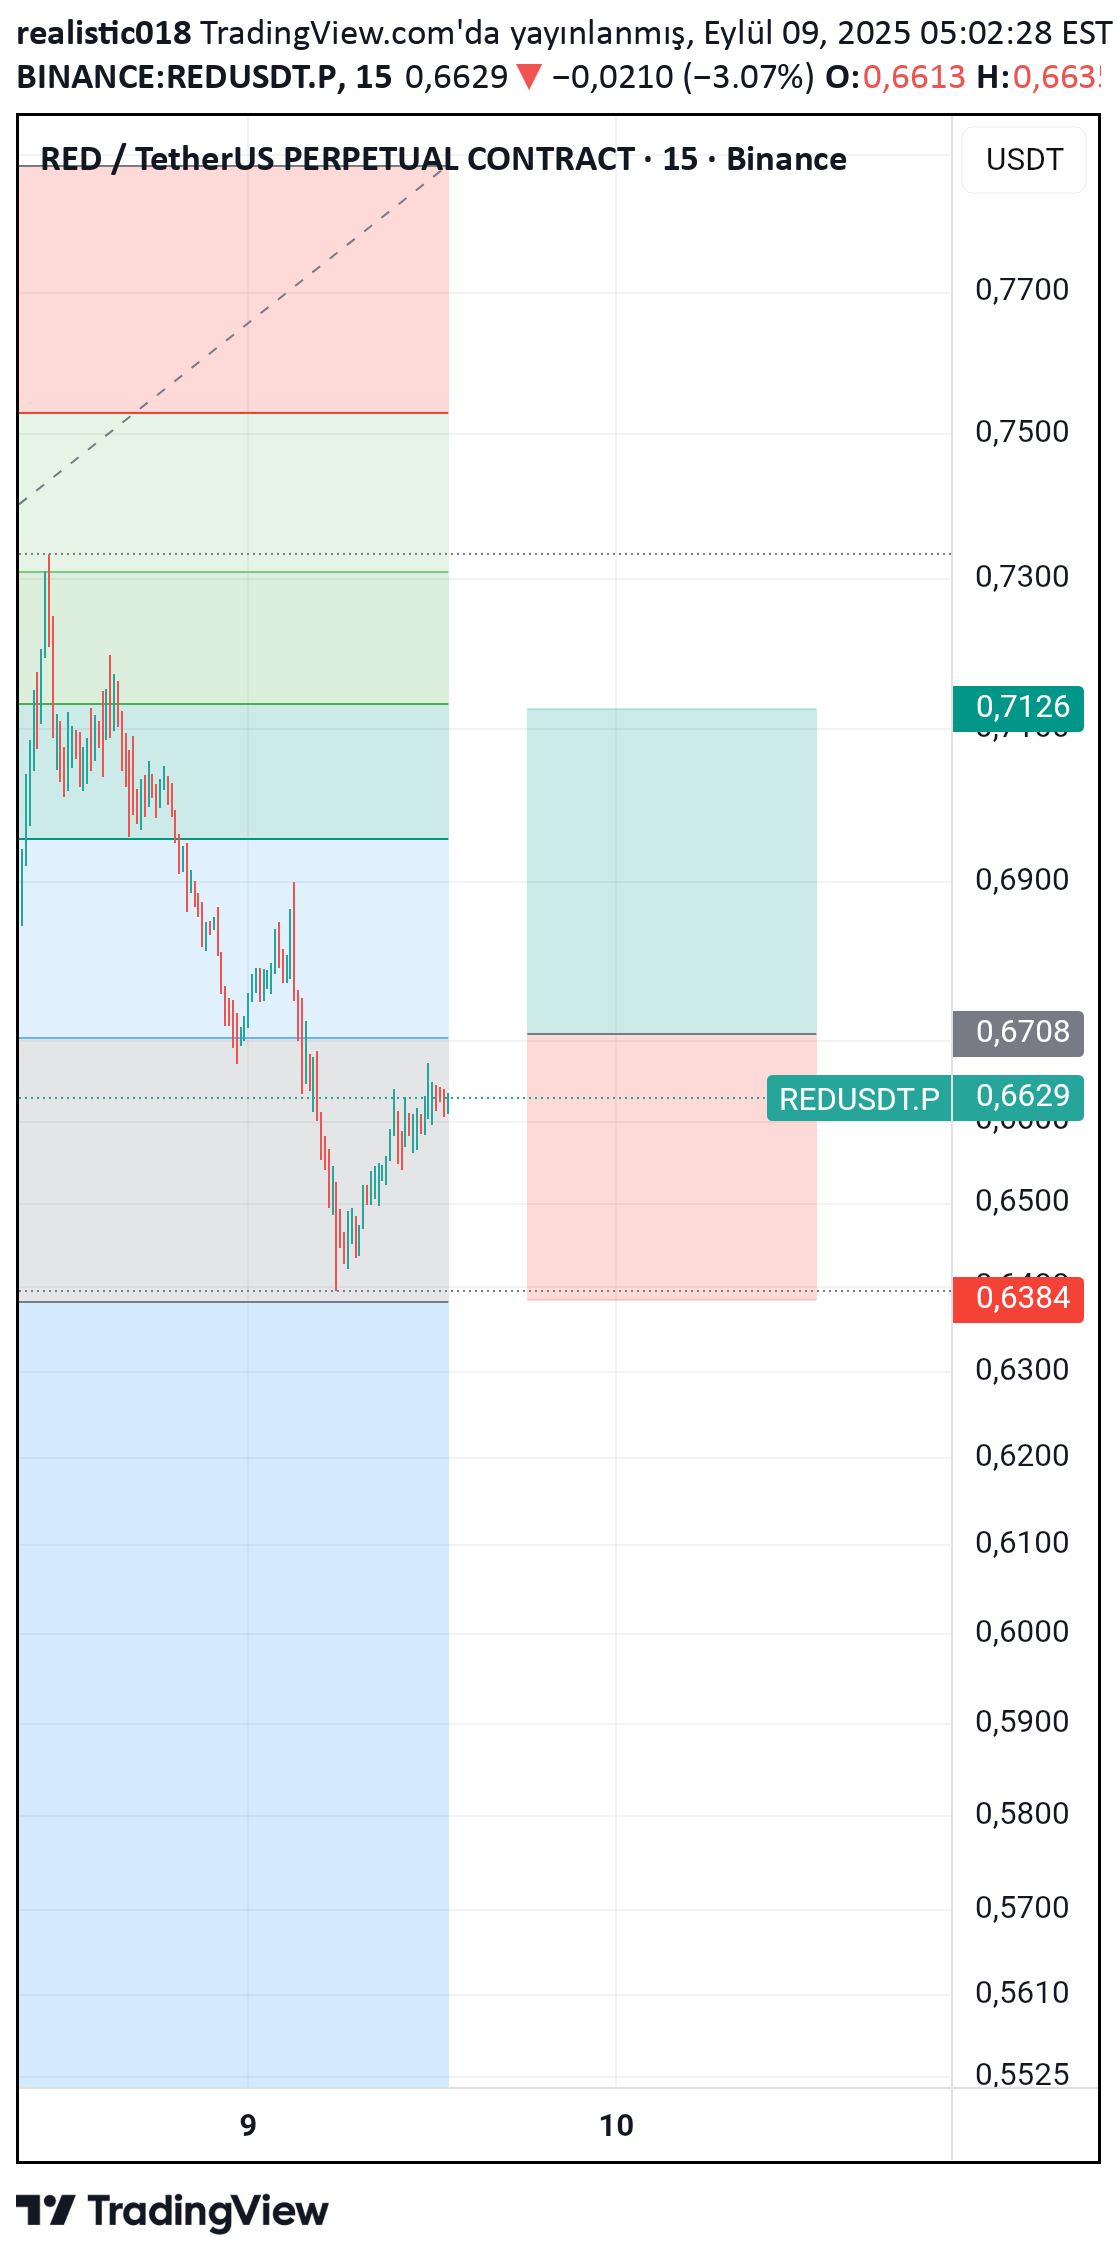
realistic018
RED LONG

4 hours of falling trend frustration came. It can be sure that it has been followed and enters the rising trend for a while and the process can be opened. It is my note to myself and is not an investment advice.
realistic018
RED LONG
For Red 0.67 price breaks, you are thinking of opening Long transactions TP and SL levels are clear. I keep notes for myself, not investment advice.
Alpha-GoldFX
REDUSDT Forming Falling Wedge
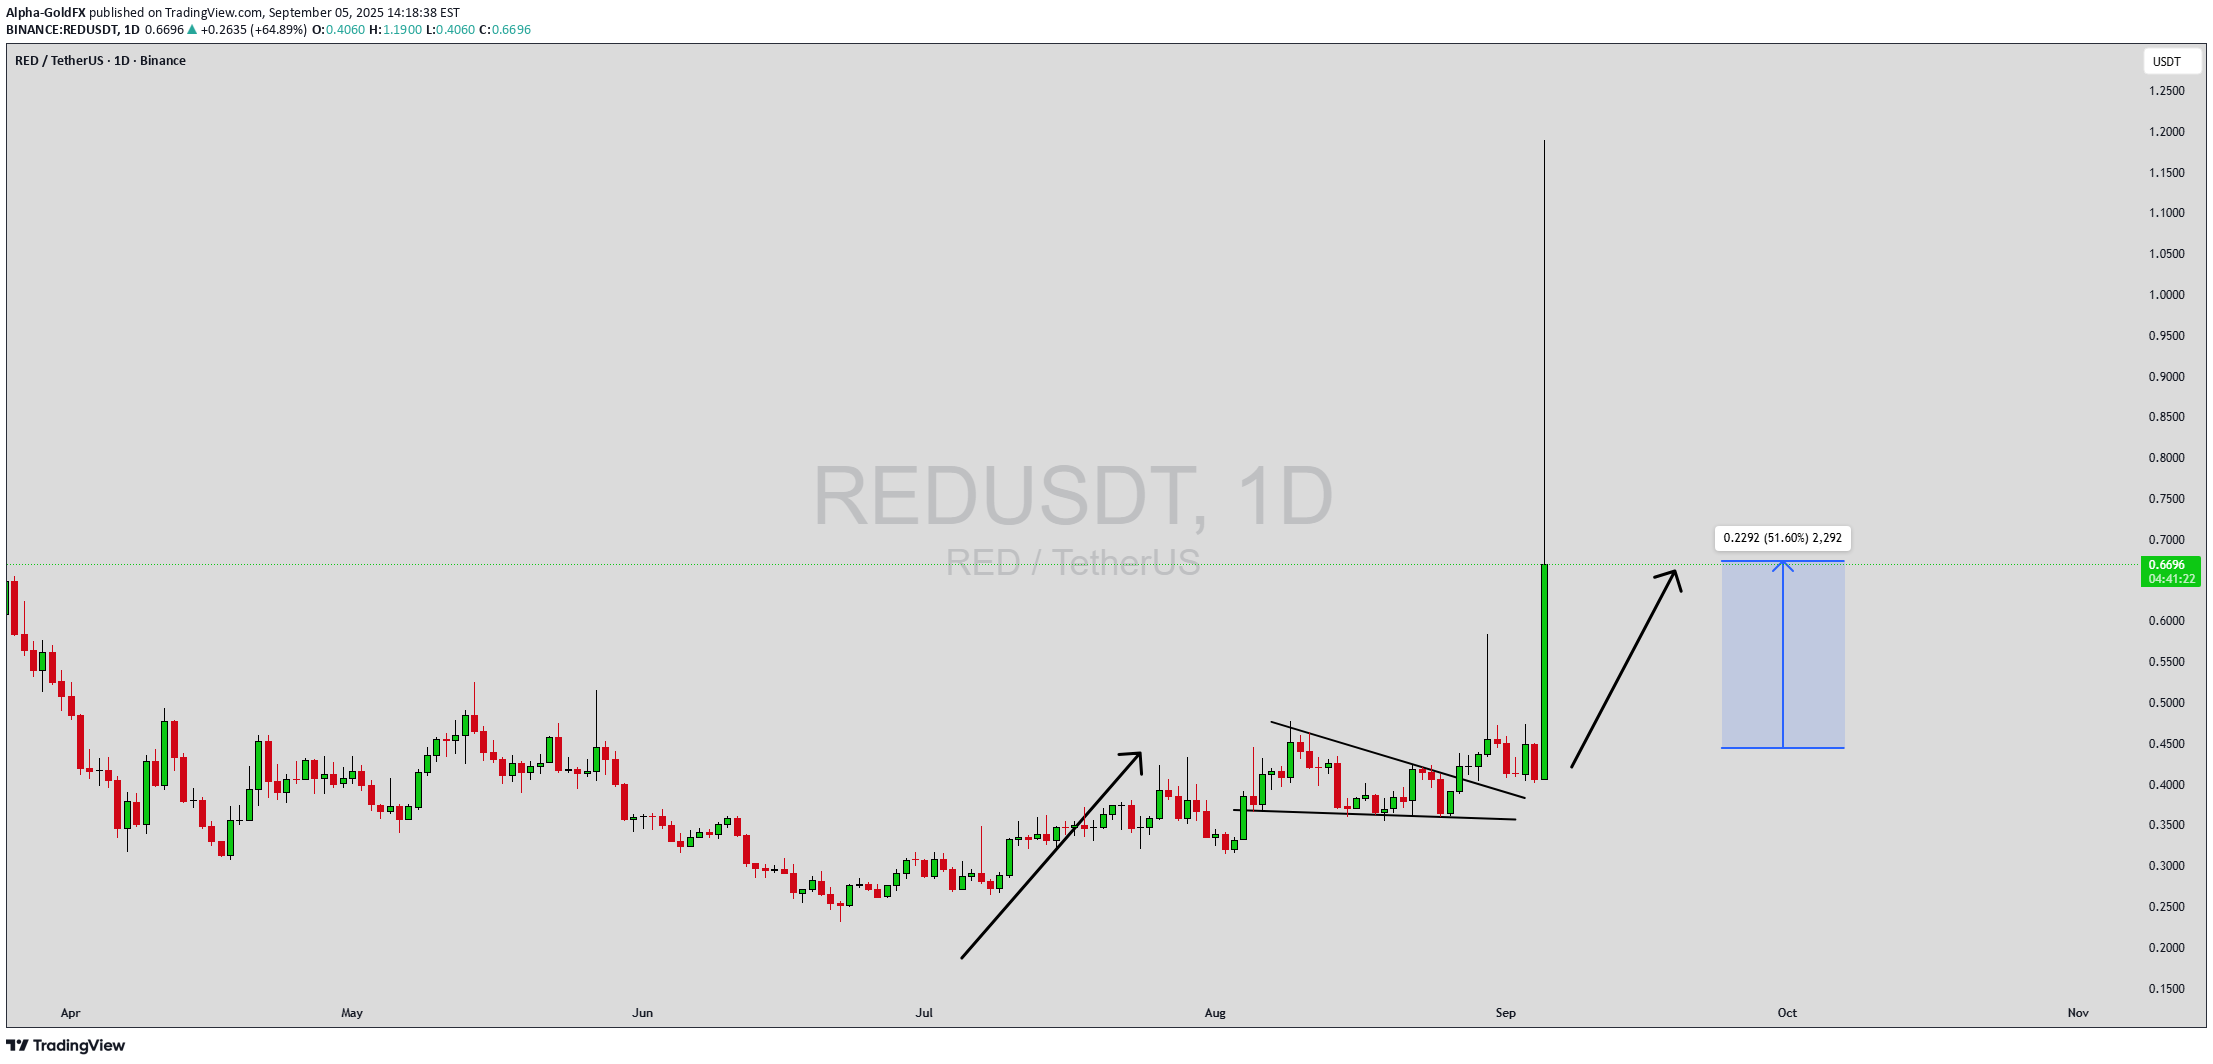
REDUSDT is currently forming a falling wedge pattern, a bullish reversal setup that often indicates the end of a downtrend and the beginning of a strong upward move. This structure reflects tightening price action, with lower highs and lower lows converging, typically followed by a breakout to the upside. Based on this setup, REDUSDT is positioned for a potential rally, targeting gains of around 90% to 100%+. The trading volume is showing stability, which adds confidence to the wedge formation. A steady flow of volume suggests that accumulation is taking place, as investors quietly position themselves ahead of a possible breakout. If momentum builds and breaks past resistance, the move could accelerate quickly, validating the bullish outlook. Market sentiment around REDUSDT is improving as more investors begin to recognize the strength of this technical setup. The project has been gaining traction, and investor interest is helping fuel speculation about its potential growth. With traders watching closely, a successful breakout could draw even more attention, increasing liquidity and supporting sustained price action. In summary, REDUSDT is preparing for a significant opportunity, with the falling wedge pattern signaling the likelihood of a bullish move. Combined with solid volume and growing investor interest, the coin looks ready to deliver notable returns in the near future. ✅ Show your support by hitting the like button and ✅ Leaving a comment below! (What is You opinion about this Coin) Your feedback and engagement keep me inspired to share more insightful market analysis with you!
Alpha-GoldFX
REDUSDT Forming Falling Wedge
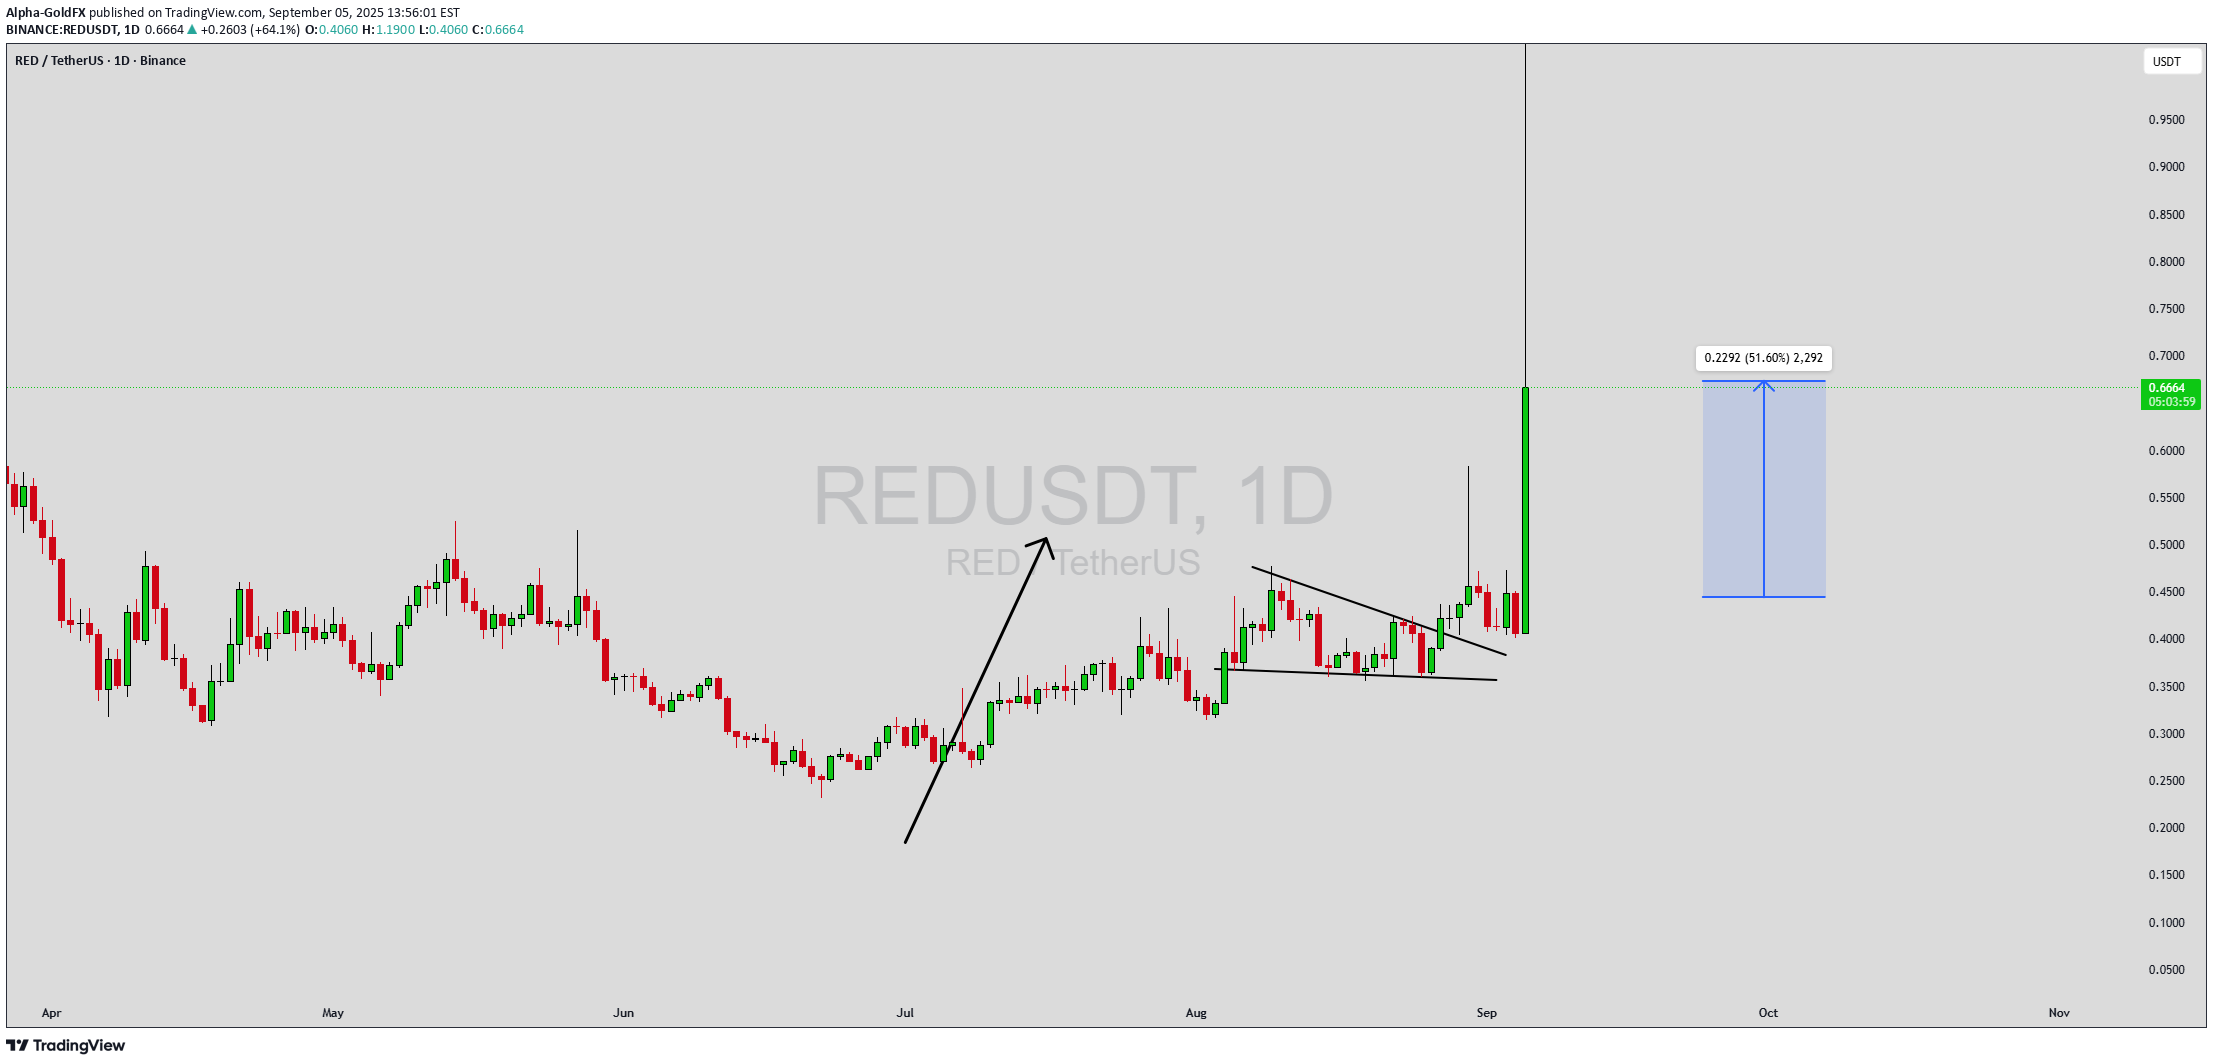
REDUSDT is currently forming a falling wedge pattern, a bullish reversal setup that often indicates the end of a downtrend and the beginning of a strong upward move. This structure reflects tightening price action, with lower highs and lower lows converging, typically followed by a breakout to the upside. Based on this setup, REDUSDT is positioned for a potential rally, targeting gains of around 40% to 50%+. The trading volume is showing stability, which adds confidence to the wedge formation. A steady flow of volume suggests that accumulation is taking place, as investors quietly position themselves ahead of a possible breakout. If momentum builds and breaks past resistance, the move could accelerate quickly, validating the bullish outlook. Market sentiment around REDUSDT is improving as more investors begin to recognize the strength of this technical setup. The project has been gaining traction, and investor interest is helping fuel speculation about its potential growth. With traders watching closely, a successful breakout could draw even more attention, increasing liquidity and supporting sustained price action. In summary, REDUSDT is preparing for a significant opportunity, with the falling wedge pattern signaling the likelihood of a bullish move. Combined with solid volume and growing investor interest, the coin looks ready to deliver notable returns in the near future. ✅ Show your support by hitting the like button and ✅ Leaving a comment below! (What is You opinion about this Coin) Your feedback and engagement keep me inspired to share more insightful market analysis with you!

SuperTradeish
RED Coin RedStone Token Price Prediction and Technical Analysis
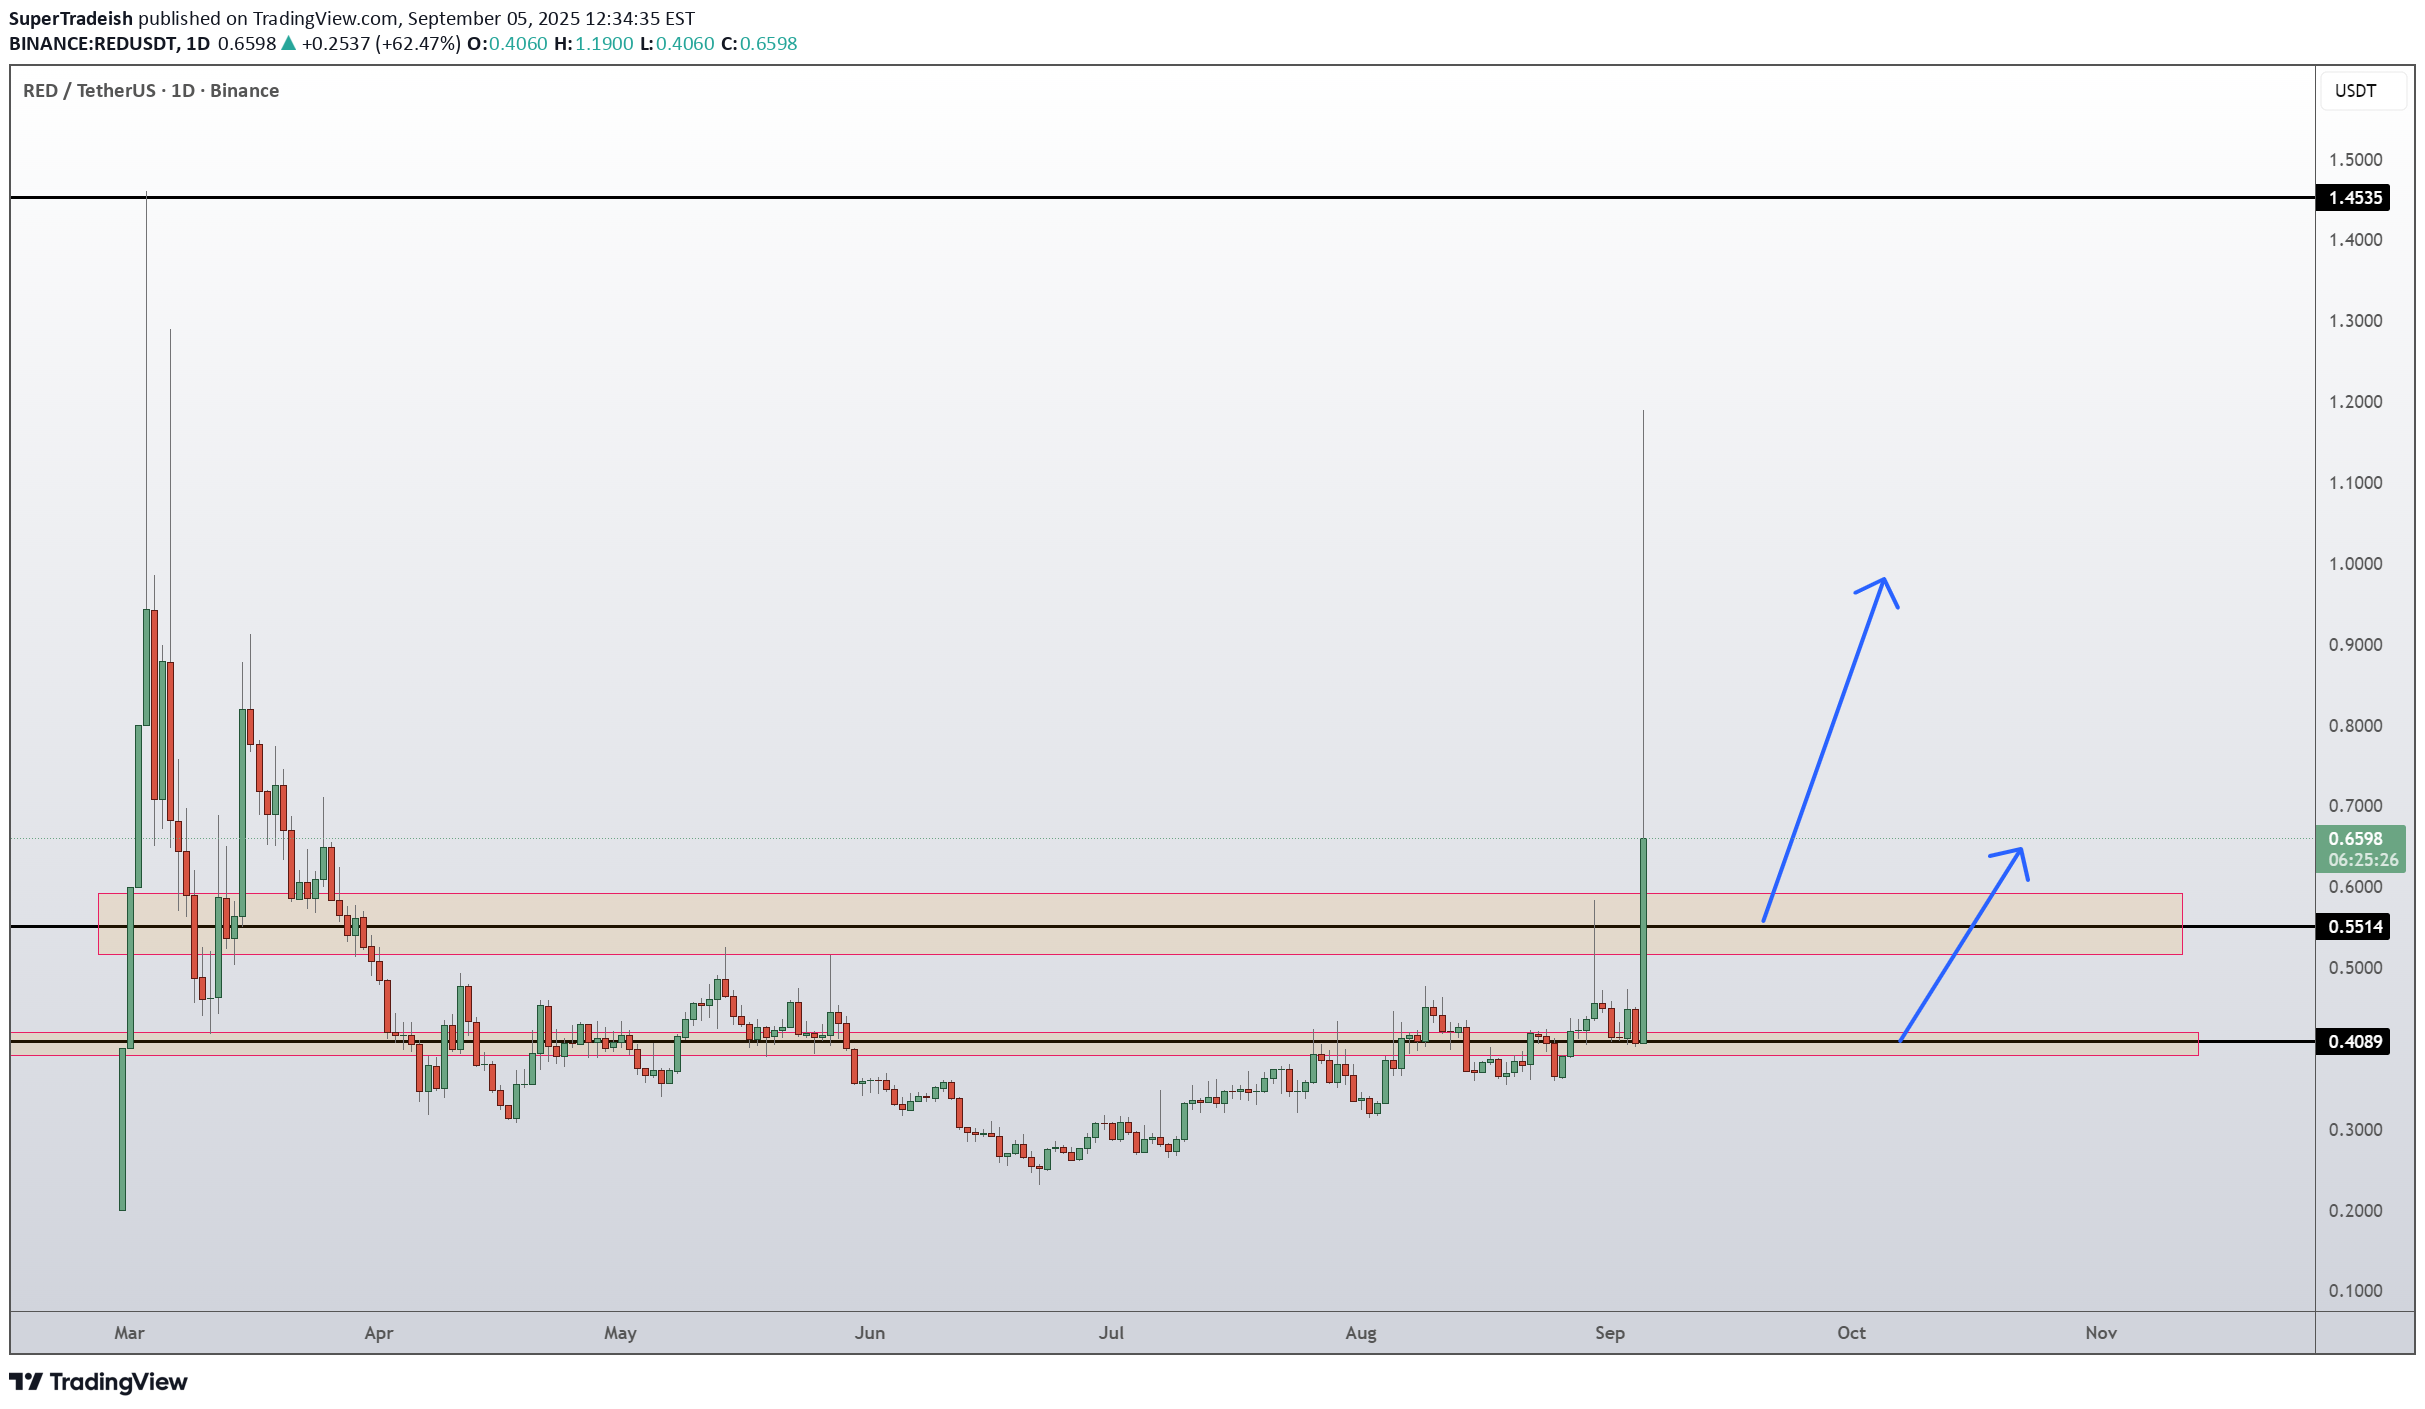
RED/USDT has broken out of its long consolidation phase with a sharp rally, showing strong momentum. Price surged above the 0.5514 resistance and is now trading around 0.6703, attempting to hold above this breakout structure. If buyers maintain control, continuation toward the major resistance at 1.4535 is possible. However, if price fails to sustain above the 0.5514–0.70 supply zone, a pullback to retest 0.4089 support could unfold before another leg higher. 📈 Key Levels: Buy trigger: Successful retest/hold above 0.5514 support-turned-demand Buy zone: 0.55 – 0.70 region Target: 1.4535 major resistance Invalidation: Daily close below 0.4089 (would negate bullish structure) 👉 Follow me for More Real Time Opportunities. Share your Thoughts if you have any?

Cryptojobs
SPOT BREAKOUT ALERT - RED/USDT
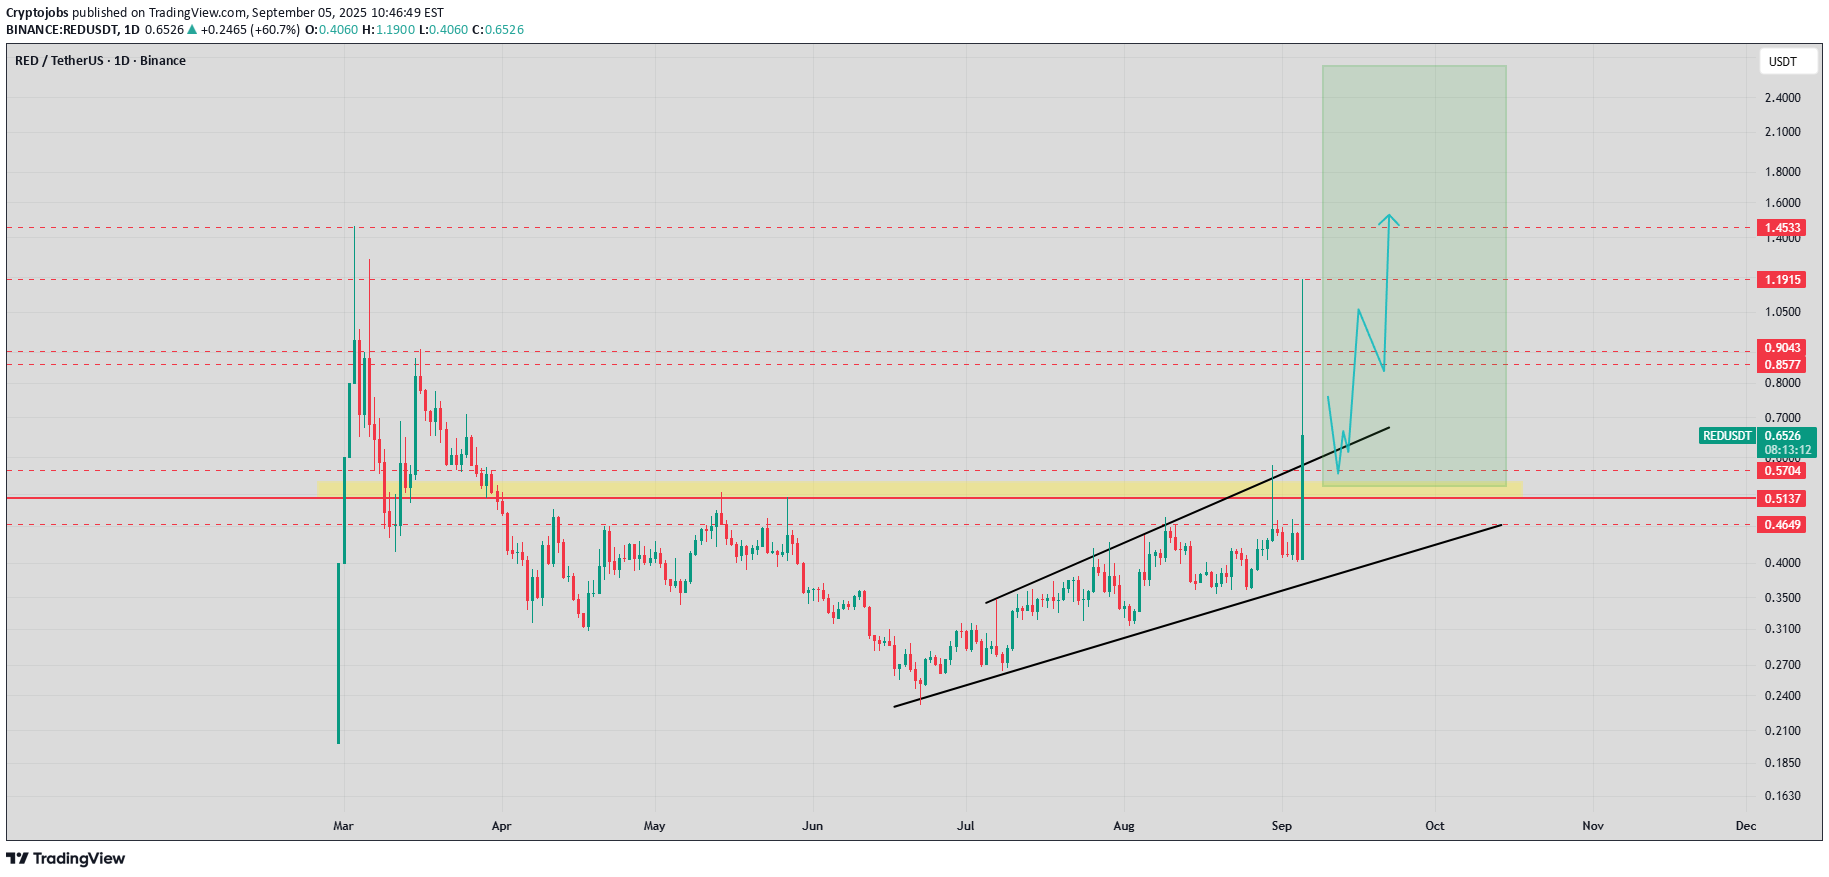
📈SPOT BREAKOUT ALERT 📈 RED is up average +65% today, but I think bulls could push price much higher! Quick stats: ✅ $2.4B+ TVL, 300k+ users ✅ Live on Binance Loans ✅ Integrated with 50+ protocols, securing 25+ DVNs ✅ Kelp: 2nd largest LRT on ETH ✅ Leading staking infrastructure on BNB Chain Currently, I expect to see a short term bearish correction before to see a next big move upward! Key demand zone: 0.570 - 05800 & 0.5300 - 0.500$
Disclaimer
Any content and materials included in Sahmeto's website and official communication channels are a compilation of personal opinions and analyses and are not binding. They do not constitute any recommendation for buying, selling, entering or exiting the stock market and cryptocurrency market. Also, all news and analyses included in the website and channels are merely republished information from official and unofficial domestic and foreign sources, and it is obvious that users of the said content are responsible for following up and ensuring the authenticity and accuracy of the materials. Therefore, while disclaiming responsibility, it is declared that the responsibility for any decision-making, action, and potential profit and loss in the capital market and cryptocurrency market lies with the trader.