
QTUM
Qtum
| تریدر | نوع سیگنال | حد سود/ضرر | زمان انتشار | مشاهده پیام |
|---|---|---|---|---|
 Alpha-GoldFXRank: 32114 | خرید | حد سود: تعیین نشده حد ضرر: تعیین نشده | 12/14/2025 | |
 FalconLineTradingRank: 3098 | خرید | حد سود: تعیین نشده حد ضرر: تعیین نشده | 11/27/2025 | |
 wyckoff70Rank: 32172 | خرید | حد سود: ۲٫۳۸ حد ضرر: ۱٫۲۱ | 10/23/2025 |
Price Chart of Qtum
سود 3 Months :
سیگنالهای Qtum
Filter
Sort messages by
Trader Type
Time Frame
Alpha-GoldFX
QTUMUSDT Forming Falling Wedge
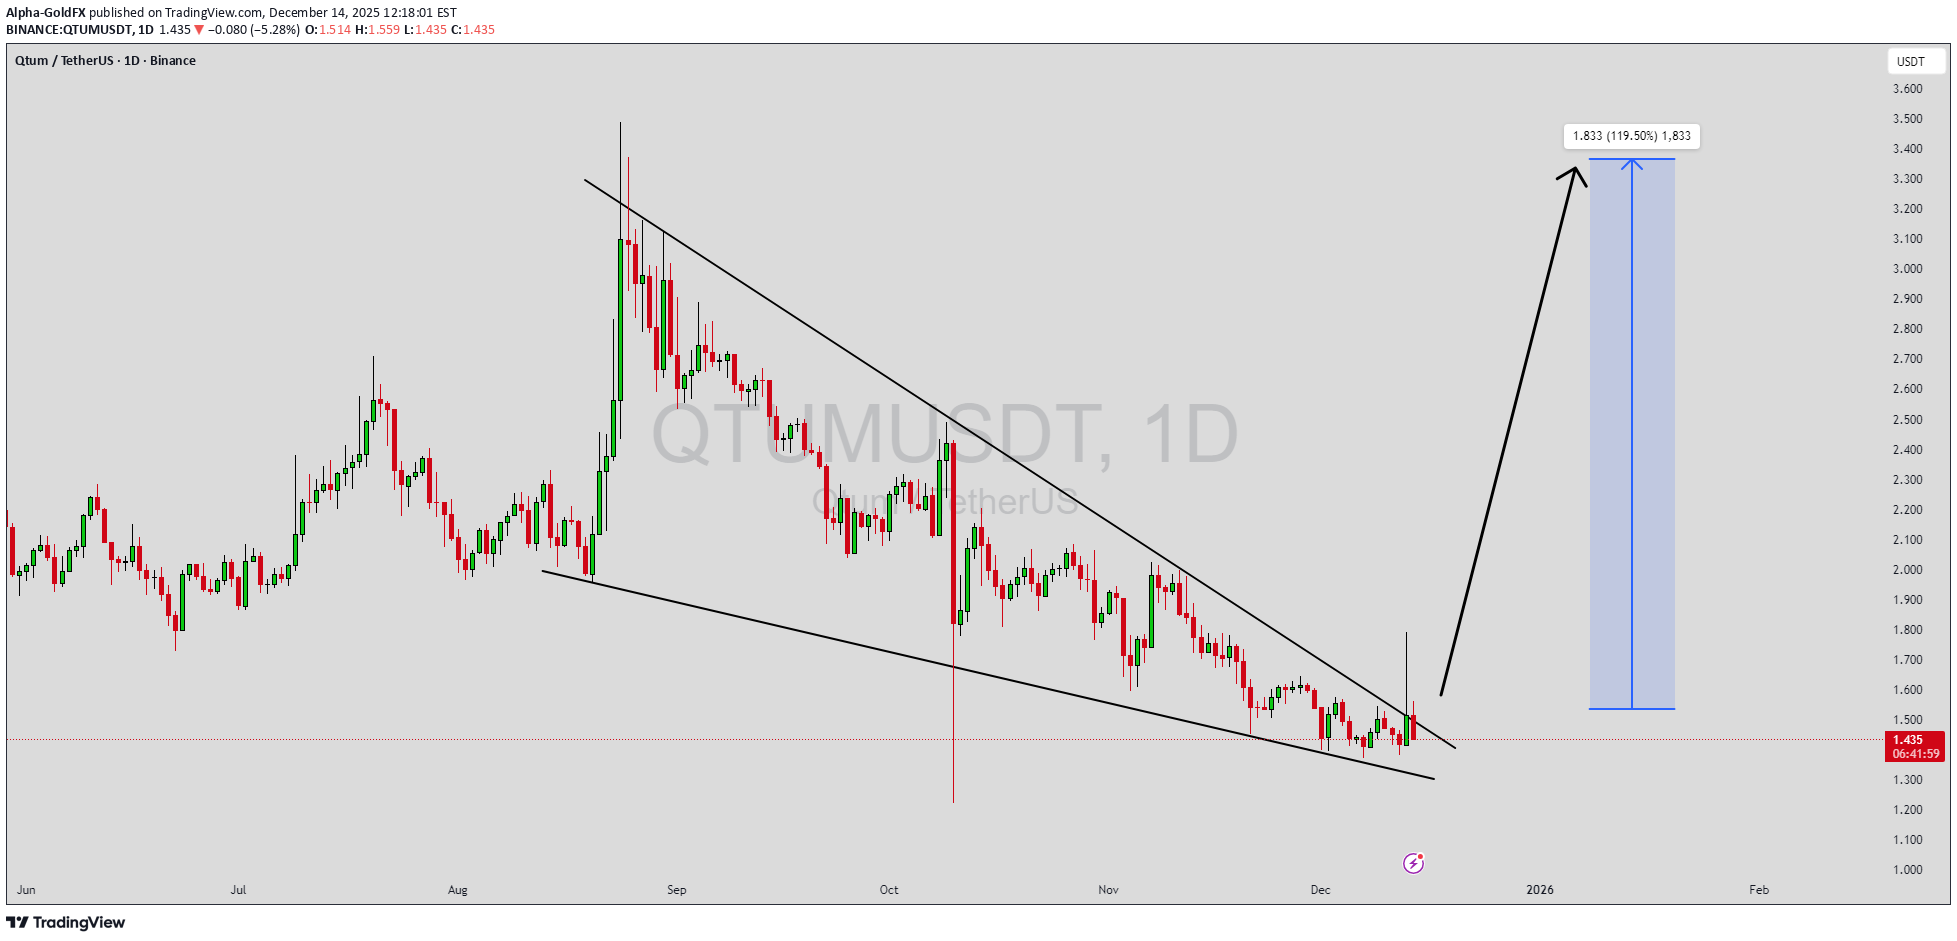
QTUMUSDT is forming a clear falling wedge pattern, a classic bullish reversal signal that often indicates an upcoming breakout. The price has been consolidating within a narrowing range, suggesting that selling pressure is weakening while buyers are beginning to regain control. With consistent volume confirming accumulation at lower levels, the setup hints at a potential bullish breakout soon. The projected move could lead to an impressive gain of around 90% to 100% once the price breaks above the wedge resistance. This falling wedge pattern is typically seen at the end of downtrends or corrective phases, and it represents a potential shift in market sentiment from bearish to bullish. Traders closely watching QTUMUSDT are noting the strengthening momentum as it nears a breakout zone. The good trading volume adds confidence to this pattern, showing that market participants are positioning early in anticipation of a reversal. Investors’ growing interest in QTUMUSDT reflects rising confidence in the project’s long-term fundamentals and current technical strength. If the breakout confirms with sustained volume, this could mark the start of a fresh bullish leg. Traders might find this a valuable setup for medium-term gains, especially as the wedge pattern completes and buying momentum accelerates. ✅ Show your support by hitting the like button and ✅ Leaving a comment below! (What is your opinion about this Coin?) Your feedback and engagement keep me inspired to share more insightful market analysis with you!
FalconLineTrading
QTUM زیر ذرهبین: هالوینگ مهم، تحلیل عمیق تکنیکال و استراتژی خرید 3 مرحلهای تا 5.40 دلار!
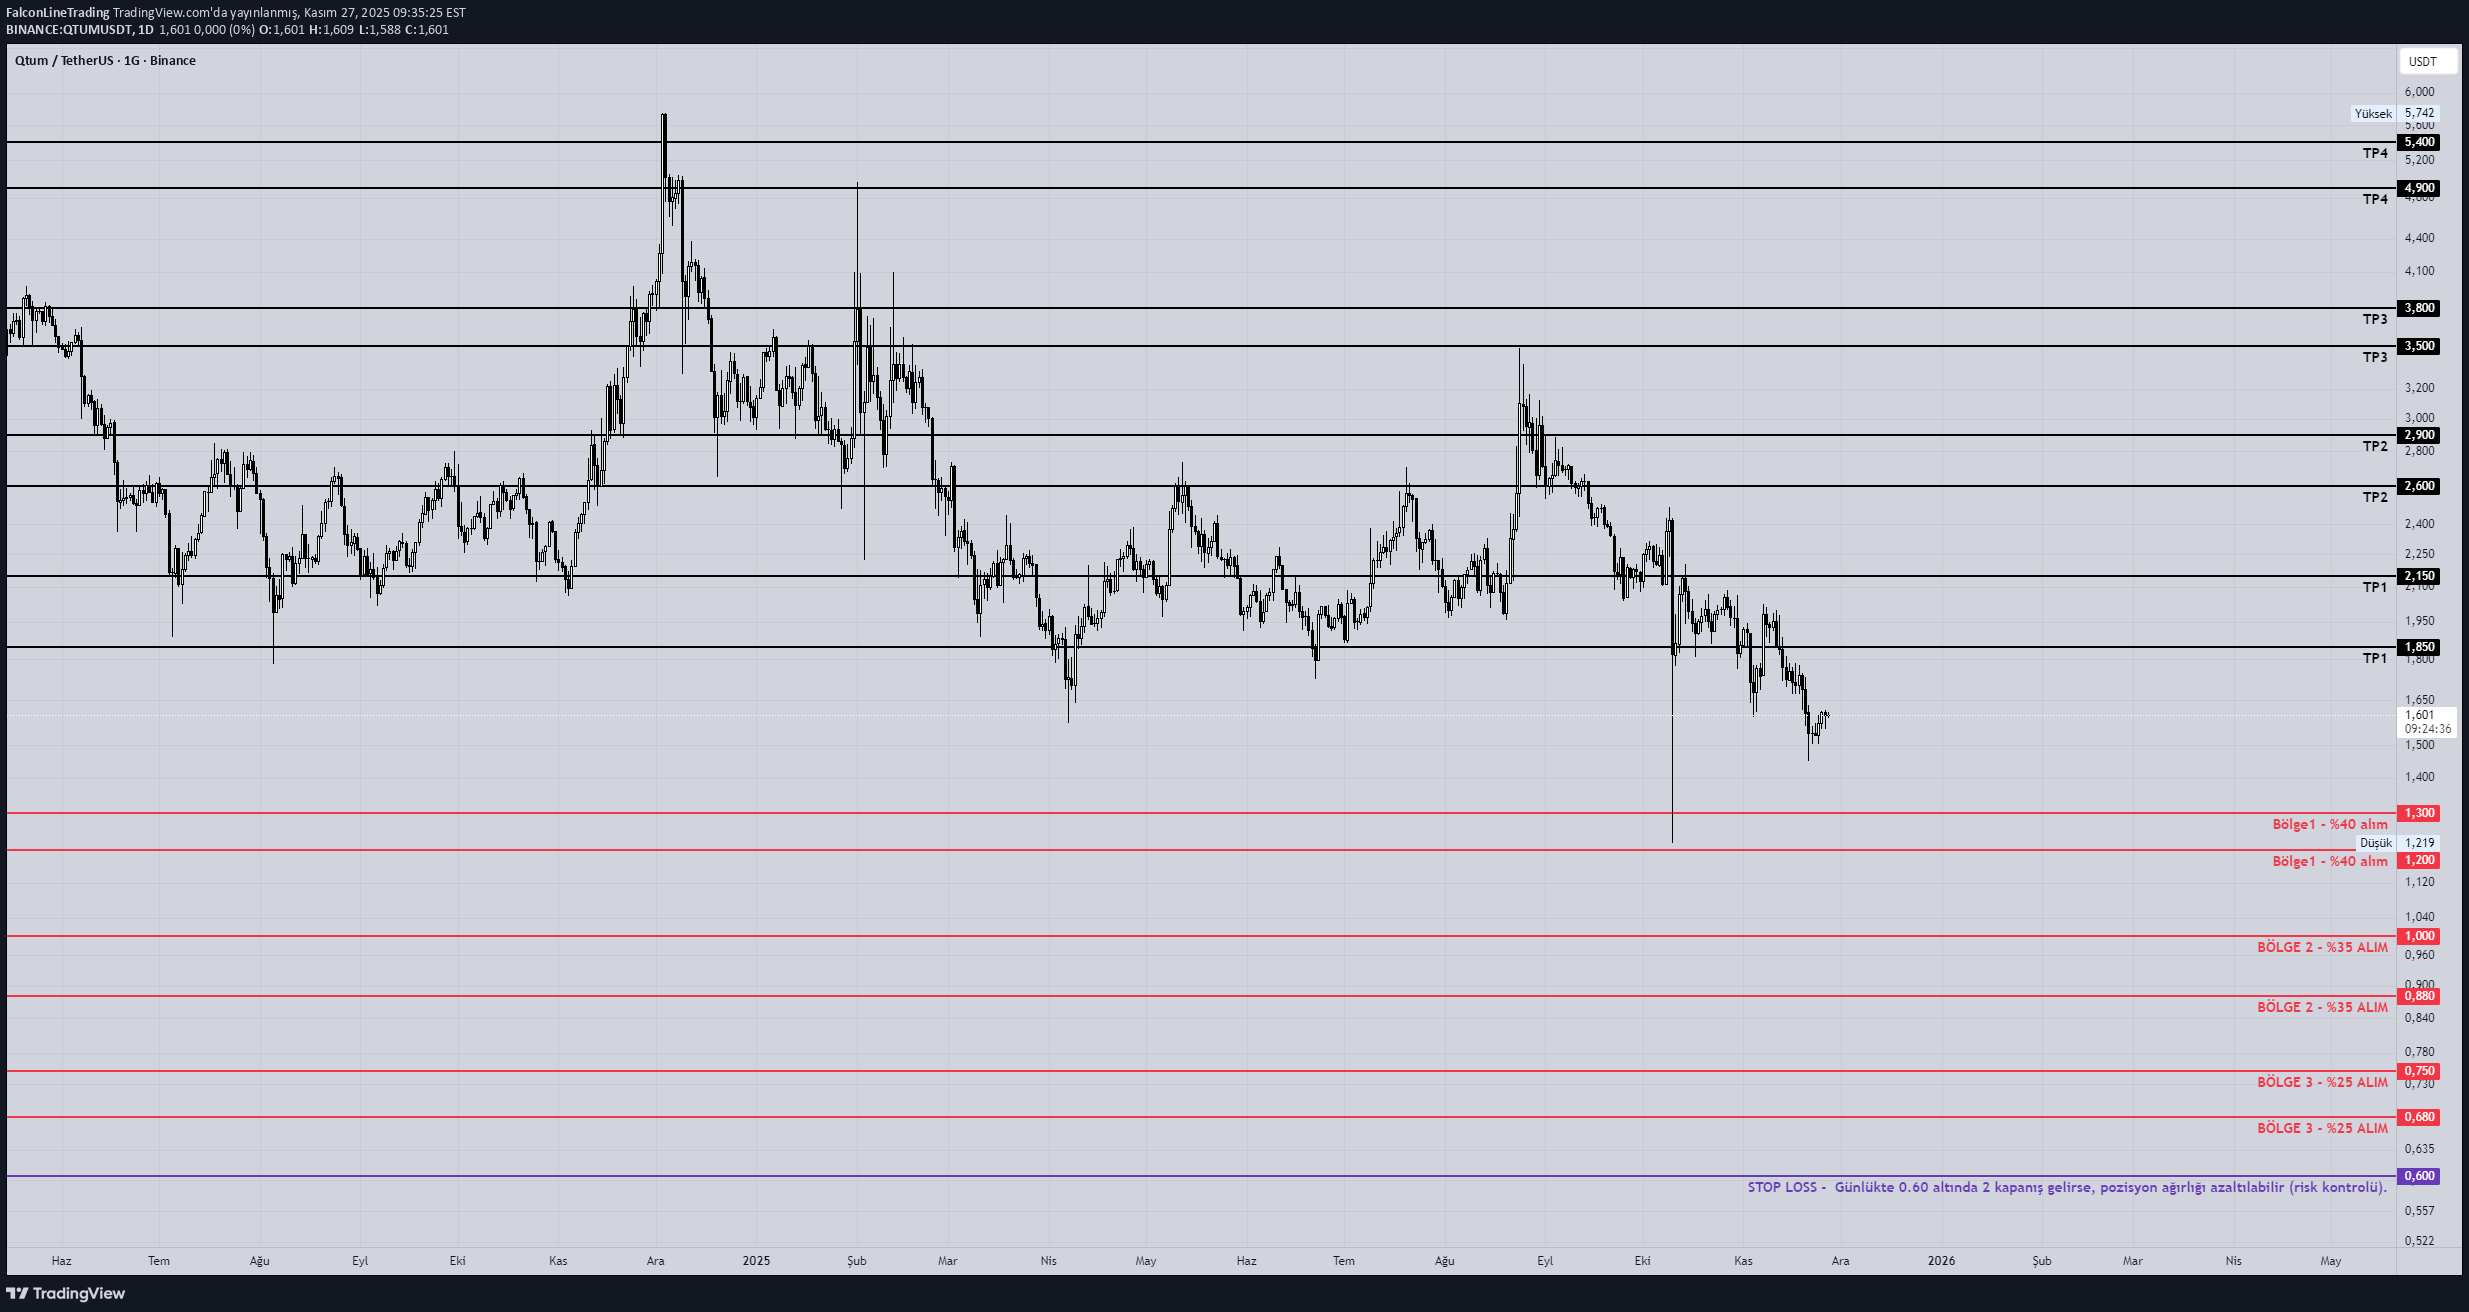
QTUM — November 30, 2025 Halving Confidence: 94% Impact Analysis •Block reward 0.5 → 0.25 •Supply shock is high → In old coins, the halving effect usually comes late but hard. Market Impact •Pre-halving: speculative rise •Post-halving: 7–30 days horizontal → then potential trend. critical Since its long-term volume is low, the rate of manipulative action is high. ________________________________________ 6) QTUM — January 12, 2026 Hard Fork Category: Network update Impact Analysis •Bitcoin + Ethereum upgrade combination → technical update is good. •The price impact is moderate. Market Impact •Fork news supports the price for 1–2 weeks after the halving. ---------------------------------------------- QTUM – Multitimeframe Analysis (1M / 1W / 1D / 4H) 1M (Monthly) – Macro Trend The main trend on the monthly chart since 2018 is down. All increases ended as lower high → macro trend down. Even the last 12 months of movement is like a “mini distribution” → buyers are weak. Macro demand appears to be only in the 0.70 – 1.00 USDT band. The monthly outlook is neutral-negative. 1W (Weekly) – Structural Condition There is a falling channel on the weekly, but there is no breakout yet. HTF does not recover structure, it is just a horizontal-collapse (grind) formation. His latest rise is liquidity cleansing → there is no continuation. The funds are not aggressive in this chart, it is purely a “collect cheap” mode. The weekly tells us that the bottom mark has not yet formed. 1D (Daily) – Midterm Trend There is no obvious market structure shift in the diary. The bottoms are breaking, the tops are not breaking → trend down. However: There is a reactive purchase of 1.20 – 1.35 per day, so the demand is not completely dead. Daily outlook: short-term bounce potential but trend has not reversed. 4H (Operation Time) – Entry Triggers 4H shows the clearest part: The 1.20 – 1.30 region is a constantly defended demand area. There is no LTF uptrend → just a bounce. Volatility is low, which could mean “buying behind closed doors.” Only bottom zones make sense for 4H entry. QTUM – Spot Strategy (Level Based, Risk Controlled) Bro, I am creating a 3-stage accumulation plan with a completely professional risk management logic. BUYING ZONES (Spot) 1) Zone A – 1.20 – 1.30 Uptake: 40% Reason: 4H+1D claim defense The area where the first reactions came from Ideal for scalp/short-term bounce 2) Zone B – 0.88 – 1.00 Uptake: 35% Reason: 2019–2020 macro HL region HTF demand pool Collection area of large funds 3) Zone C – 0.68 – 0.75 Purchase: 25% Reason: Monthly low The strongest support in the macro structure Same area as “Capitulation wick” levels Coins purchased from here generally carry cycle reversal. STOP-LOSS Logic We do not use hard SL in spot trading. However: If there are 2 closes below 0.60 on the daily, the position weight can be reduced (risk control). TAKE PROFIT (TP) Zones TP1 (Short Term): 1.85 – 2.15 4H macro resistor. TP2 (Medium Term): 2.60 – 2.90 2023 is the critical turning point. TP 3 (Main Target): 3.50 – 3.80 Main distribution area – strongest target in the cycle. TP4 (Long Term): 4.90 – 5.40 Liquidity cleared spike zone → possibility of fill the wick. QTUM SUMMARY Macro = weak Midterm = neutral-negative In the short term = just bounce Real buying opportunity = in alt bands A strong upward movement only begins with a weekly close above 3.00.

Bithereum_io
تحلیل QTUM: نقطه خرید طلایی در کانال نزولی و اهداف هیجانانگیز پس از شکست!

#QTUM is currently trading within a descending channel on the 12H chart. Consider buying around the current level and within the support zone between $1.793 – $1.725. In case of a breakout above the channel resistance, the potential upside targets are: 🎯 $2.052 🎯 $2.191 🎯 $2.376 🎯 $2.561 🎯 $2.824 ⚠️ Always remember to use a tight stop-loss and maintain proper risk management.

Meisam_TA
کوانتوم (QTUM): غول خفتهای که آماده انفجار 10 برابری است!
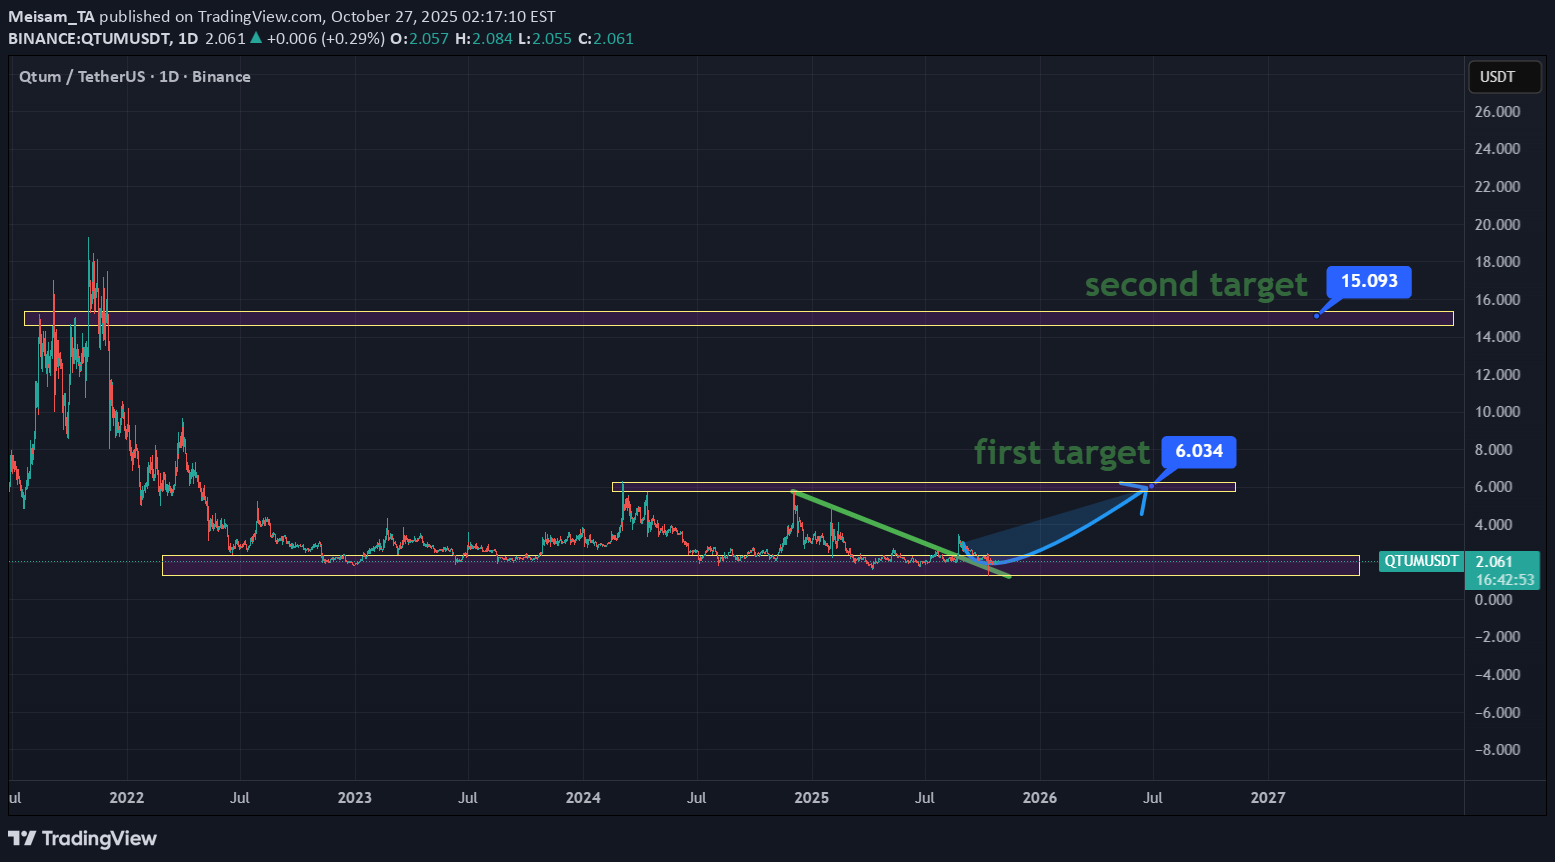
💎 Hidden Gem Alert! 💎 I think I just found one of the most underrated coins in the market — QTUM / USDT On the **daily timeframe**, this setup looks absolutely explosive! The structure, the accumulation, the momentum — everything is aligning for a potential **10x move** from here! Most people are still sleeping on it, but this chart screams **“major breakout incoming”**. It’s like discovering a **diamond before everyone else realizes its true value**. Keep an eye on this one… Because when **QTUM** wakes up, it won’t wait for anyone. #QTUM #crypto #trading #hiddenGem #10x #altcoin #breakout #bullish
wyckoff70
احتمال کفسازی مجدد Qtum/USDT: آیا الگوی ت تجمعی وایکاف در شرف تکمیل است؟
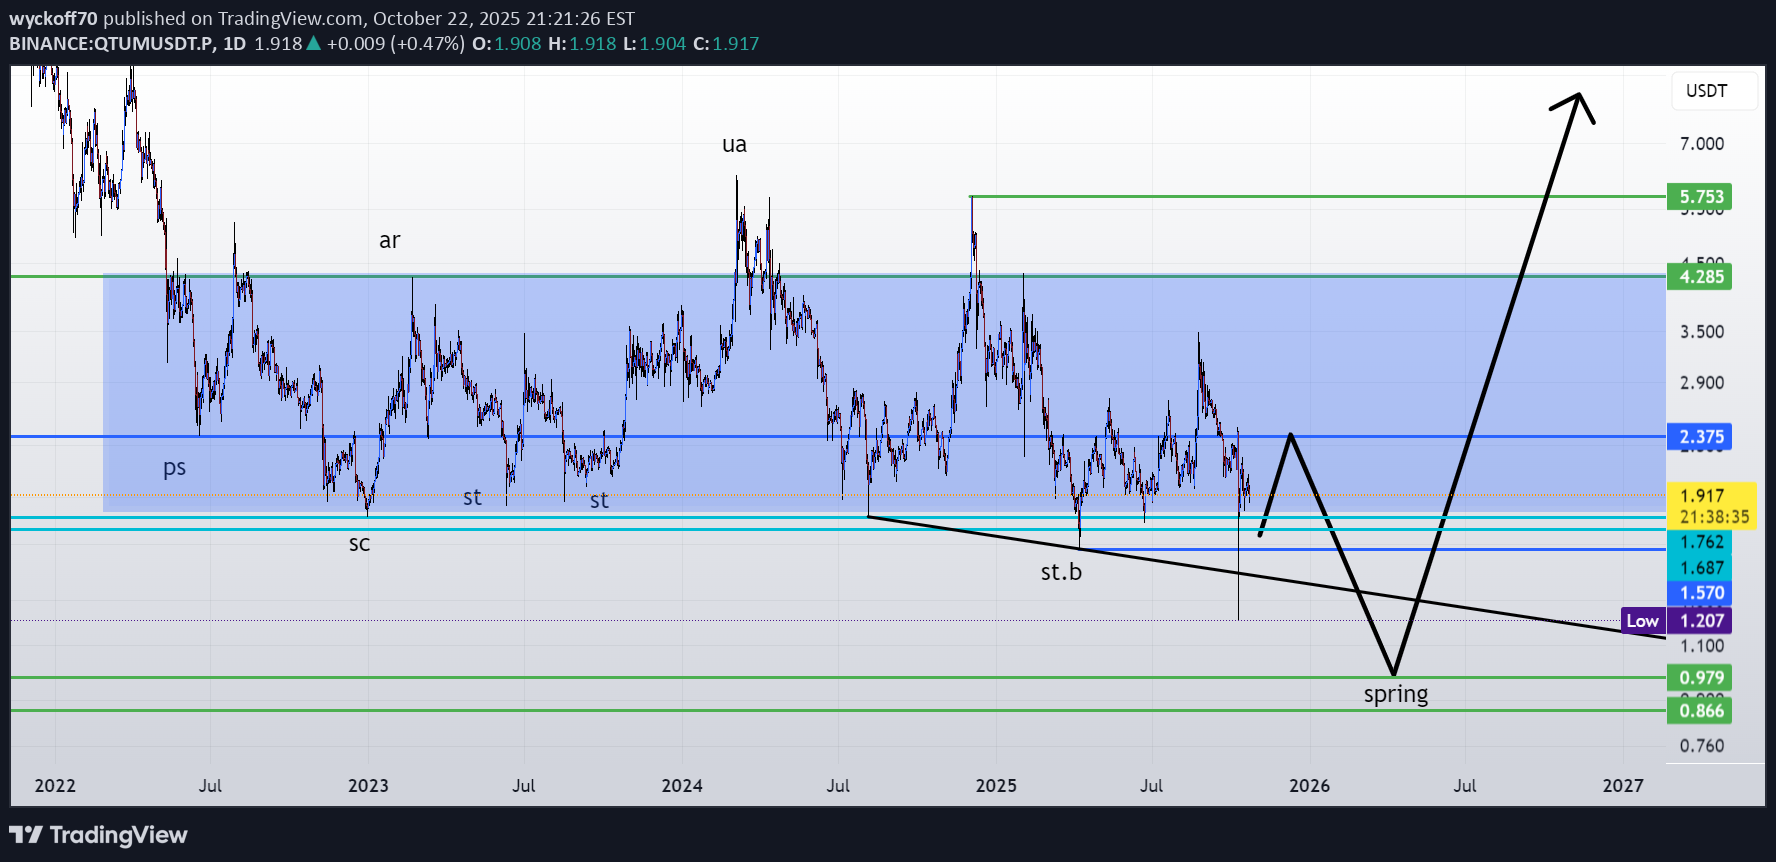
qtumusdt may form another one or two more lows and completing wqyckoff accumulation pattern
Alpha-GoldFX
کوانتوم (QTUM) آماده انفجار بزرگ: پیشبینی رشد 80 درصدی!

QTUMUSDT is currently showing a bullish continuation pattern, signaling strong potential for the next leg of upward movement. After a healthy consolidation phase, the price appears to be gearing up for a breakout, supported by consistent trading volume and renewed investor interest. The market structure suggests that QTUM is maintaining higher lows — a key indicator that bullish momentum is gradually building strength and preparing for a significant upside move. With increasing buying pressure and stable liquidity, QTUMUSDT could be positioned for a 70% to 80% price gain in the short to medium term. The pattern formation reflects ongoing confidence among traders who are accumulating during this consolidation phase, anticipating a breakout that aligns with broader market recovery signals. This setup is often seen before major impulsive rallies in trending markets. Investors have been showing growing interest in QTUM due to its consistent performance and strong fundamentals within the blockchain ecosystem. The current price action aligns with market optimism, suggesting that once resistance is broken, momentum could accelerate quickly, driving prices toward new local highs. ✅ Show your support by hitting the like button and ✅ Leaving a comment below! (What is You opinion about this Coin) Your feedback and engagement keep me inspired to share more insightful market analysis with you!

westautocomua
کیوتوم (QTUM) آماده جهش بزرگ است؟ تحلیل شگفتانگیز برای سرمایهگذاری بلندمدت!

QTUM seems to have already reached its bottom and is now showing strong upward momentum. According to the most conservative projections, I plan to take profits at the marked level (around 70%), while keeping 30% of the position open in case of a possible move toward $1. All ideas are published for my personal trading history. Any copying of trades is done at your own risk. Always remember — don’t risk money you can’t afford to lose.Most longs were liquidated, but additional ones were opened with 1.6 (average 2.19)

CryptoNuclear
QTUMUSDT — Testing Historical Support, Accumulation or Breakdown

QTUM/USDT is now sitting at one of the most crucial levels in its entire price history. The pair is once again retesting the $1.60 – $2.20 historical support zone, a level that has acted as a strong foundation multiple times since 2020. How price reacts here will determine whether QTUM enters a new accumulation phase with upside potential, or finally breaks down into fresh historical lows. --- 🔎 Technical Structure & Historical Context Long-Term Trend: Since the 2021 all-time high, QTUM has been in a persistent downtrend with a clear pattern of lower highs. Despite this, the $1.60 – $2.20 zone has held strong for over 5 years, acting as a major demand zone. Key Support Zone: $1.60 – $2.20 (yellow box). Every major retest since 2020 has resulted in a significant bounce, making this one of the most critical levels for QTUM. Important Resistance Levels (Upside Targets): $2.70 → nearest resistance, first bullish checkpoint. $3.53 → major confirmation level; a breakout above could signal a structural reversal. $4.93 → medium-term target and strong supply zone. Higher-term resistances: $8.70 → $17.36 → $27.58 (only achievable in a macro bullish cycle). Critical Downside Support: If $1.60 fails, QTUM could revisit $1.00 and potentially its all-time low at $0.71. --- 📈 Bullish Scenario (Potential Accumulation & Reversal) 1. Price holds above $1.60 – $2.20 and prints a strong bullish weekly candle with rising volume. 2. Breakout above $2.70 would serve as the first reversal signal. 3. Stronger confirmation comes with a close above $3.53. 4. Upside targets: $2.70 → $3.53 → $4.93. If $4.93 is broken, momentum could carry QTUM to $8.70+. Interpretation: This would complete a multi-bottom accumulation pattern, often the foundation of a larger bullish cycle after prolonged sideways action. --- 📉 Bearish Scenario (Descending Triangle Breakdown) 1. Price fails to hold $1.60 – $2.20. 2. Weekly close below $1.60 confirms breakdown. 3. Downside targets: $1.00 → $0.71 (historical low). 4. The chart currently resembles a descending triangle, with a flat support and lower highs pressing down. A breakdown here could trigger heavy selling pressure. Interpretation: Losing this support would likely mark a continuation of the multi-year downtrend that began in 2021. --- 🧭 Conclusion & Trading Strategy The $1.60 – $2.20 support zone is QTUM’s “life or death” level. Bullish bias confirmed on a weekly close > $2.70, with stronger reversal above $3.53. Bearish bias confirmed on a weekly close < $1.60, targeting $1.00 → $0.71. Swing Trading Approach: Consider scaling entries within $2.00 – $2.20. Place stop-loss just below $1.55. Take profit targets: $2.70 / $3.53 / $4.93. If breakdown occurs → cut losses quickly or look for short setups after a retest. Investor Perspective: This zone could be an attractive accumulation area given its historical significance. However, risk management is critical: if $1.60 breaks, QTUM could revisit historical lows. --- 📊 Key Takeaways Weekly close is far more important than intraday wicks. Watch volume and momentum indicators (RSI, OBV) for confirmation of strength. QTUM is at one of its most critical levels in the past 5 years: either a major accumulation base for a bullish cycle, or a breakdown into historical lows. --- #QTUM #QTUMUSDT #Crypto #Altcoin #TechnicalAnalysis #SupportResistance #CryptoTrading #ChartAnalysis
wyckoff70
qtumusdt
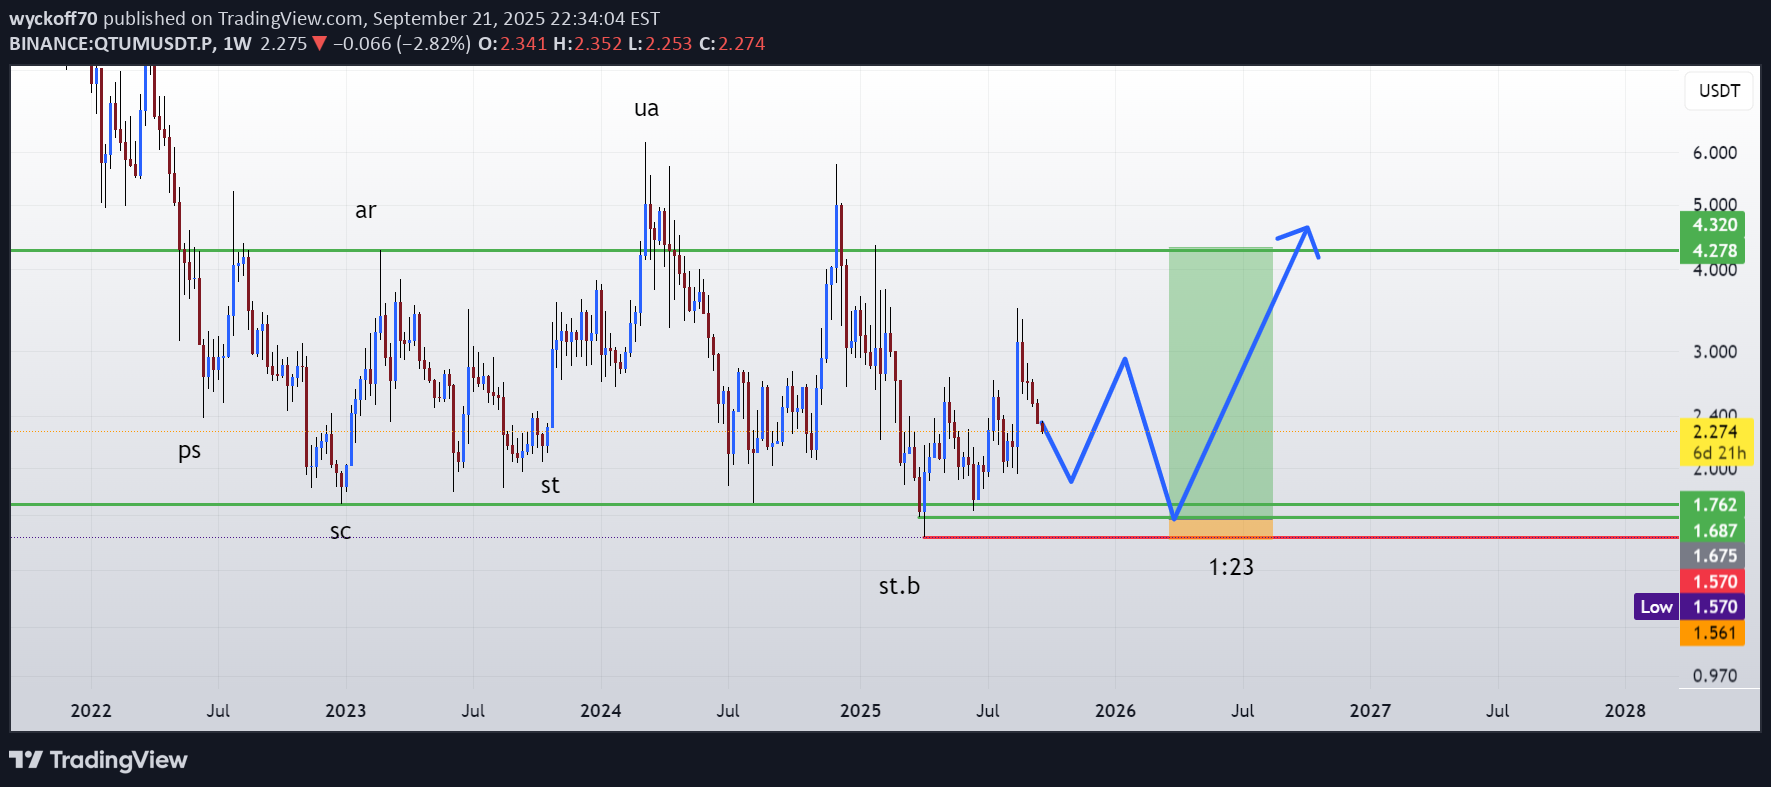
qtum is in accumulation phase we may see a good response from the lows if teseted

MB2020MB2020
QTUM/USDT - H1- LONG
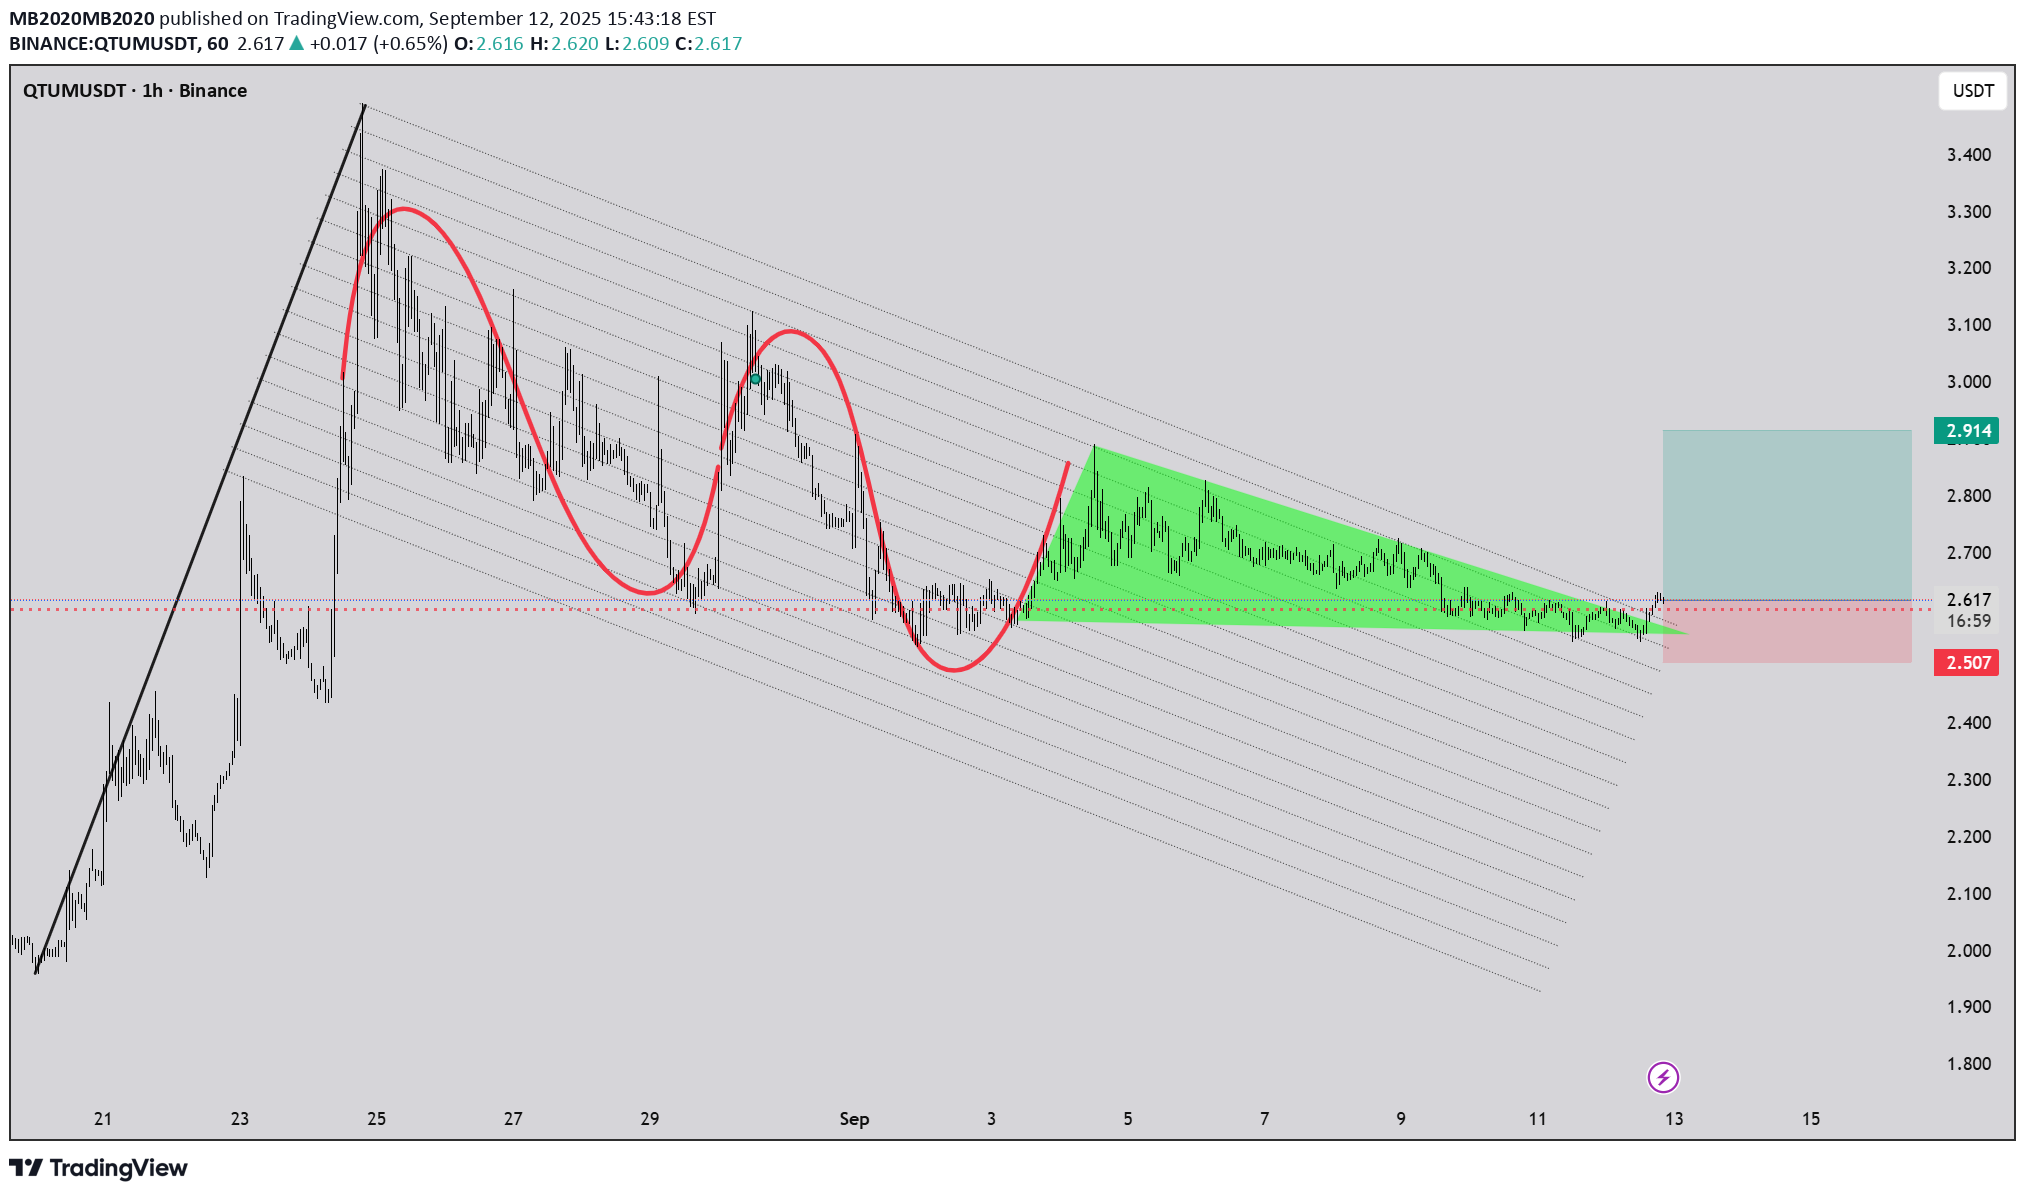
Dear friends, I warmly invite you to like this post, leave a comment with your thoughts, and share it with your friends. Your support truly means the world to me! Your likes, comments, and shares are incredibly inspiring and encourage me to create and share more analysis with you all. Thank you so much for your kindness and encouragement! Warm regards, Max
Disclaimer
Any content and materials included in Sahmeto's website and official communication channels are a compilation of personal opinions and analyses and are not binding. They do not constitute any recommendation for buying, selling, entering or exiting the stock market and cryptocurrency market. Also, all news and analyses included in the website and channels are merely republished information from official and unofficial domestic and foreign sources, and it is obvious that users of the said content are responsible for following up and ensuring the authenticity and accuracy of the materials. Therefore, while disclaiming responsibility, it is declared that the responsibility for any decision-making, action, and potential profit and loss in the capital market and cryptocurrency market lies with the trader.