
PI
Pi
| تریدر | نوع سیگنال | حد سود/ضرر | زمان انتشار | مشاهده پیام |
|---|---|---|---|---|
 X_men_Rank: 16920 | خرید | حد سود: تعیین نشده حد ضرر: تعیین نشده | 20 hour ago | |
 BeInCryptoRank: 33789 | خرید | حد سود: تعیین نشده حد ضرر: تعیین نشده | 11/2/2025 | |
 The_Alchemist_Trader_Rank: 34810 | خرید | حد سود: تعیین نشده حد ضرر: تعیین نشده | 11/21/2025 |
Price Chart of Pi
سود 3 Months :
سیگنالهای Pi
Filter
Sort messages by
Trader Type
Time Frame
X_men_
تحلیل شبکه پای (Pi Network): فرصت خرید در نمودار 15 دقیقهای!
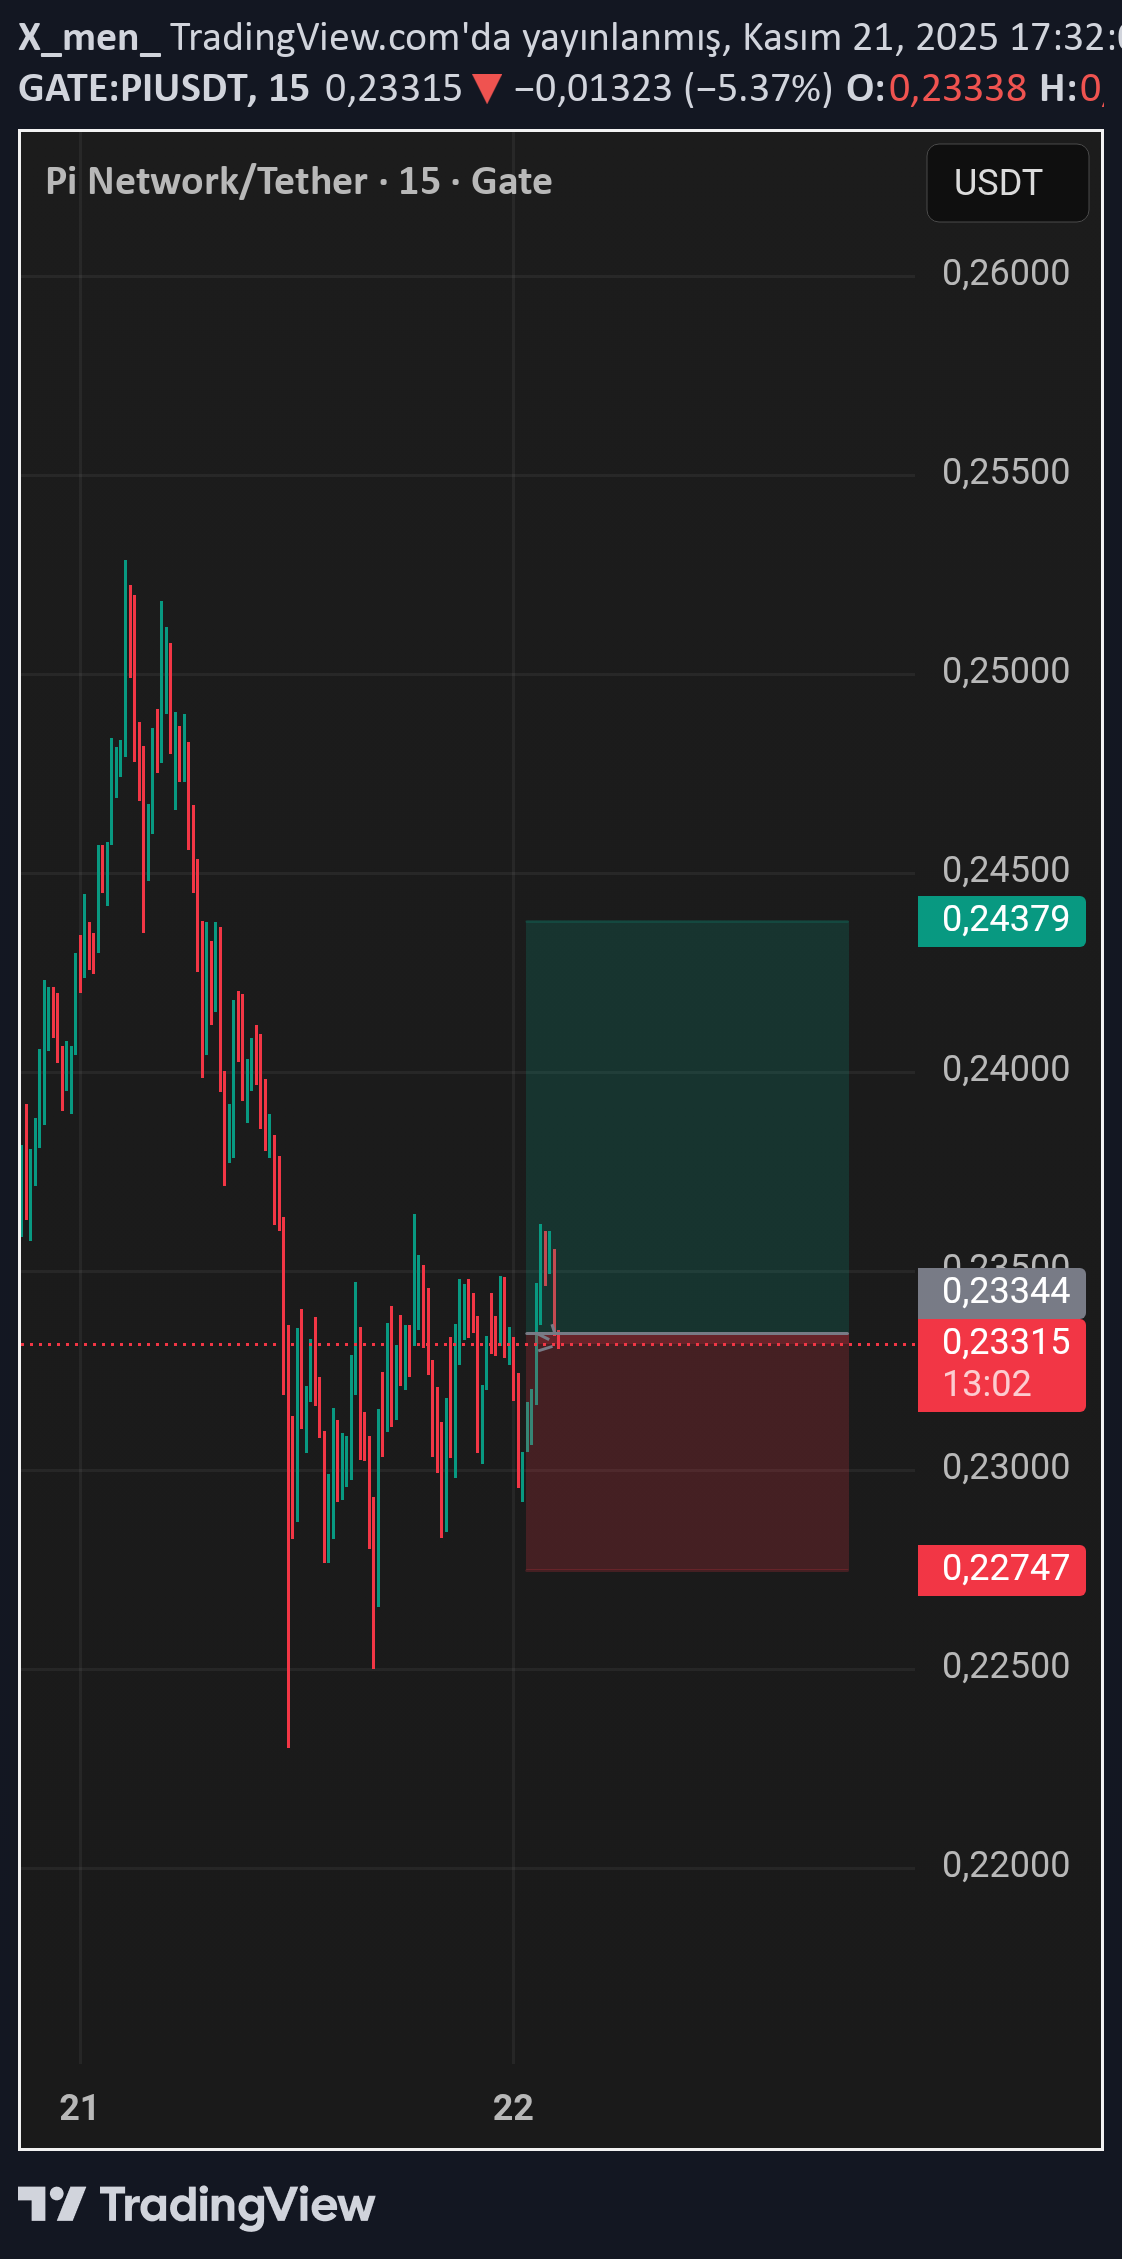
I took a buy trade on the 15-minute chart. Anyone who wishes can evaluate it. Good luck 🤲
The_Alchemist_Trader_
الگوی صعودی نادر در شبکه پای (Pi): آیا قیمت آماده شکستن سقف ۰.۲۸ دلار است؟

Pi Network is developing a rare Adam and Eve bullish reversal pattern, with price holding firmly above the Point of Control. This behaviour signals early accumulation and improving sentiment at current levels. As PI pushes toward the neckline between $0.21 and $0.28, the rounded bottom structure continues to strengthen. Buyers are becoming more active, suggesting the market may be preparing for a breakout attempt. Key Points - Rare Adam and Eve reversal structure forming - Price holding above the Point of Control showing demand - Neckline at $0.21–$0.28 is the major breakout zone What to Expect If PI breaks above the neckline with strong volume, a move toward $0.35 becomes likely. Losing the POC would weaken the setup and delay the reversal.
The_Alchemist_Trader_
سیگنالهای صعودی پای نتورک: آیا قیمت به ۰.۳۷ دلار خواهد رسید؟
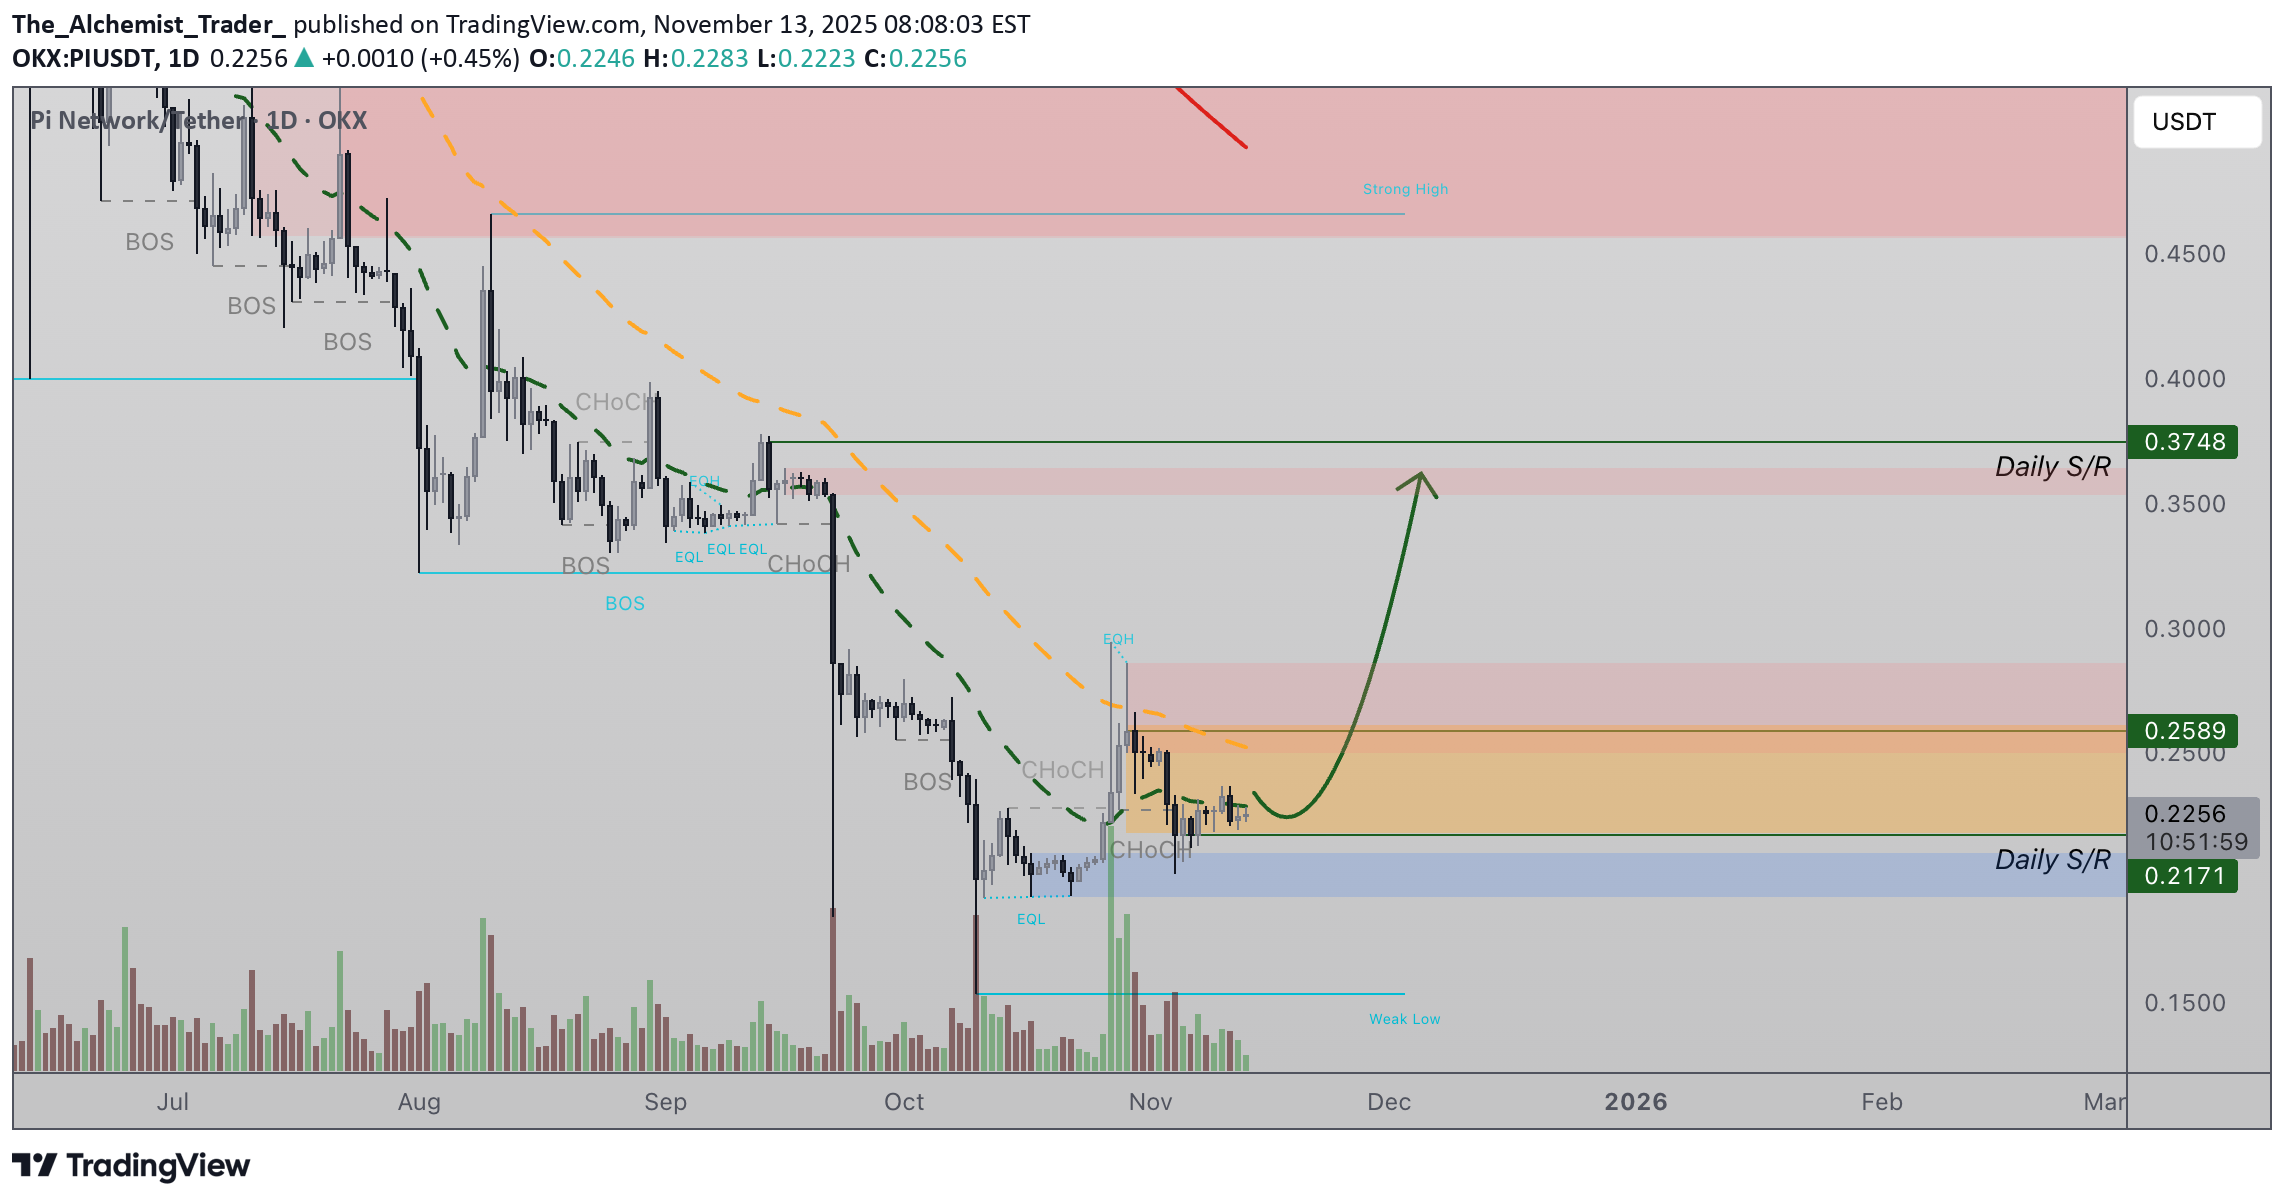
Pi Network is currently trading above the $0.21 support, showing early signs of a potential accumulation phase. This region has acted as a structural foundation in recent sessions, and as long as price continues to print multiple candle closes above $0.21, the probability of a developing bottom increases significantly. - Accumulation Zone: Holding $0.21 supports the idea of a base forming for higher prices. - Key Requirement: Price must avoid closing below $0.21 to maintain the bullish accumulation outlook. - Upside Objective: A sustained hold could fuel a rally toward the $0.37 resistance region. From a technical perspective, Pi Network is currently positioned at a key trade location that will determine its next directional move. Maintaining strength above support would validate the accumulation structure and open the path toward higher resistance levels in the coming days and weeks.
BeInCrypto
نشانه خرید هوشمند در سکه پای (Pi Coin) چیست؟ تحلیل فنی با اندیکاتورهای کلیدی
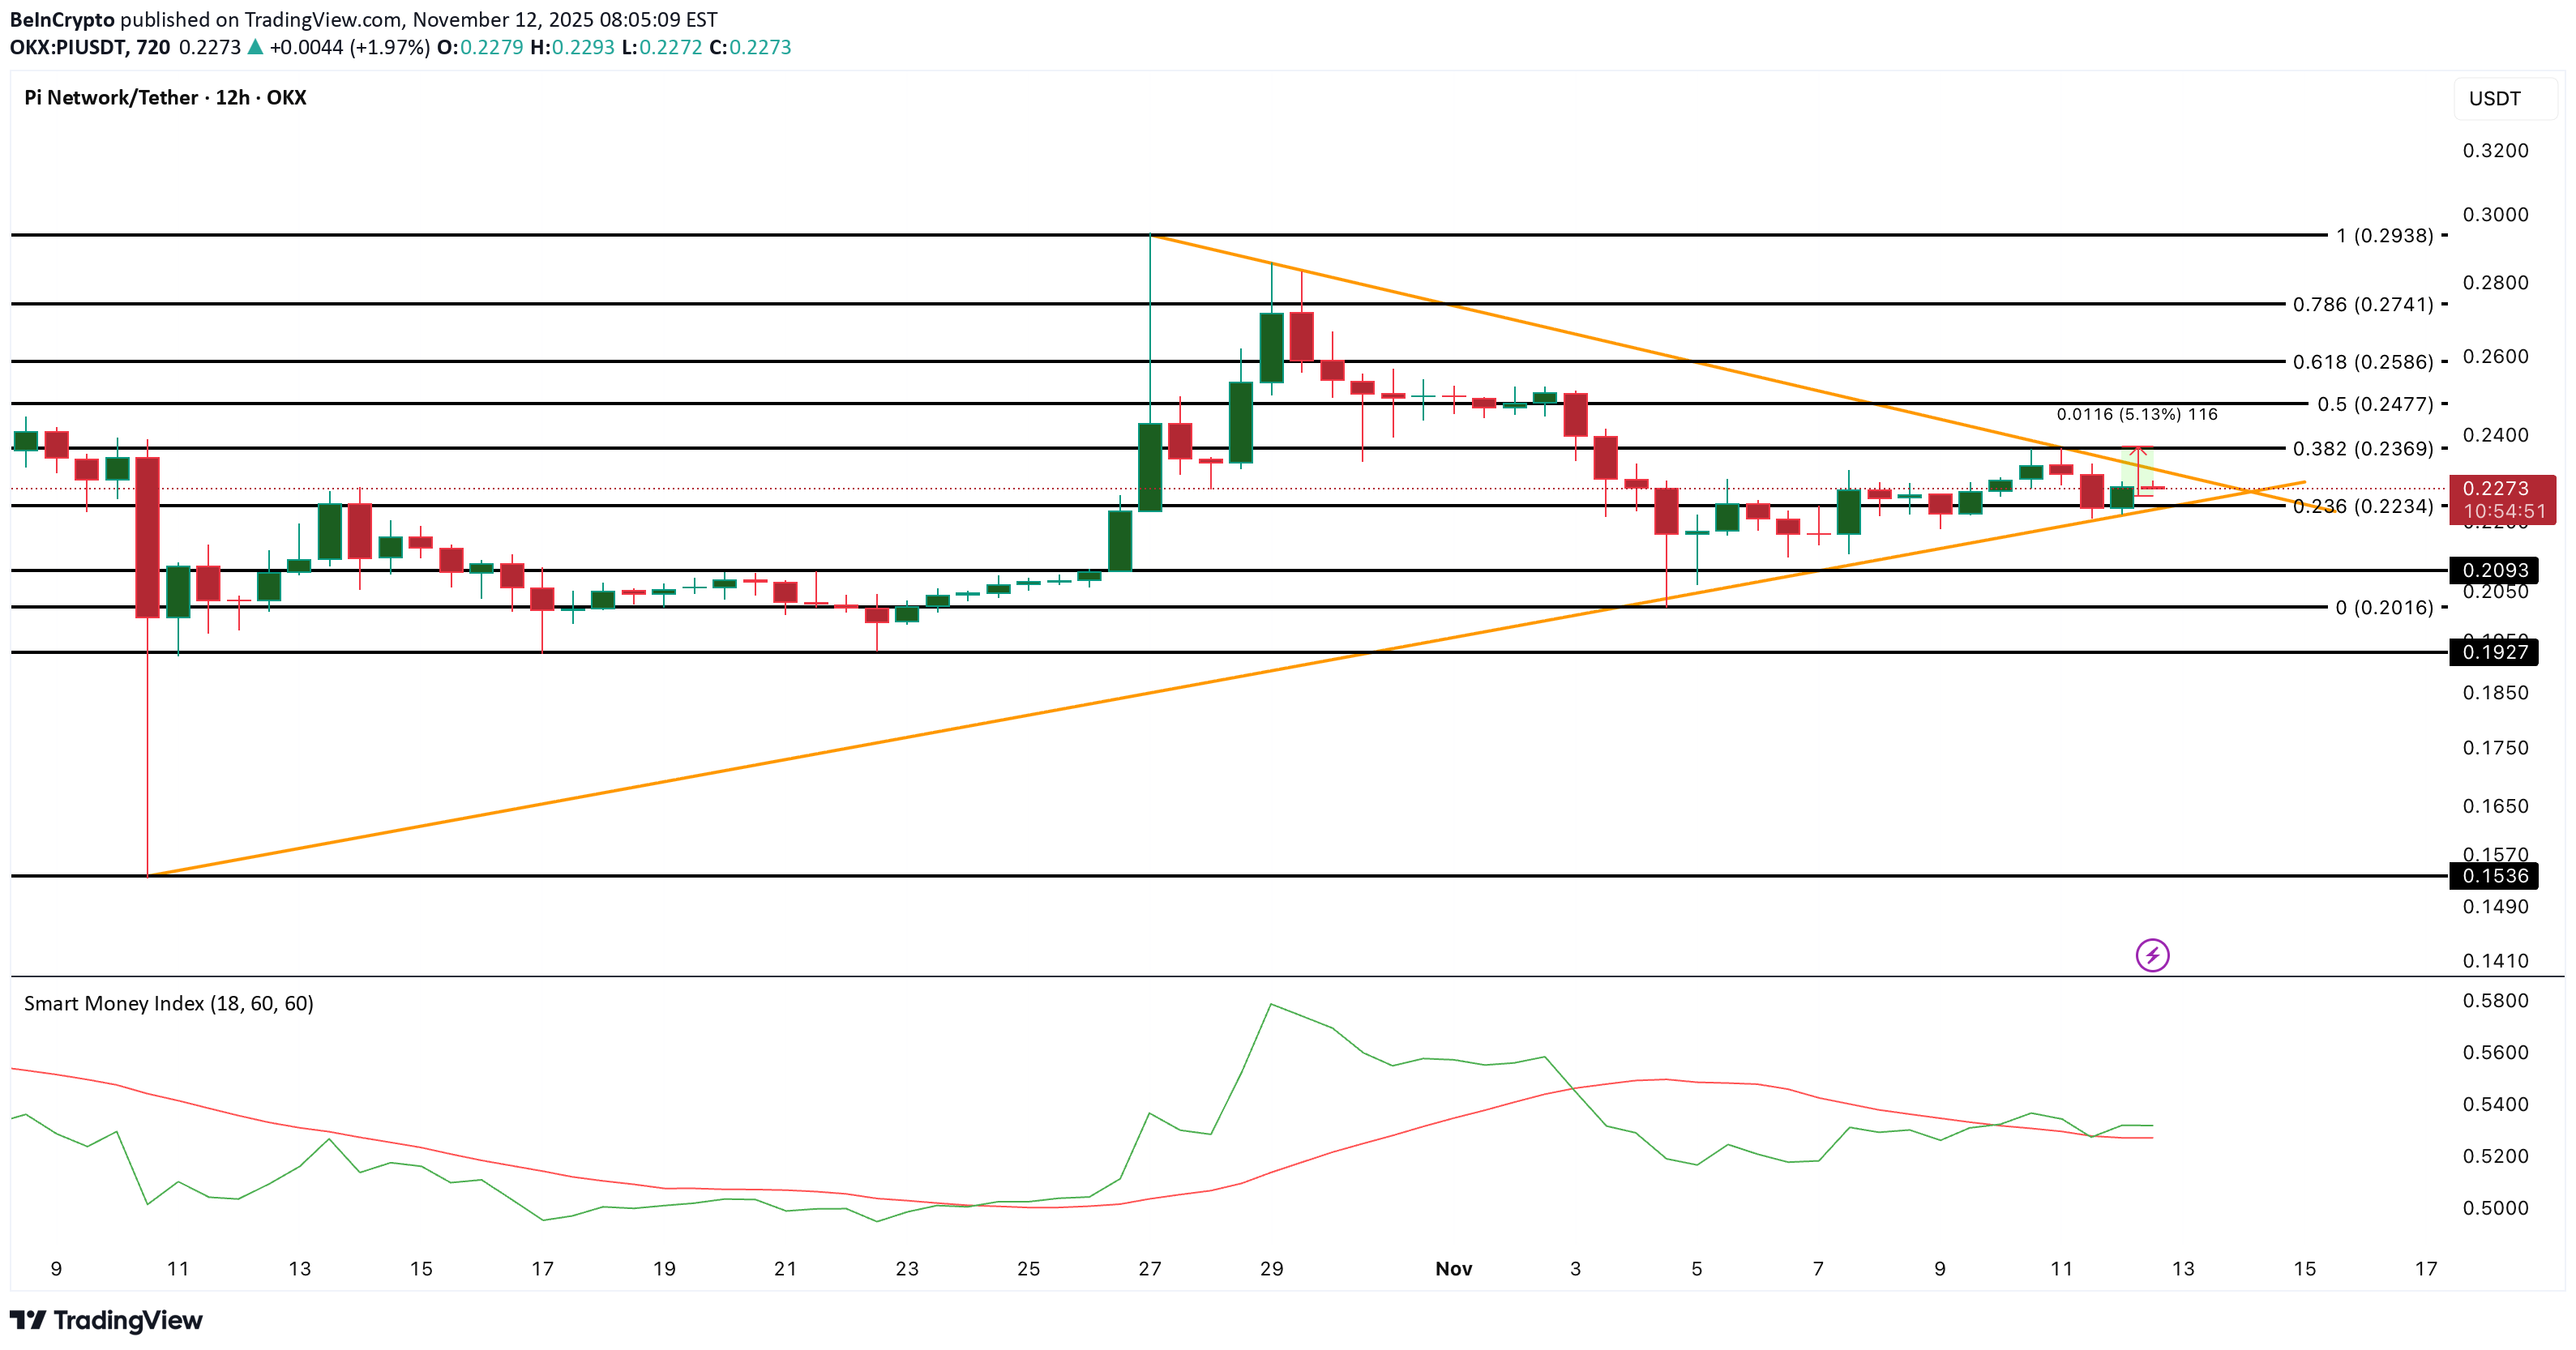
Pi Coin’s price is pressing against the upper line of a symmetrical triangle, signaling a possible breakout attempt. The squeeze shows a tug between short-term sellers and early buyers trying to regain control. On the 12-hour chart, the Smart Money Index (SMI) has turned up for the first time since early November, showing renewed participation from large holders. If the price closes above $0.23, it could confirm a breakout and target $0.26–$0.27. A failure to hold $0.20 would reopen the path to $0.15. On the daily chart, the MACD — which tracks trend momentum — is flattening after weeks above its signal line, hinting that bullish pressure is fading. However, On-Balance Volume (OBV) is ticking higher, suggesting quiet accumulation beneath the surface. Pi Coin’s price stands at a technical pivot — smart money seems to be betting on a breakout, not a breakdown.
BeInCrypto
قیمت پای کوین در آستانه سقوط مجدد؛ آیا سرمایهگذاران ناامید میشوند؟
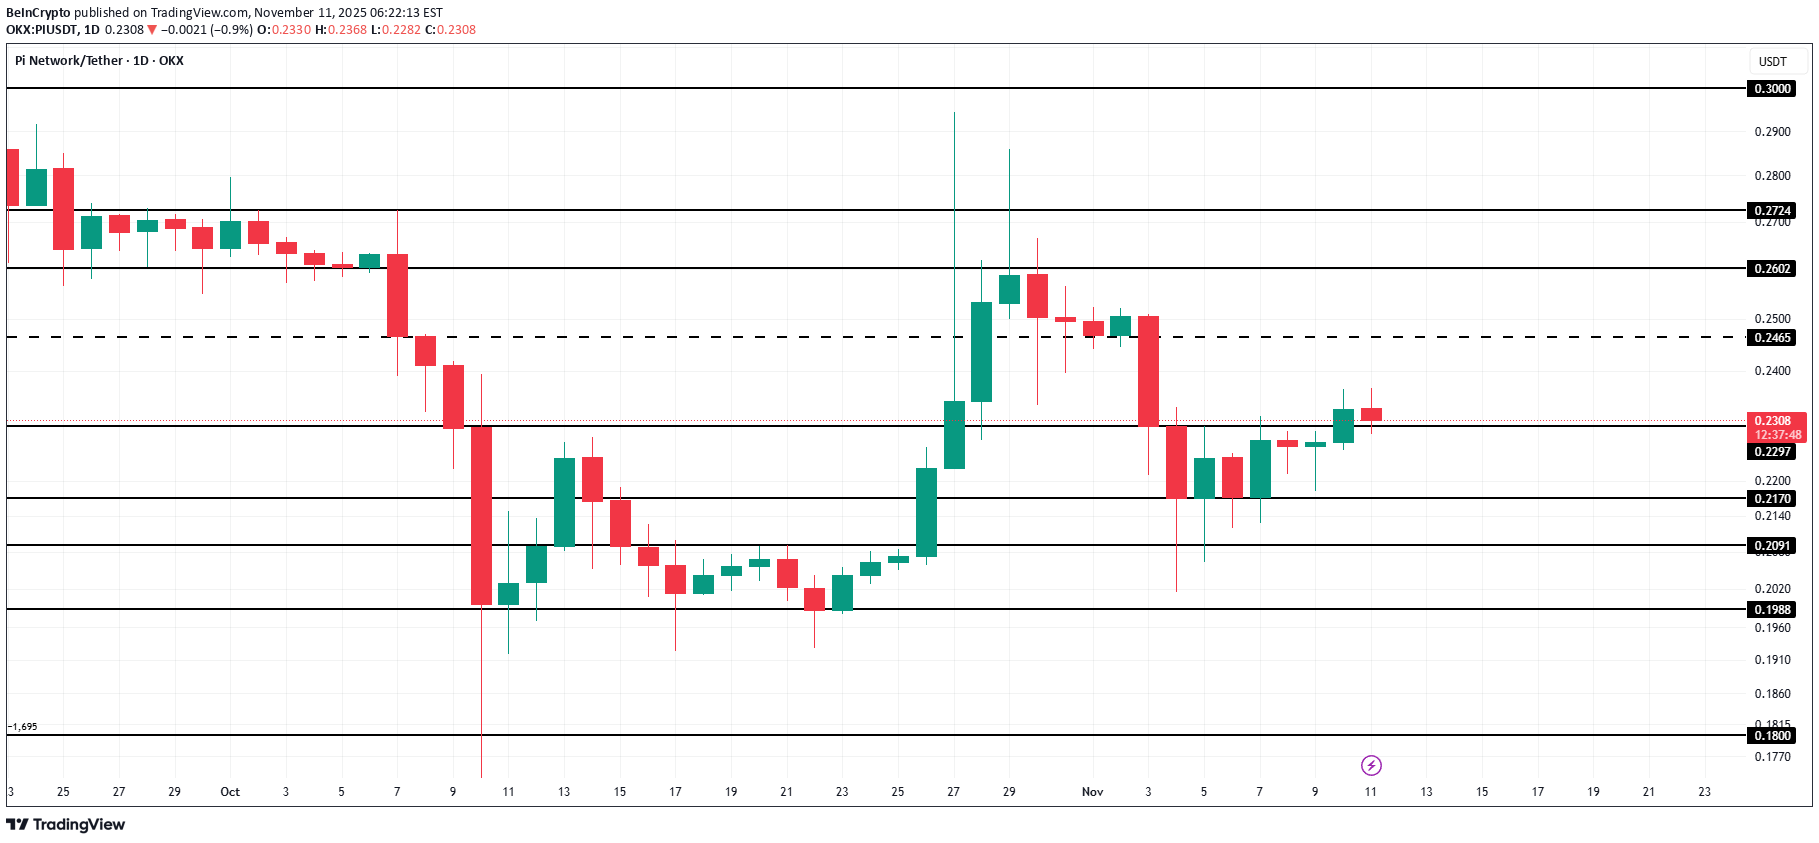
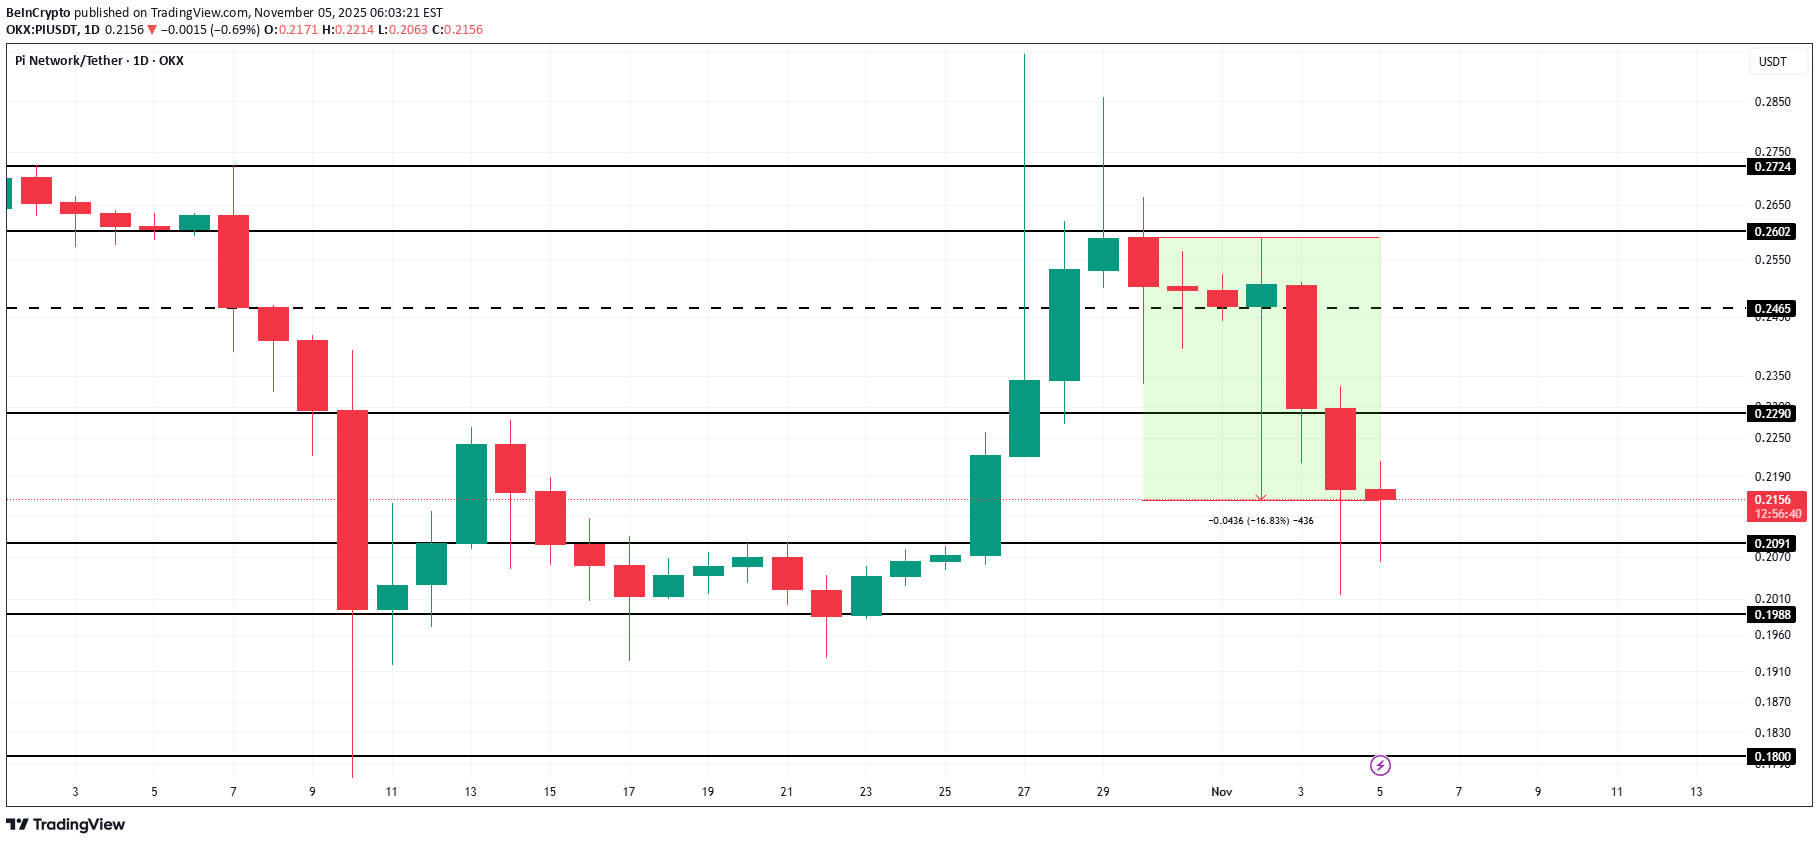
Pi Coin’s price stands at $0.235 at the time of writing, after successfully breaching the $0.229 resistance level within the last 24 hours. The altcoin now appears to be regaining some lost ground from its late October decline. For Pi Coin to fully recover from its 15% drop, the price must break through the $0.246 resistance and rally toward $0.260. Achieving this would reinforce the bullish outlook and restore market confidence among cautious investors. However, if the bullish momentum weakens, Pi Coin could slip below $0.229 again and test the $0.217 support level. A breakdown beneath this support would invalidate the bullish thesis and expose the cryptocurrency to further downside risks.
BeInCrypto
قیمت سکه پای (Pi Coin) به مرز ۰.۲۰ دلار رسید: آیا زمزمههای تثبیت قیمت جدی است؟
Pi Coin’s price has declined by nearly 16% over the past week after failing to breach the $0.260 resistance. At the time of writing, the altcoin is trading at $0.220, reflecting its weakening technical position amid fading market support and declining investor optimism. If the downward trend persists, Pi Coin’s price could fall below $0.209 and reenter a consolidation zone between $0.209 and $0.198. This pattern, seen previously, could stall recovery attempts and extend the bearish phase for a few more weeks. However, a bounce from current levels could shift momentum. If Pi Coin reclaims $0.229 as support, it could attempt a rally toward the $0.246 resistance. Sustaining inflows and investor interest will be critical to invalidating the bearish outlook.
BeInCrypto
آیا خیزش قیمت کوین پای تمام نشده؟ دو نمودار صعودی راز آینده را فاش میکنند
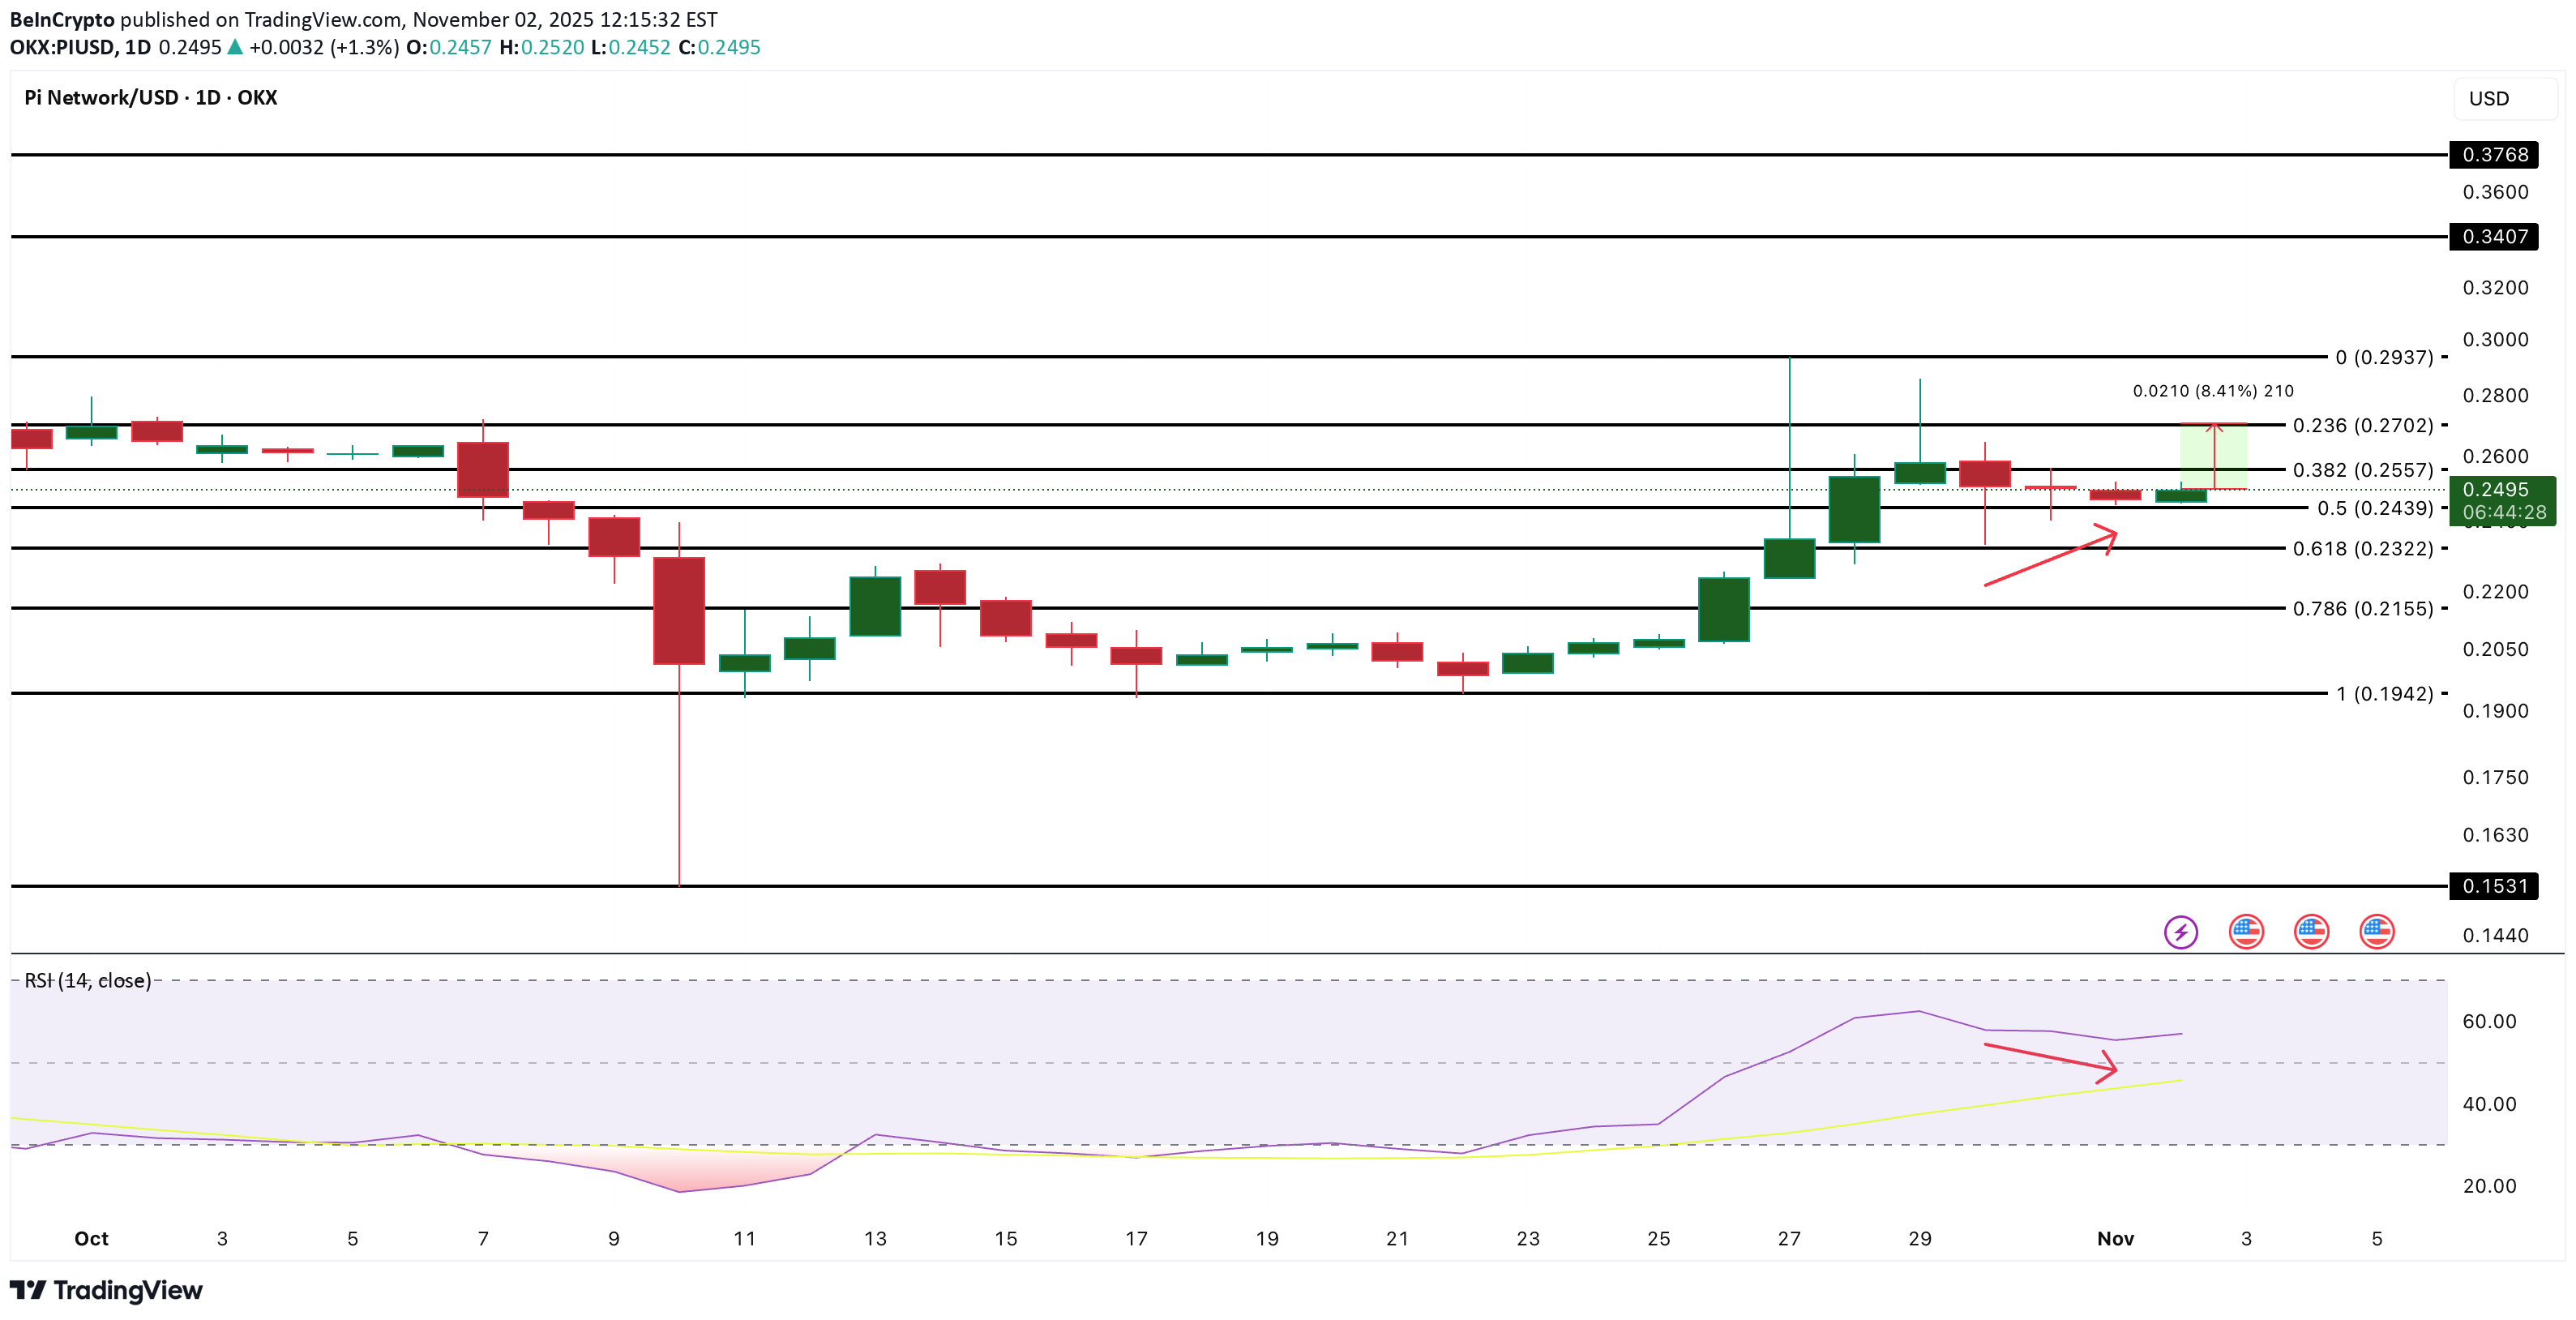
PIUSD ’s rebound remains intact. On the daily chart, the price has formed a higher low between October 30 and November 1, while the Relative Strength Index (RSI) made a lower low. This creates a hidden bullish divergence, which often signals that the broader uptrend may continue even after short pullbacks. If PIUSD manages a daily close above $0.255, it could extend gains toward $0.270, then $0.293, and possibly $0.340 if volume supports it. However, a drop below $0.215 would weaken this setup and risk a deeper correction toward $0.194. On the 4-hour chart, an extra layer of confirmation is emerging — the 50-period Exponential Moving Average (EMA) is closing in on the 200-EMA from below. If this golden crossover completes, it would further validate the strength seen on the daily timeframe and hint at continued upside momentum. For now, the chart shows a cautious but steady rebound, with hidden bullish divergence and an impending EMA crossover giving Pi Coin bulls some reason to stay hopeful.
BeInCrypto
قیمت پای کوین (Pi Coin) در نوامبر ۲۰۲۵: پیشبینی صعودی یا سقوط احتمالی؟
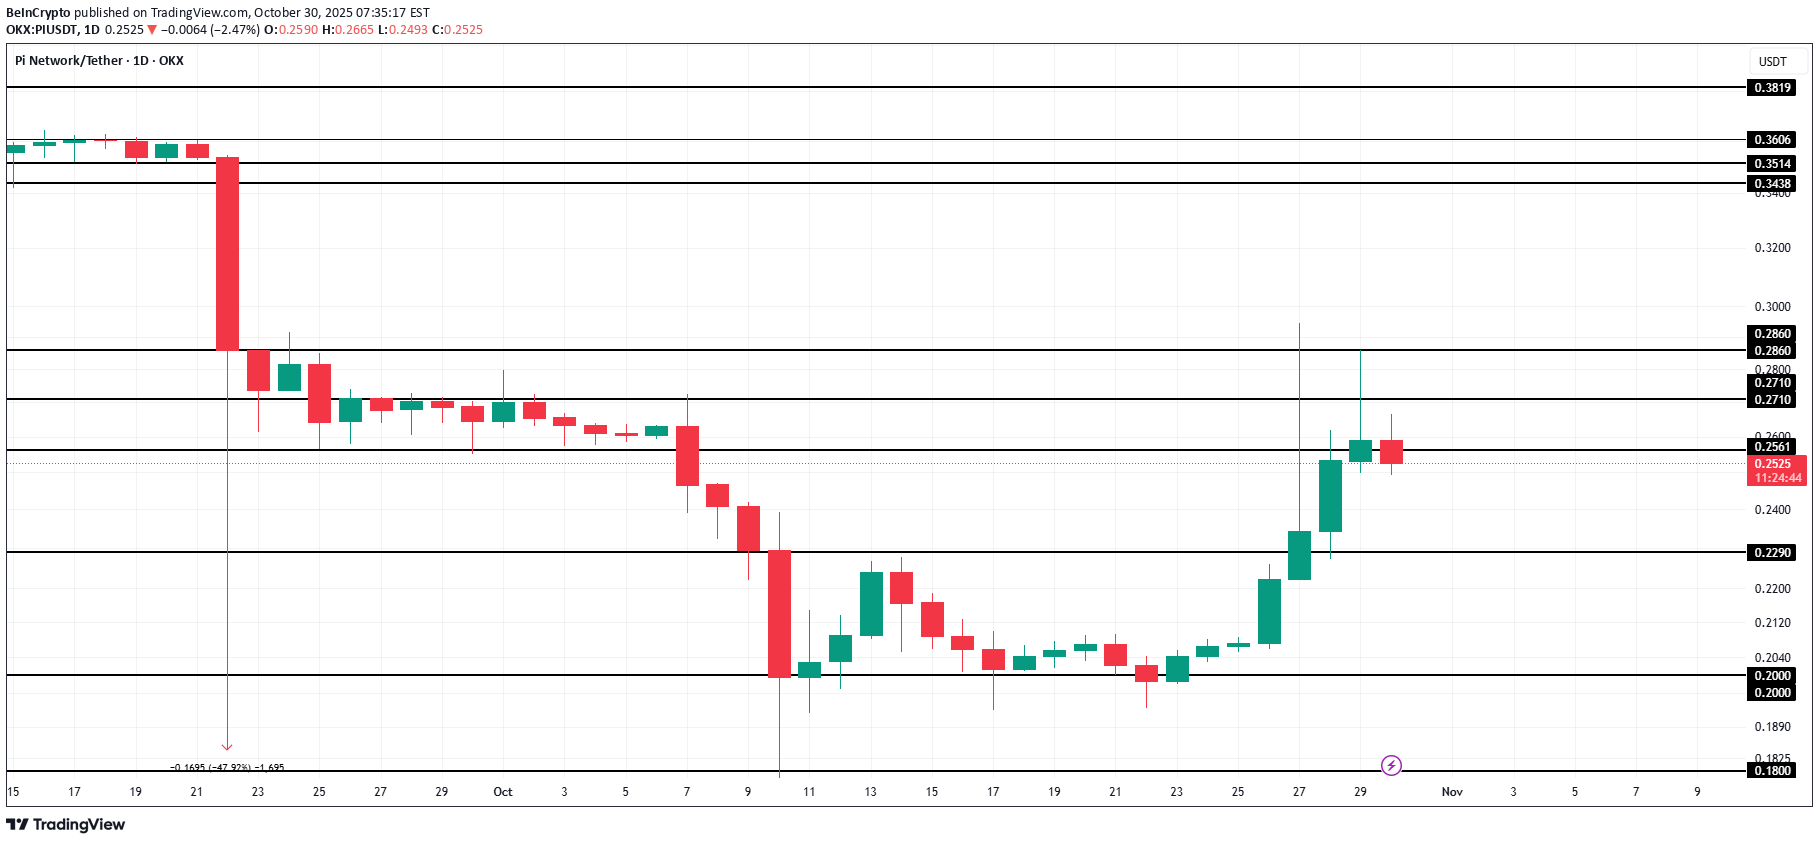
At the time of writing, Pi Coin trades at $0.254, sitting just below the $0.260 resistance. The immediate short-term goal for the token is to reach the $0.300 psychological level, which would strengthen bullish confidence. However, if investor sentiment remains weak and inflows fail to pick up, Pi Coin’s price may fail to breach $0.260. A breakdown through $0.229 could push it lower toward $0.209, deepening the current correction. Conversely, if the altcoin gains momentum and climbs to $0.300, it would represent an 18% rise, potentially attracting new inflows. A sustained push could extend the rally toward $0.360, helping Pi Coin recover September’s losses and invalidate the bearish thesis.
BeInCrypto
سکه پای (Pi) به مرز 0.29 دلار رسید: آیا این شکاف صعودی، قیمت را به اوج جدید میرساند؟
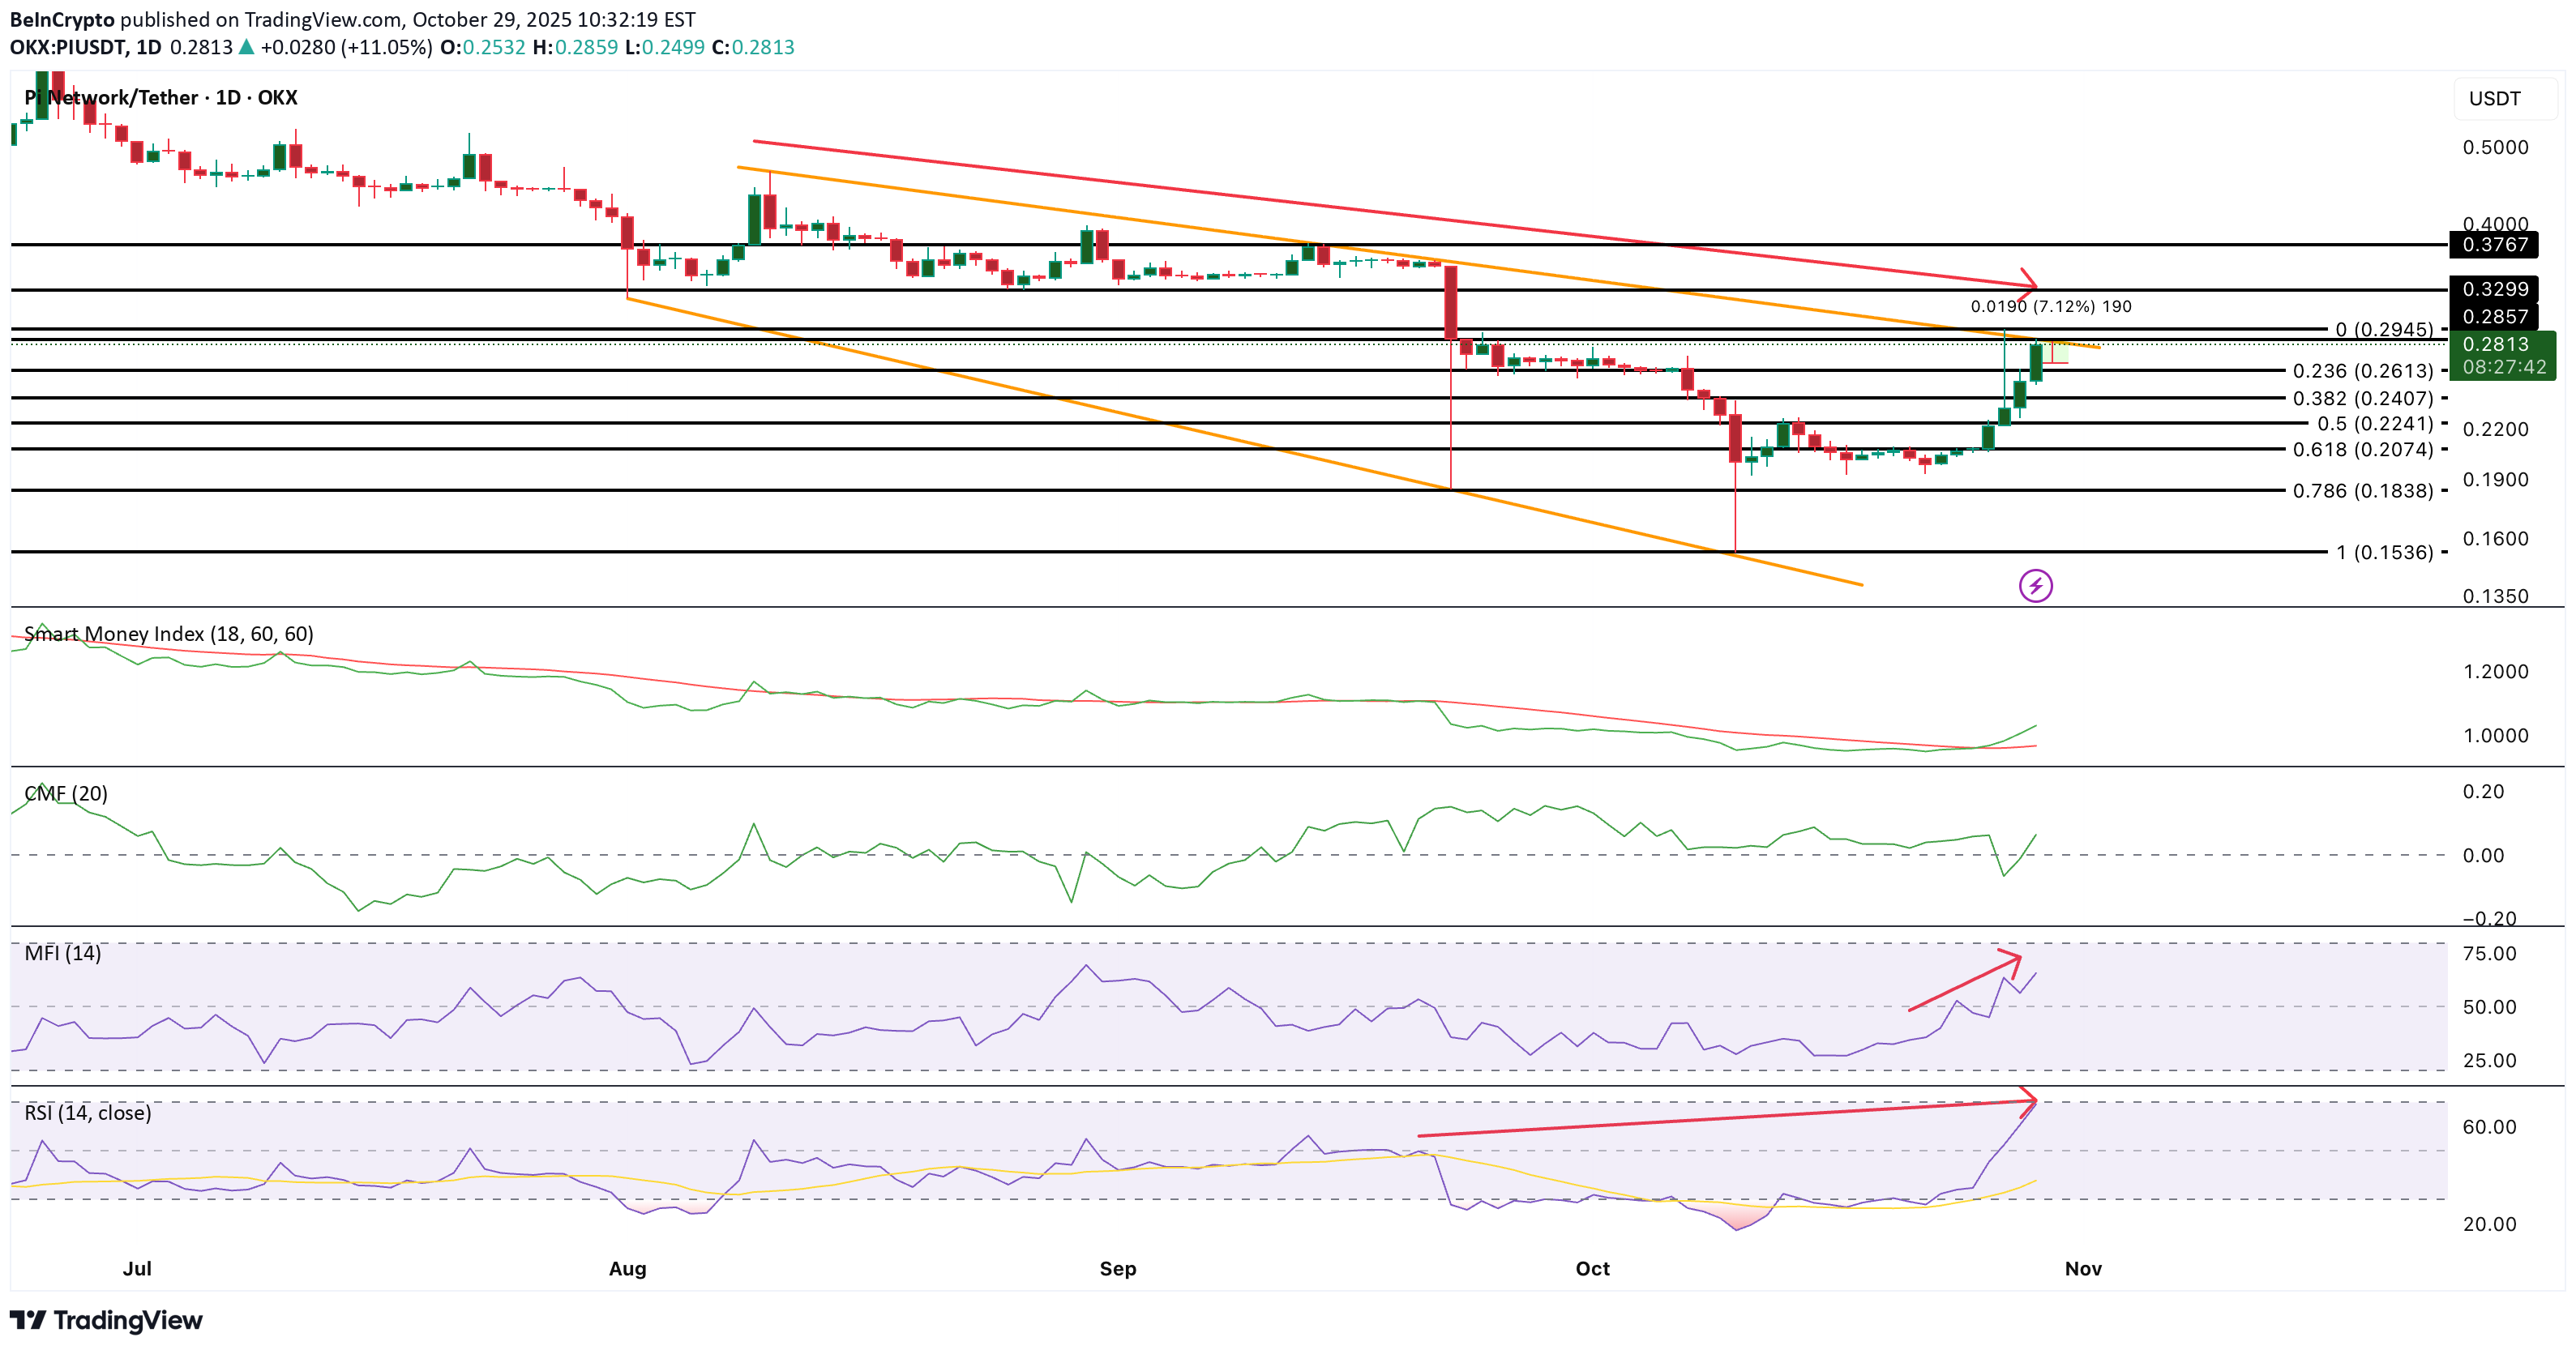
PIUSDT has surged over 30% this week, testing the upper boundary of its falling wedge near $0.29 — a level that could define its short-term trend. A daily close above $0.29 would confirm a breakout, targeting $0.32 and possibly $0.37, while a failure could extend the consolidation. The $0.28 zone remains the first resistance to clear, with support at $0.20. A drop below that would invalidate the bullish structure and expose $0.18–$0.15. Momentum indicators show mixed signals. The Smart Money Index has risen sharply since October 25, and the Chaikin Money Flow (CMF) turned positive, hinting at renewed large-wallet interest. The Money Flow Index (MFI) also shows steady retail accumulation. However, a hidden bearish divergence between price and RSI (lower highs in price vs. higher highs in RSI) warns that PIUSDT 's rally could face short-term exhaustion if buyers fail to defend the $0.28–$0.29 range.

miljedtothemoon
تحلیل تکنیکال PIUSDT.P: ریزش قریبالوقوع تا ۰.۰۹۵۳ دلار!
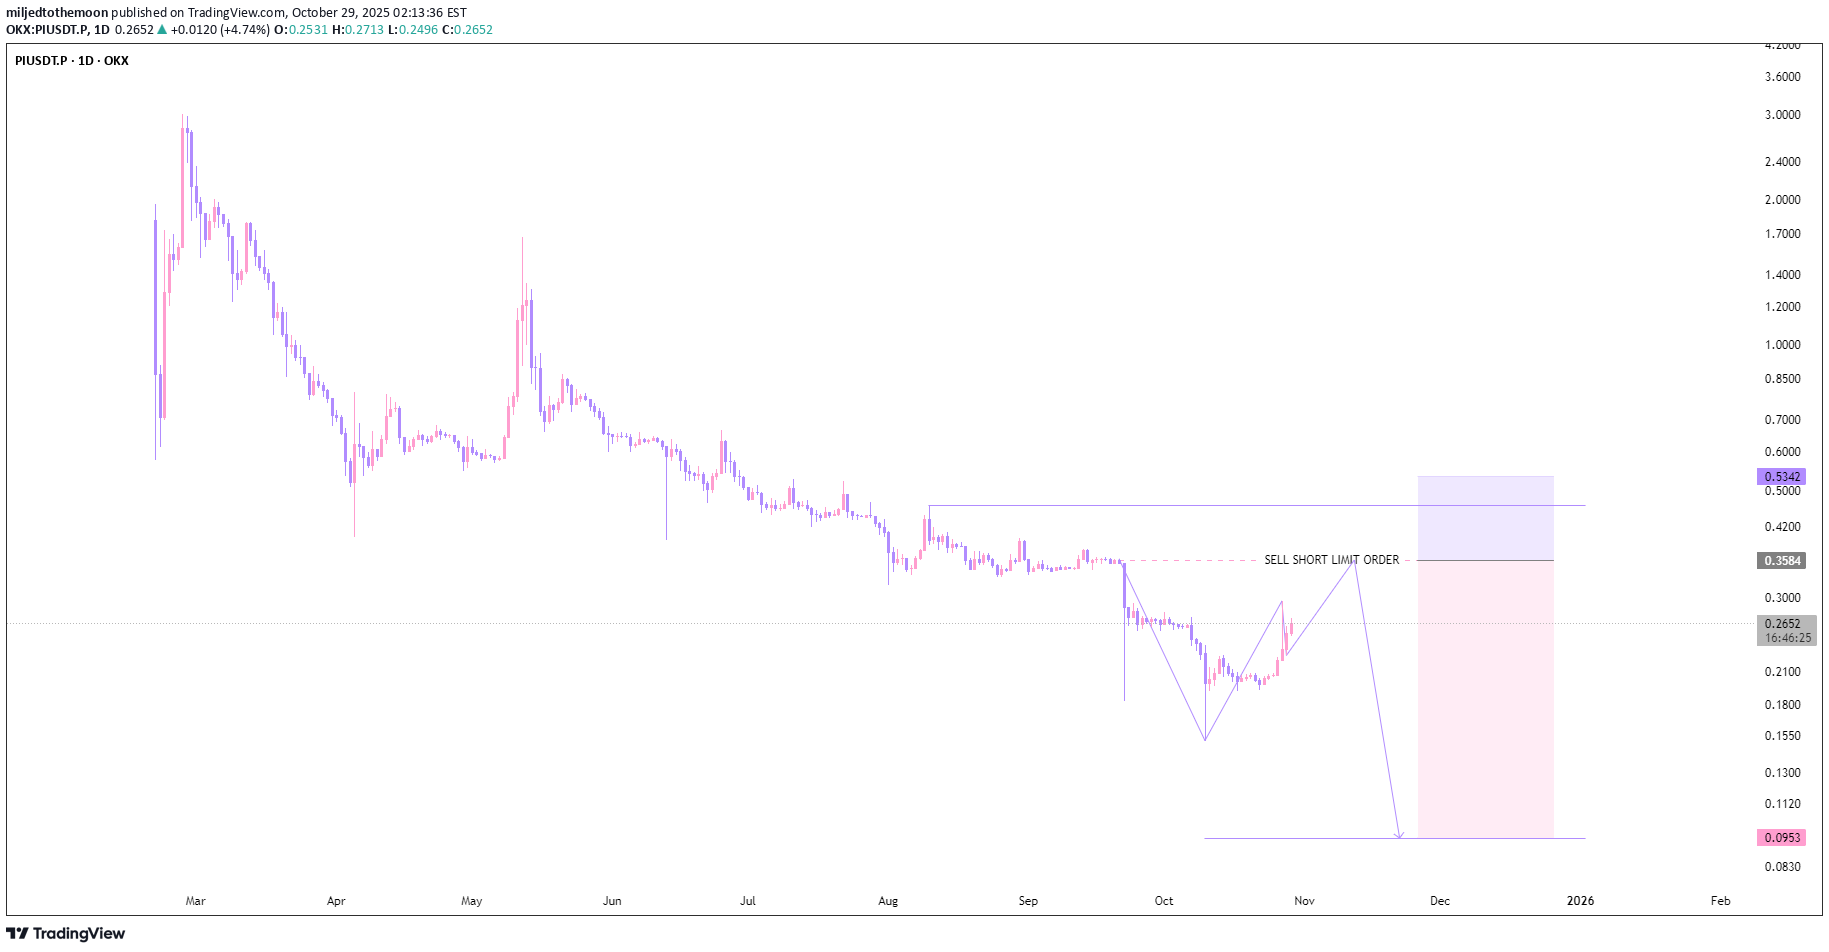
The chart shows a clear bearish market structure with consistent lower highs and lower lows. Price is currently retracing toward the $0.3584–$0.5342 resistance zone, where a sell short limit order aligns with the broader downtrend, targeting a continuation toward the $0.0953 support area.
Disclaimer
Any content and materials included in Sahmeto's website and official communication channels are a compilation of personal opinions and analyses and are not binding. They do not constitute any recommendation for buying, selling, entering or exiting the stock market and cryptocurrency market. Also, all news and analyses included in the website and channels are merely republished information from official and unofficial domestic and foreign sources, and it is obvious that users of the said content are responsible for following up and ensuring the authenticity and accuracy of the materials. Therefore, while disclaiming responsibility, it is declared that the responsibility for any decision-making, action, and potential profit and loss in the capital market and cryptocurrency market lies with the trader.