
OSMO
Osmosis
| تریدر | نوع سیگنال | حد سود/ضرر | زمان انتشار | مشاهده پیام |
|---|---|---|---|---|
No results found. | ||||
Price Chart of Osmosis
سود 3 Months :
سیگنالهای Osmosis
Filter
Sort messages by
Trader Type
Time Frame

Alpha-GoldFX
سیگنال انفجاری ارز OSMO: گوه نزولی، پتانسیل رشد ۹۰ درصدی!

OSMOUSDT is showing a classic falling wedge pattern on the chart, which is widely considered a bullish reversal setup in technical analysis. This pattern often signals the end of a downtrend and the beginning of a potential breakout rally. With strong trading volume supporting the structure, OSMO has caught the attention of investors who are anticipating significant upside momentum in the coming sessions. The falling wedge breakout scenario aligns well with current market dynamics, where OSMO has been consolidating at lower levels and building buying pressure. A confirmed breakout from this wedge could trigger a strong move to the upside, with expectations pointing toward a gain of 90% to 100%+. This makes OSMOUSDT an attractive pair for traders looking for high-reward opportunities. Investor interest in OSMO is steadily growing, adding fuel to the bullish outlook. If the current volume levels sustain, the price action could accelerate quickly, targeting higher resistance zones with strong momentum. The key factor will be whether the breakout can hold above its support levels and attract further institutional and retail participation. ✅ Show your support by hitting the like button and ✅ Leaving a comment below! (What is You opinion about this Coin) Your feedback and engagement keep me inspired to share more insightful market analysis with you!

Bithereum_io
رالی بزرگ OSMO آغاز شد؟ اهداف قیمتی جدید پس از شکست مقاومت مهم!

#OSMO has broken above the descending triangle resistance and the SMA100 on the daily chart. In case of a successful retest, the potential targets are: 🎯 $0.1951 🎯 $0.2148 🎯 $0.2344 🎯 $0.2624 🎯 $0.2981 ⚠️ Always remember to use a tight stop-loss and follow proper risk management.

CHOWTRADE
$OSMO yükselişe mi hazırlanıyor?
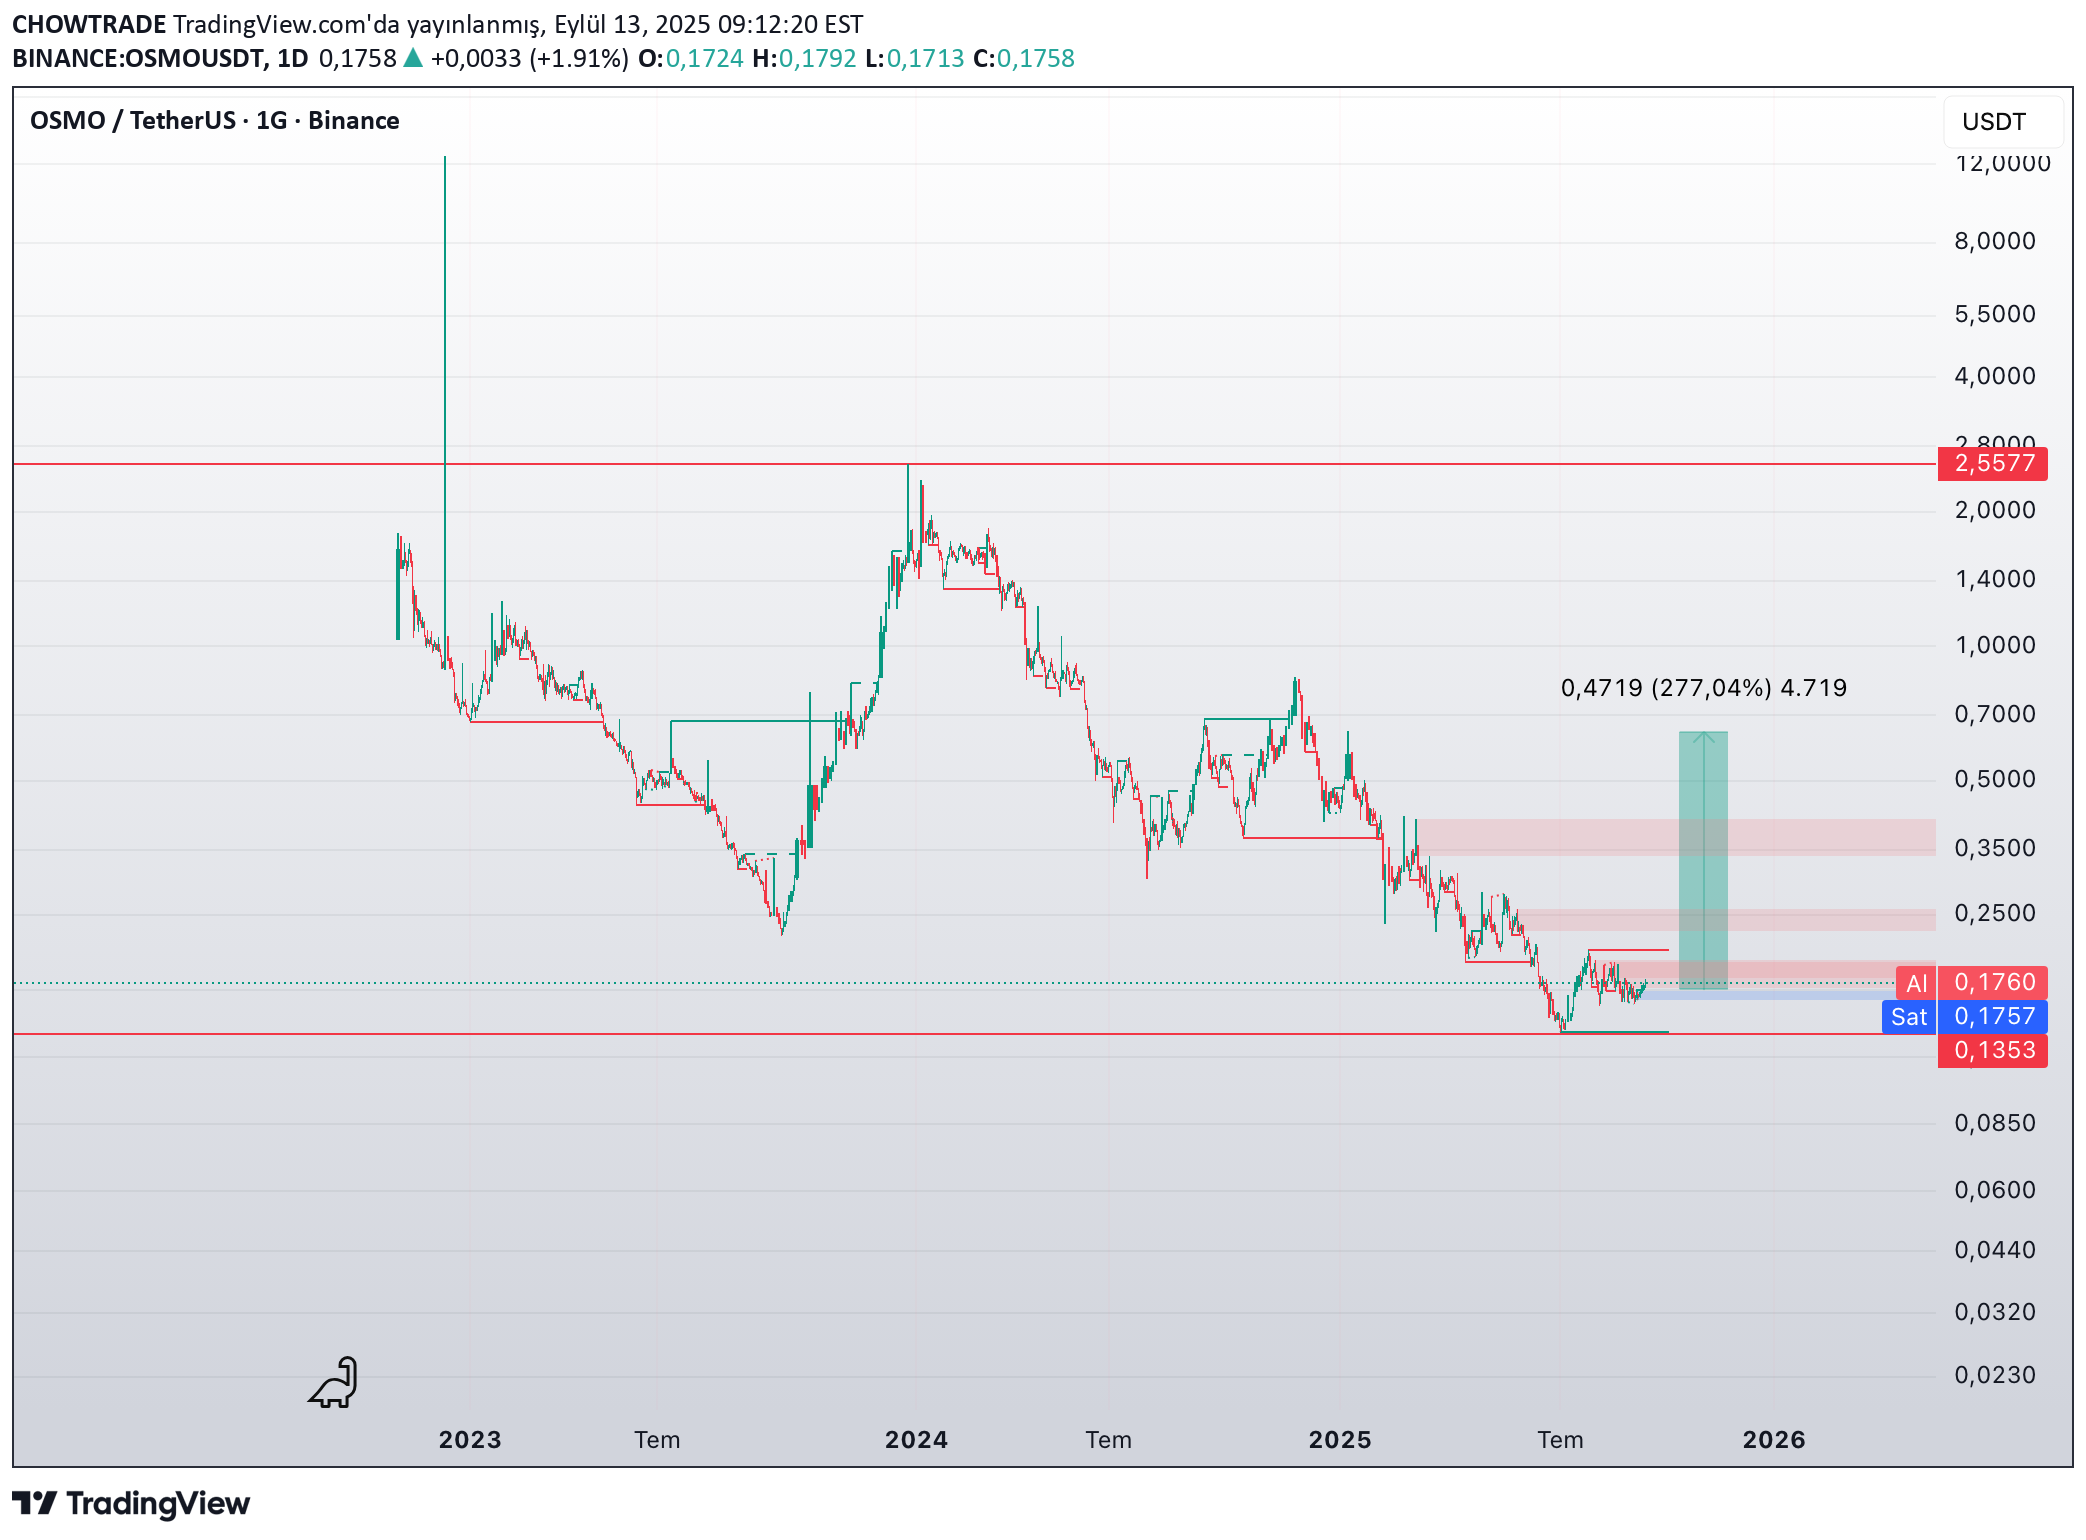
Uzun ve acı verici bir düşüşün ardından, O OSMO sonunda ~$0.135 seviyesinde tarihi bir makro desteğin üzerinde birikim belirtileri göstermeye başladı. 🟢 Teknik analiz: – Güçlü destek seviyesinde net konsolidasyon – Fitillerle görülen reddedilmelerle birlikte yatay birikim aralığı – Hedeflenen hareket: $0.47+ (yaklaşık %277 yukarı potansiyel) 📌 Neden OSMO’ya dikkat edilmeli? – Deflasyonist model: ekip düzenli olarak token yakıyor, bu da toplam arzı azaltıyor – Cosmos’ta kilit rol: Cosmos ekosistemindeki tüm işlemler OSMO üzerinden geçiyor – Daha fazla zincir IBC’ye bağlandıkça, OSMO’ya olan talep de artacak 💡 Piyasa hissiyatı hâlâ sessiz, ancak akıllı para genellikle tam da bu anlarda devreye girer. $0.20–$0.22 bölgesinin üzerindeki kırılım patlayıcı bir ralliye yol açabilir. Bu bir yatırım tavsiyesi değildir — sadece gözlemlerimi paylaşıyorum.
CHOWTRADE
Is $OSMO Ready for a Rebound?
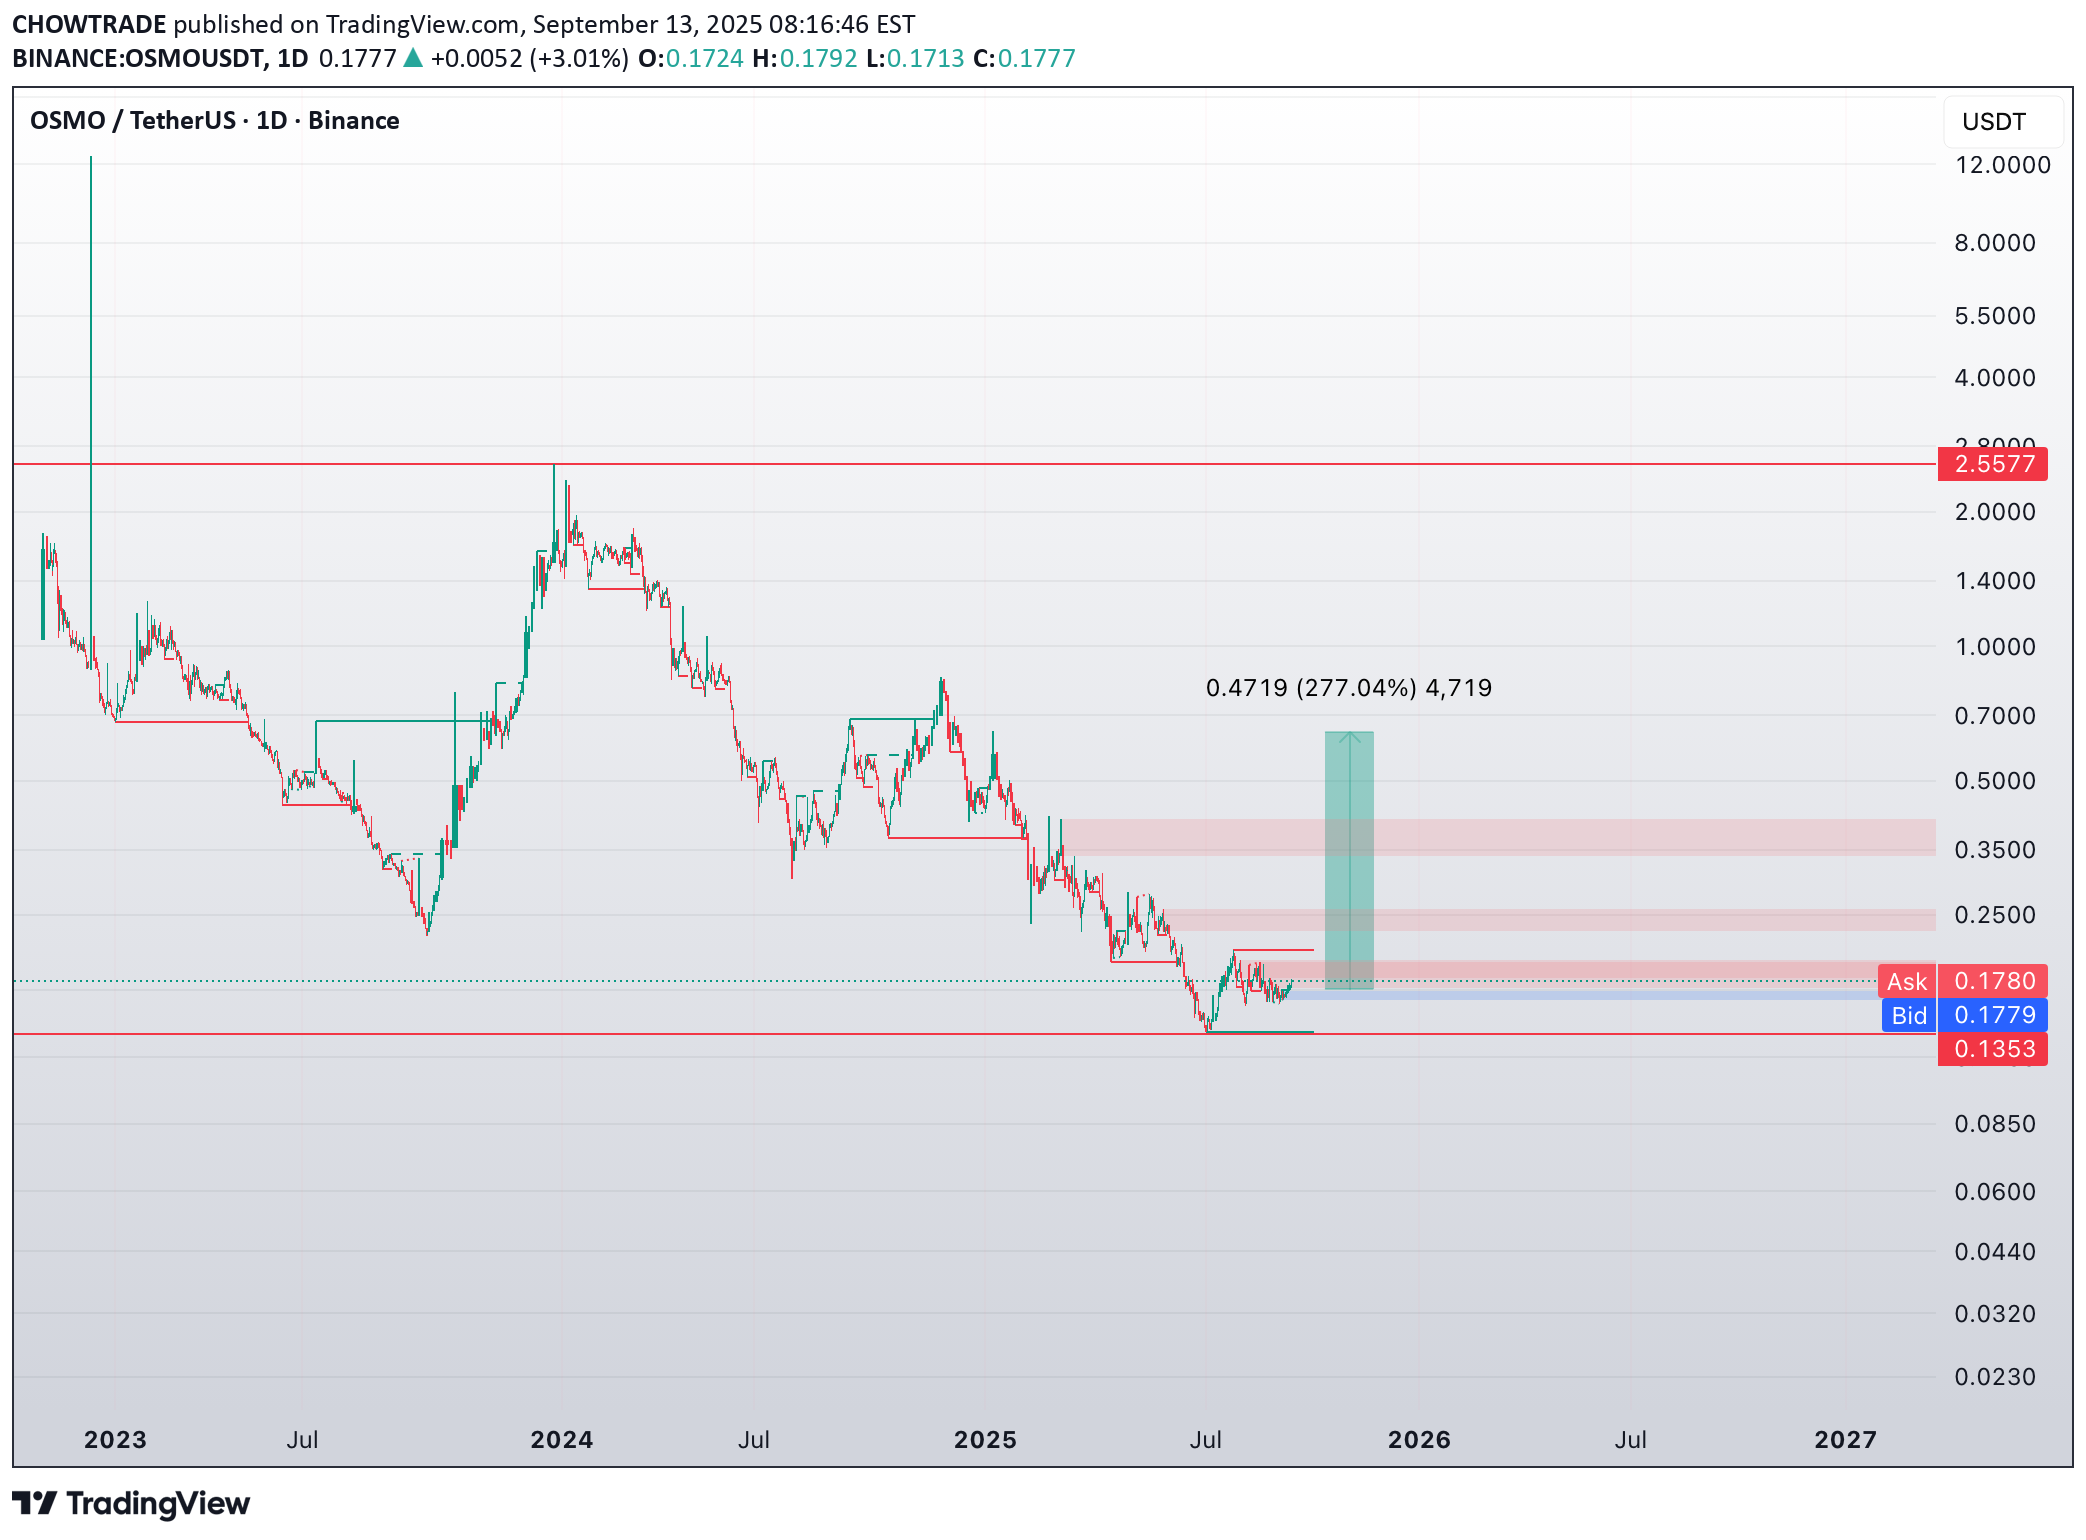
After a long and painful downtrend, O OSMO is finally showing signs of accumulation near key historical support at ~$0.135. 🟢 Technical Setup: – Consolidation near macro support – Clear range formation with strong reaction wicks – Upside target: $0.47+ (≈277% from current levels) 📌 Why OSMO deserves attention: – Deflationary model: the team regularly burns tokens, reducing total supply – Core utility in Cosmos: Every transaction within the Cosmos ecosystem routes through OSMO, giving it massive transactional relevance – As more chains join Cosmos IBC, OSMO’s on-chain activity increases naturally 💡 Sentiment is still quiet, but that’s when smart money positions. If volume steps in and $0.20–$0.22 range gets cleared, this could move fast. Not financial advice — just a setup worth watching.
Alpha-GoldFX
OSMOUSDT Forming Falling Wedge

OSMOUSDT is currently displaying a well-formed falling wedge pattern, a classic bullish reversal signal that often precedes strong upward momentum. This pattern is characterized by a narrowing price range, which reflects decreasing selling pressure and a potential shift in market sentiment. As the wedge tightens, a breakout becomes increasingly likely—especially when accompanied by growing volume and investor interest as seen in the recent OSMOUSDT price action. The falling wedge setup on OSMOUSDT is further supported by a notable uptick in volume, signaling that accumulation may be underway. Historically, falling wedges break to the upside with strong momentum, often leading to rapid price expansion. In this case, the projected upside move is estimated to be in the range of 140% to 150% from current levels. This makes OSMO one of the more attractive breakout candidates in the mid-cap altcoin space, especially for traders seeking high-reward setups. The overall market sentiment around Osmosis has also been increasingly positive, with more eyes turning toward decentralized finance projects and blockchain infrastructure plays. OSMO, being a core player in the Cosmos ecosystem, is well-positioned for strong speculative interest, particularly as its technicals align with favorable chart patterns and renewed on-chain activity. For those tracking breakout patterns and looking to capitalize on explosive moves, OSMOUSDT offers a technically sound and timely opportunity worth serious consideration. ✅ Show your support by hitting the like button and ✅ Leaving a comment below! (What is You opinion about this Coin) Your feedback and engagement keep me inspired to share more insightful market analysis with you!

سیگنال آلفا کریپتو
⚜ $ osmo/USDT 🛒 Purchase range: 0.22 - 0.24 ⚡️Targtes: 🎯t1: 0.26 🎯t2: 0.29 🎯t3: 0.32 🎯T4: 0.37 🎯T5: 0.44 🎯t6: 0.54 🔺️ Loss limit: 0.20 💵 Suggested Balance: 5 % Capital 🔥 @signal_alpha 🔥

Nyskohuz
OSMO/USDT 1W

🌱 O OSMO ⁀➷ #Osmosis. Macro chart Another 🌴 Intermediate Target - $2.80 🍃 Macro Target 1 - $4.93 🍃 Macro Target 2 - $10.50 🍃 Macro Target 3 - $20.54 - Not financial advice, trade with caution. #Crypto #Osmosis #OSMO #Investment ✅ Stay updated on market news and developments that may influence the price of Osmosis. Positive or negative news can significantly impact the cryptocurrency's value. ✅ Exercise patience and discipline when executing your trading plan. Avoid making impulsive decisions driven by emotions, and adhere to your strategy even during periods of market volatility. ✅ Remember that trading always involves risk, and there are no guarantees of profit. Conduct thorough research, analyze market conditions, and be prepared for various scenarios. Trade only with funds you can afford to lose and avoid excessive risk-taking.

stanleycrypto_1
$OSMO just broke out

OOSMO just broke out! 🚀Falling wedge breakout confirmed on the daily chart with strong volume. The Price is now above the key resistance 50ema.Target: $0.5671 (+230%)Momentum is building — this could be the start of something big!

aliaezaaz
OSMOUSDT Trade Setup (92% Long Probability Printed on the Chart)

Market Structure The probability algorithm has printed 92% Long Probability the Chart coupled with RSI and trend breakout. Price has been moving in a downward channel, indicating a longer‑term downtrend. However, there may be signs of a potential base forming near the lower boundary of the channel. The recent price action around the 0.30–0.31 region could be an attempt to stabilize or stage a bounce. Entry Entry at CMP: Enter a long position around the current market price (near 0.30). Stop Loss Place your stop loss below the recent swing low or below the lower boundary of the channel to protect against a false breakout or further downside. For instance, a stop loss around 0.26–0.27 provides a buffer below the local lows. Adjust slightly based on your risk tolerance. Take Profit Targets Because the market has been trending downward, it’s wise to scale out of the position at multiple targets. This way, you can lock in gains if the bounce remains limited, while still benefiting if the trend truly reverses. Target 1: 0.34–0.35 (near the midline of the descending channel or a prior support/resistance zone). Target 2: 0.38–0.40 (a stronger resistance area from earlier consolidation). Target 3: 0.45+ (if price shows significant strength and breaks above the upper channel boundary). Trade Management Position Sizing: Use a position size that keeps your account risk manageable—many traders risk no more than 1–2% of their capital on a single trade. Adjusting the Stop: If price moves favorably and breaks above short‑term resistance, consider moving your stop loss to breakeven or just below a new higher low. Partial Profit‑Taking: Take partial profits at each target level and move your stop loss to secure gains.

CryptoNicho
#OSMO/USDT - Long - Potential 38.91%

Strategy: Long• Exchange: BINANCE• Account: Spot• Entry mode: Market order in range• Invest: 5%• Exit:• ⎿ Target 2 : 0.8389 40.14%• ⎿ Target 1 : 0.6468 8.05%• Entry: 0.5986 ⌁ 0.5986• ⎿ Current market price: 0.5982• Stop: 0.5181 (-13.45%) • Technical indicators:Break of 50 & 200 day moving averages confirmed with volume. Trend change confirmed.• ⎿ 24h Volume: 31361338.043413• ⎿ Satoshis: 0.5986• ⎿ Analysis: TradingView
Disclaimer
Any content and materials included in Sahmeto's website and official communication channels are a compilation of personal opinions and analyses and are not binding. They do not constitute any recommendation for buying, selling, entering or exiting the stock market and cryptocurrency market. Also, all news and analyses included in the website and channels are merely republished information from official and unofficial domestic and foreign sources, and it is obvious that users of the said content are responsible for following up and ensuring the authenticity and accuracy of the materials. Therefore, while disclaiming responsibility, it is declared that the responsibility for any decision-making, action, and potential profit and loss in the capital market and cryptocurrency market lies with the trader.