
OMNI
Omni Network
| تریدر | نوع سیگنال | حد سود/ضرر | زمان انتشار | مشاهده پیام |
|---|---|---|---|---|
No results found. | ||||
Price Chart of Omni Network
سود 3 Months :
سیگنالهای Omni Network
Filter
Sort messages by
Trader Type
Time Frame

Bithereum_io
OMNIUSDT 1D
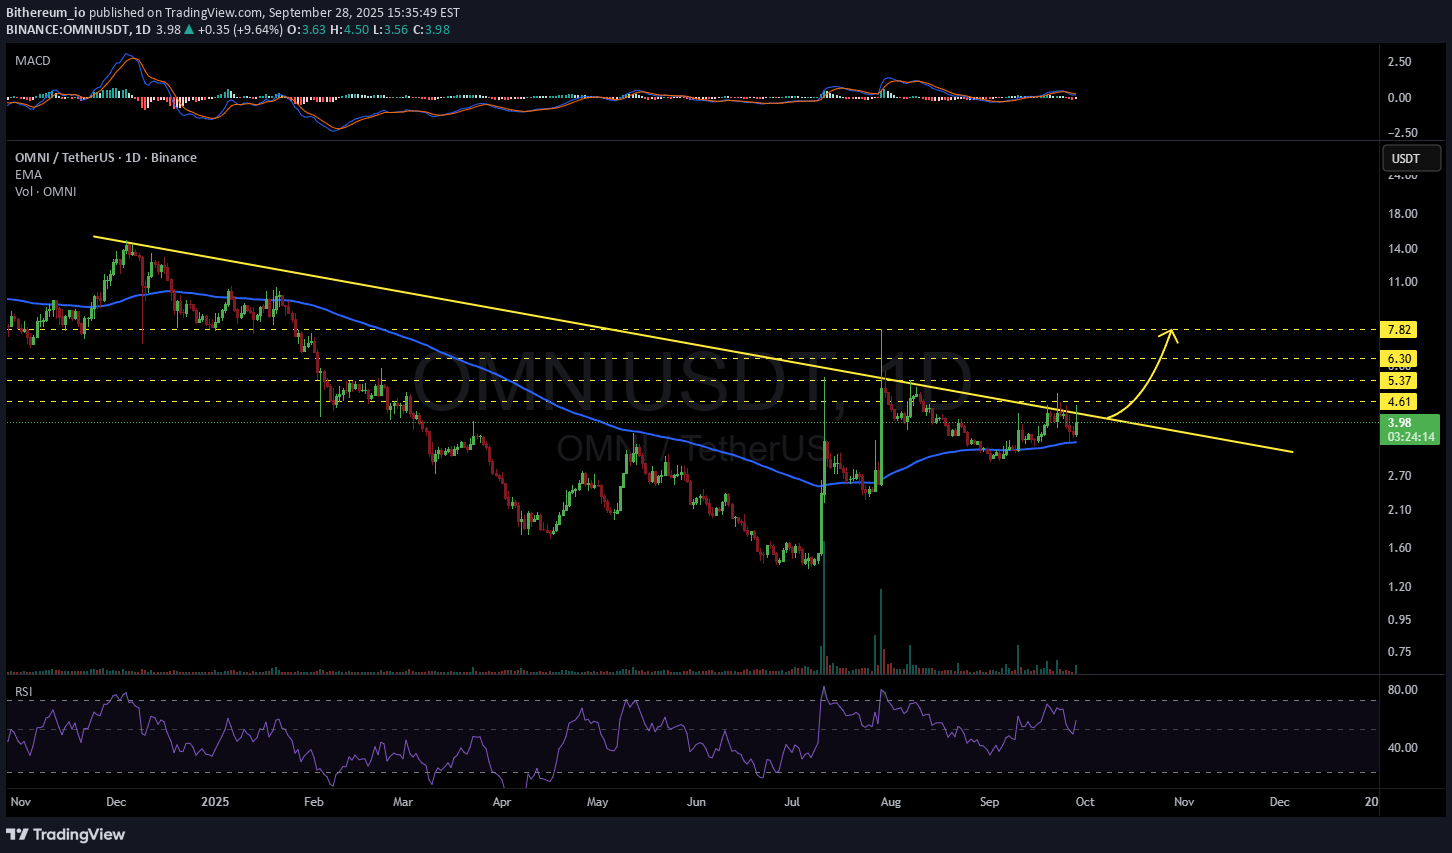
#OMNI is pressing the long-term descending line on the daily chart. In case of a breakout above it, the potential targets are: 🎯 $4.61 🎯 $5.37 🎯 $6.30 🎯 $7.82 ⚠️ Always remember to use a tight stop-loss and follow proper risk management.

Alpha-GoldFX
OMNIUSDT Forming Bullish Wave
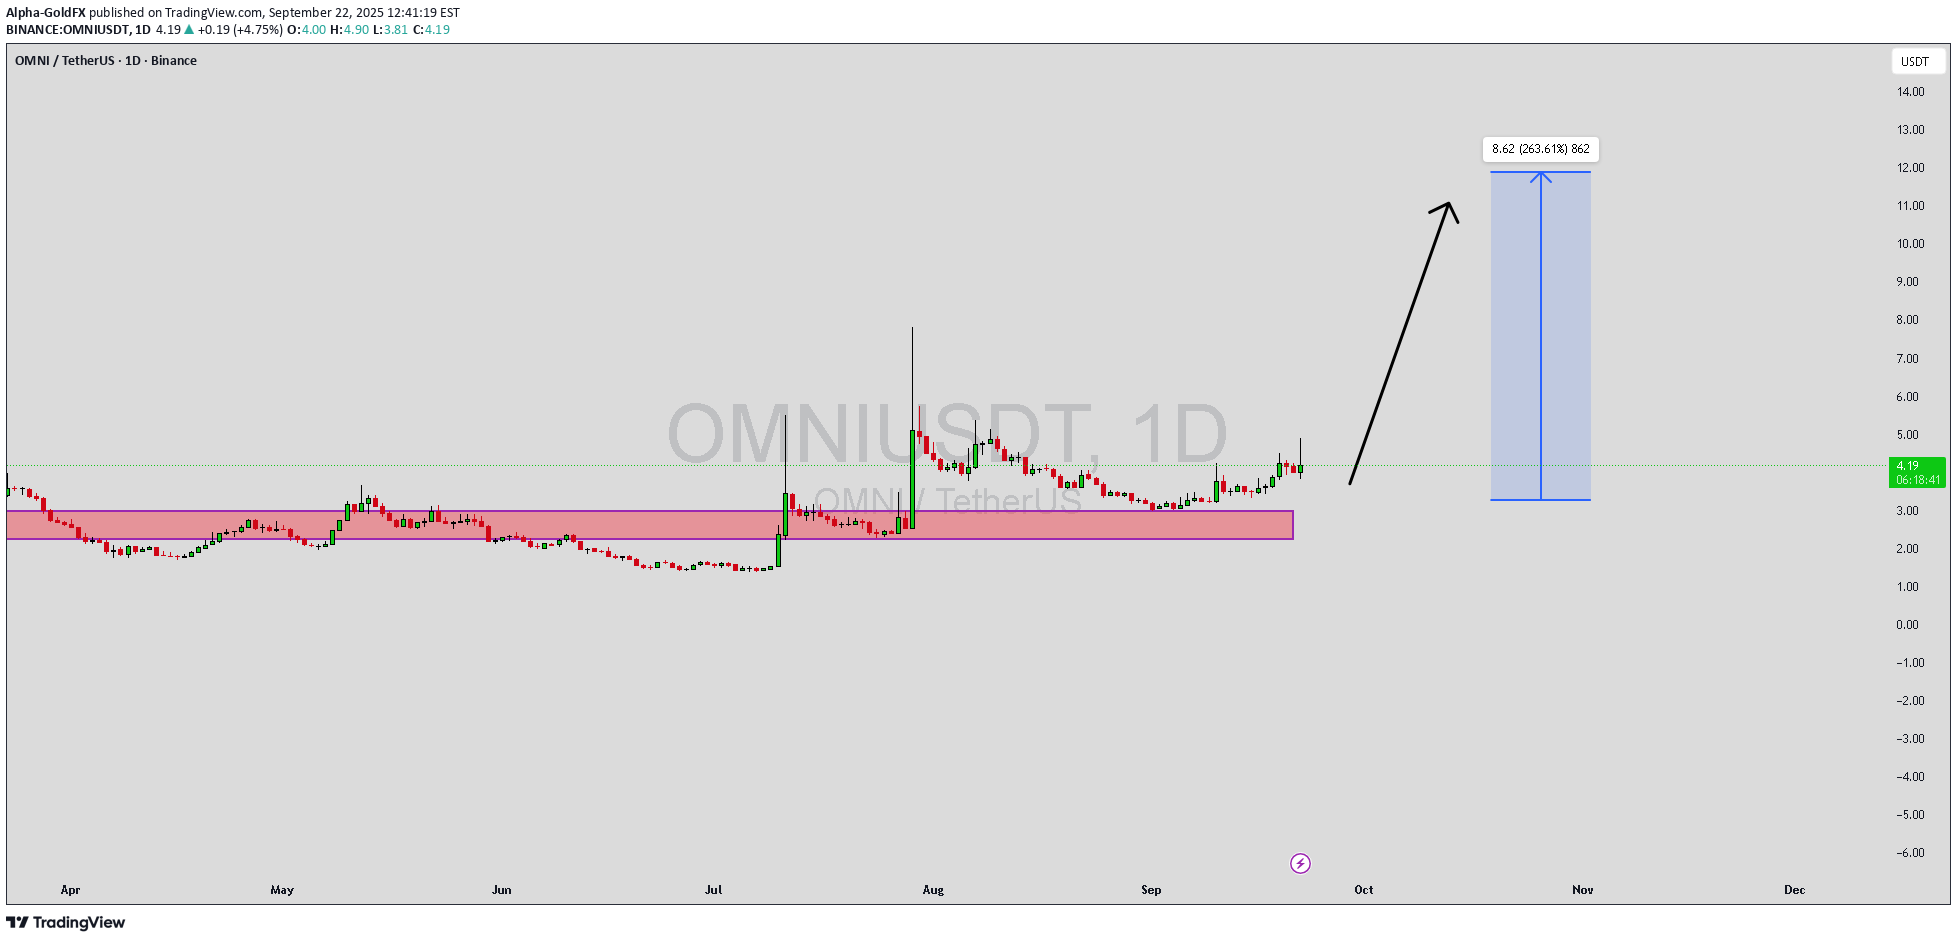
OMNIUSDT is currently forming a bullish wave pattern, which is often seen as a strong technical setup for large upside potential. This type of pattern typically reflects accumulation phases followed by impulsive upward movements, signaling strong participation from buyers. With the current chart structure, OMNIUSDT shows clear momentum building, and the outlook suggests that it could deliver an impressive gain of 190% to 200%+ if the breakout sustains. Trading volume remains solid, which reinforces the bullish case. Healthy volume during a wave pattern is crucial because it validates the price action and shows that market participants are actively positioning themselves for the next big move. As long as volume stays consistent, OMNIUSDT has the foundation to extend its rally and attract further investor confidence. Market sentiment has been increasingly optimistic, with more traders and investors showing interest in this project. Bullish wave patterns often invite both short-term traders and long-term investors to take advantage of significant price swings. With technical momentum aligning with growing investor attention, OMNIUSDT could become one of the more exciting opportunities in the market right now. ✅ Show your support by hitting the like button and ✅ Leaving a comment below! (What is You opinion about this Coin) Your feedback and engagement keep me inspired to share more insightful market analysis with you!

Captain-MAO
OMNI/USDT - Bottom Formation & Reversal
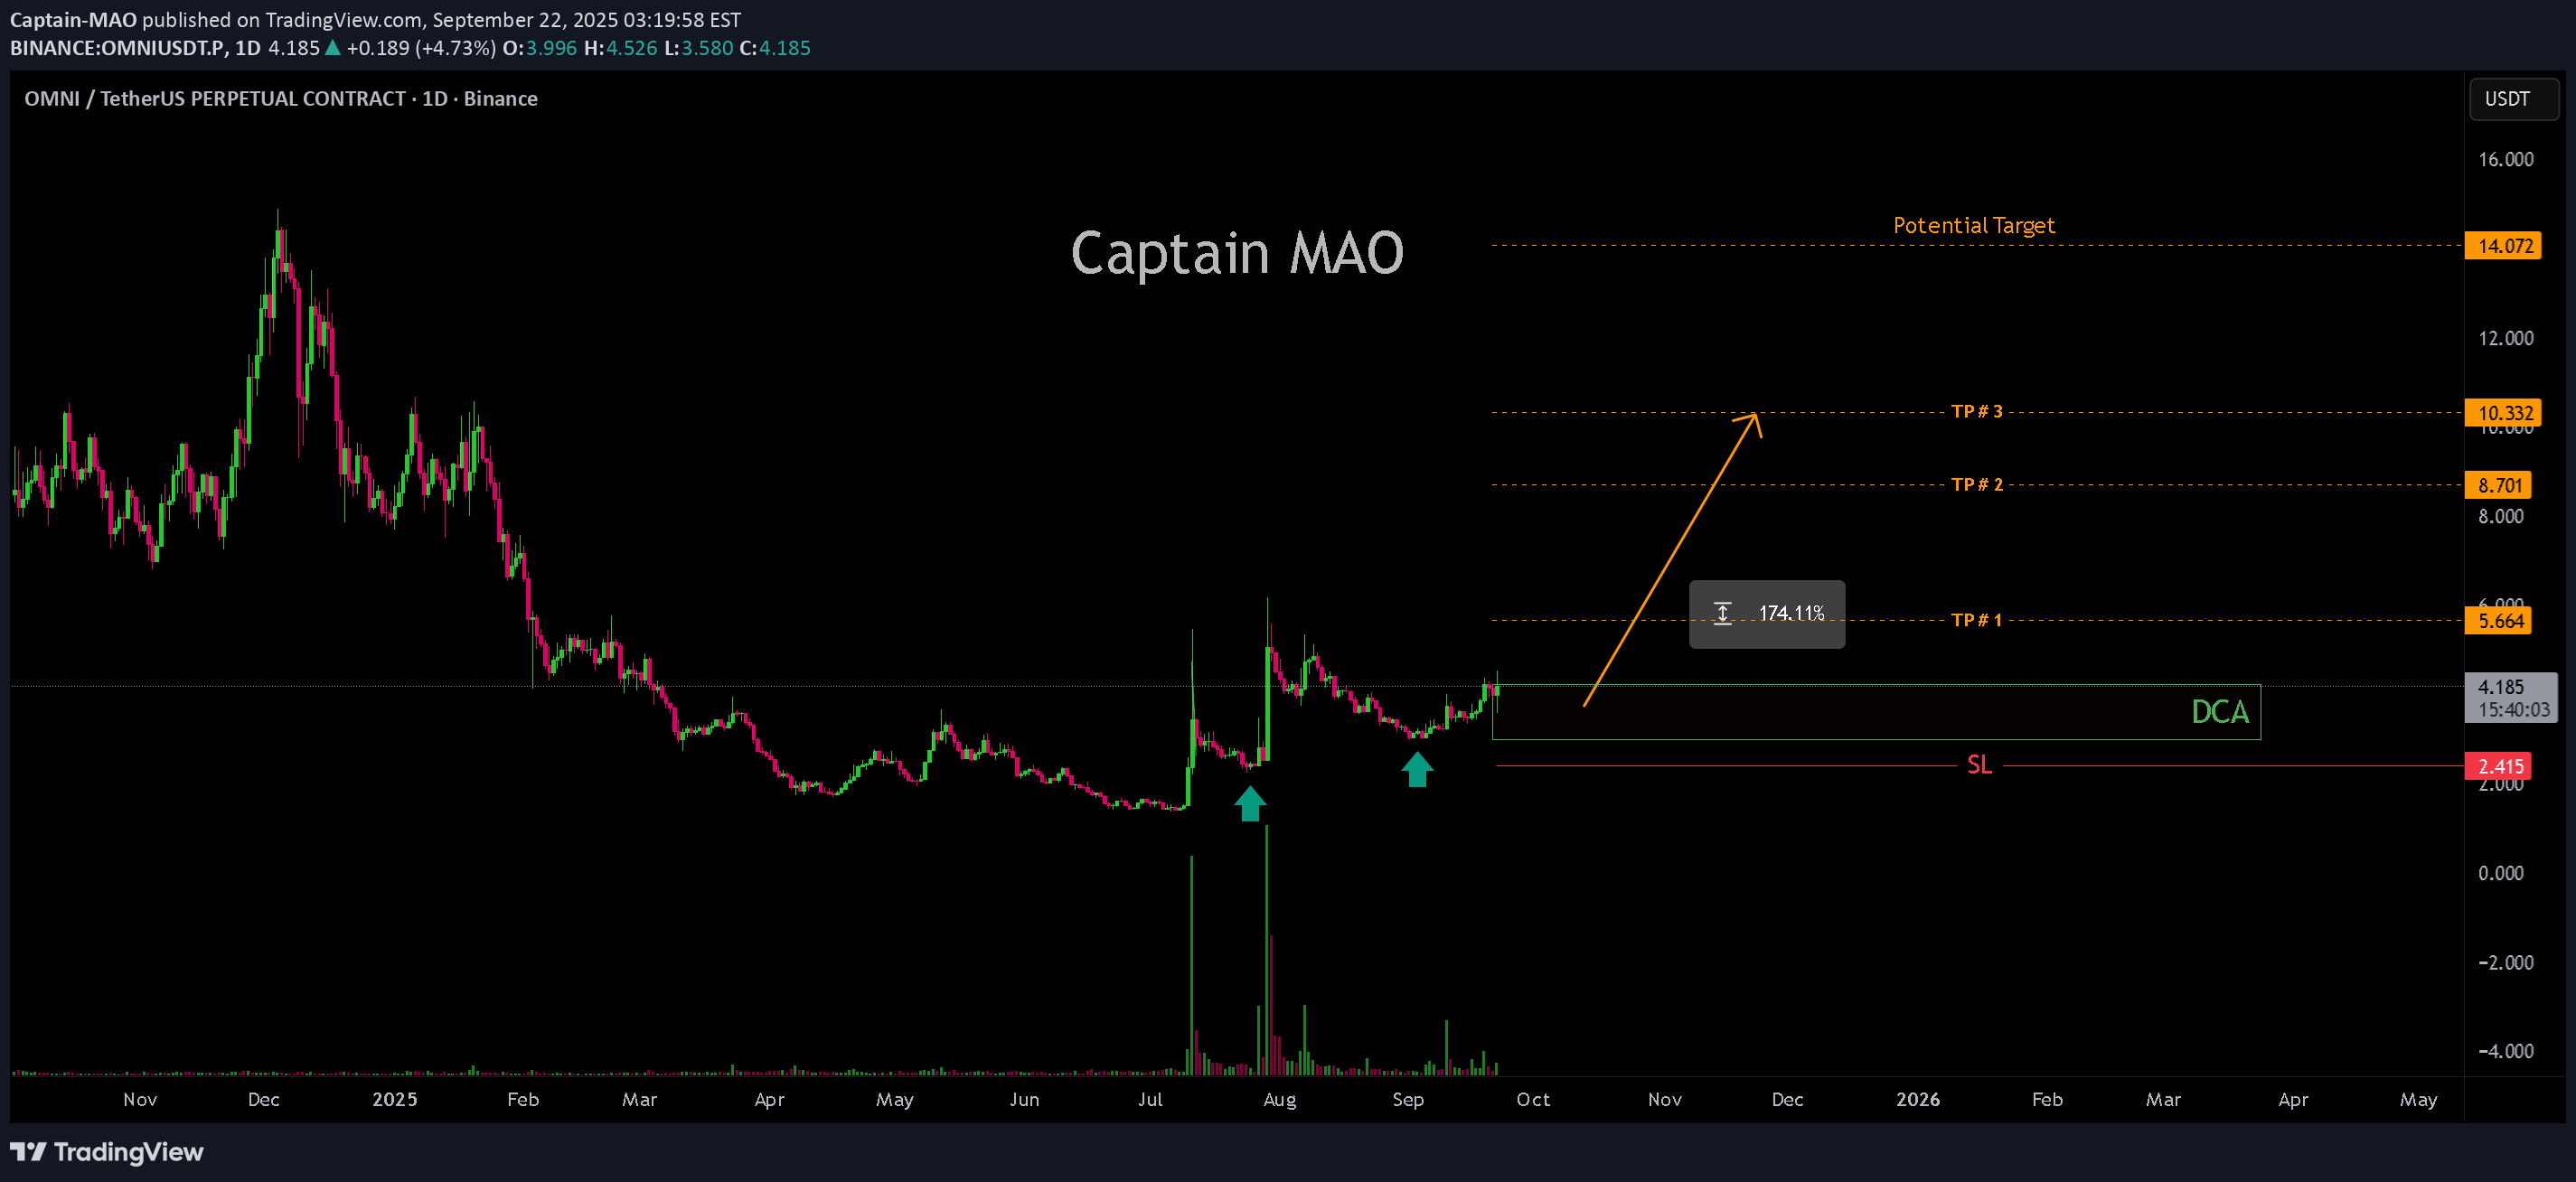
Over the past two months, OMNI/USDT has been building and forming a solid structure, with recent price action showing signs of accumulation. A series of aggressive pushes from whales indicates that the bottom is likely in, and a prolonged downtrend may be coming to an end.

unichartz
OMNI: On the Brink of a Breakout
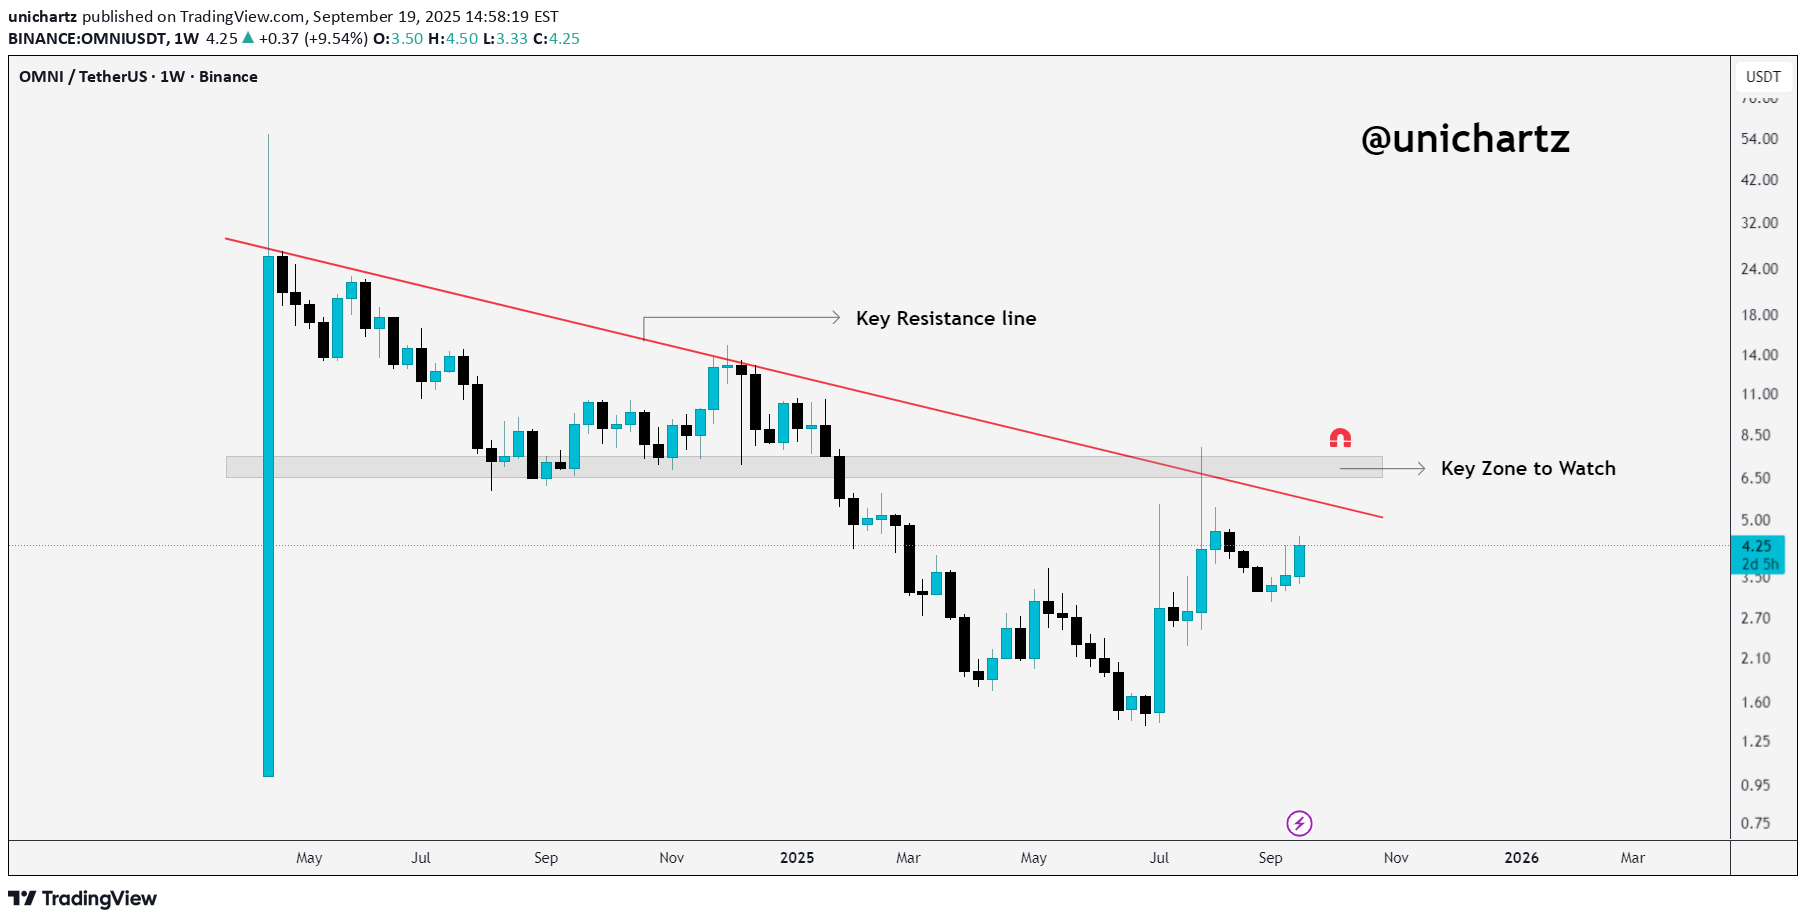
O OMNI/USDT is still a good distance from the key resistance line, but it's approaching an important zone around $4.25. If the price can break through and hold this level, we could see further bullish movement. However, if it struggles at this level, a pullback or consolidation might follow. Keep an eye on how it reacts as it gets closer to that resistance. DYOR, NFA #PEACE
Alpha-GoldFX
OMNIUSDT Forming Bullish Wave
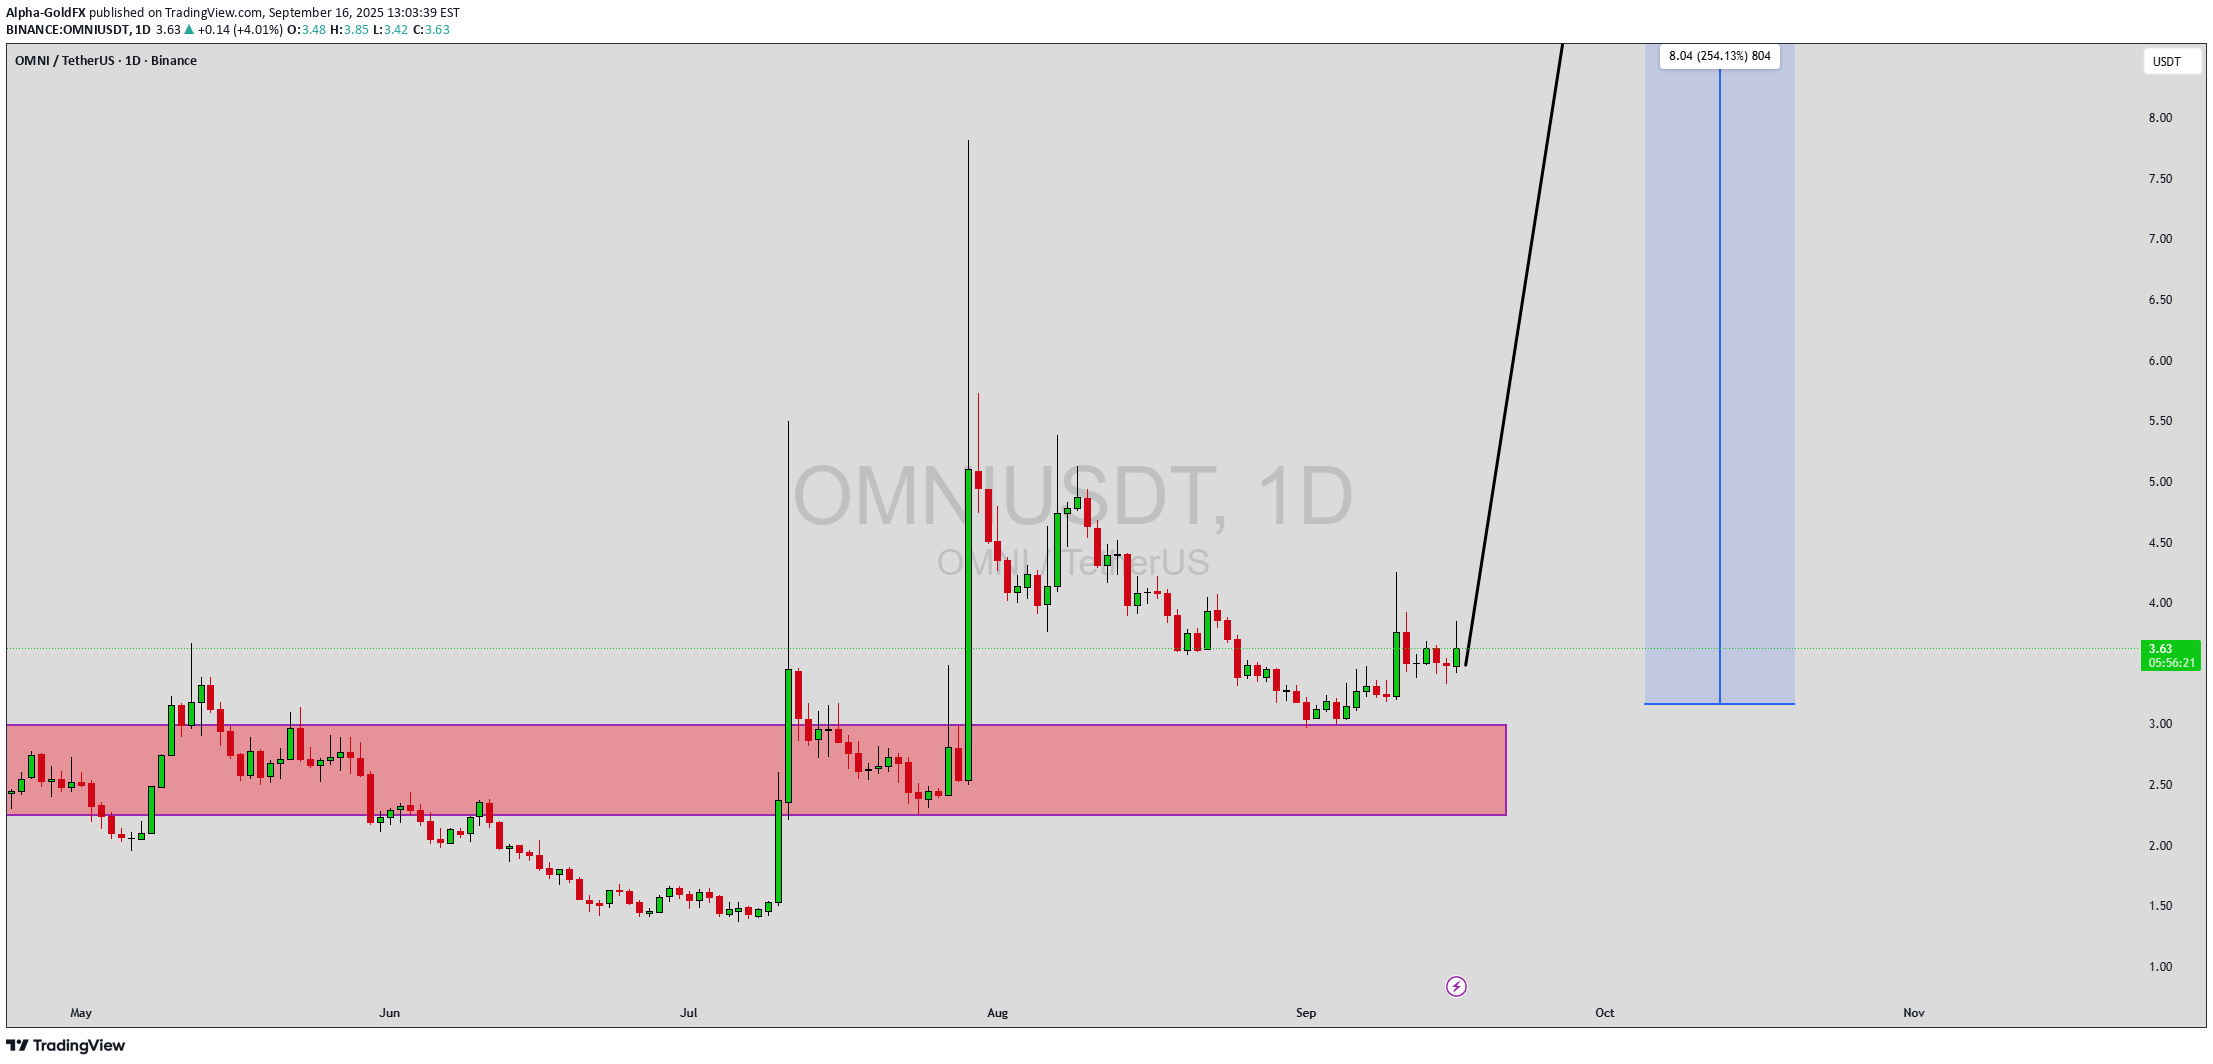
OMNIUSDT has formed a bullish wave pattern that signals strong upward momentum building in the market. After a period of consolidation, the price is now showing signs of recovery with increasing volume, suggesting that buyers are stepping back in with confidence. This technical setup indicates the potential for a major bullish rally, with expectations of a 140% to 150%+ gain if momentum continues to strengthen in favor of the bulls. The bullish wave pattern is often a precursor to significant upward price action, as it reflects strong accumulation and renewed investor optimism. With OMNIUSDT trading at favorable levels, the current chart structure suggests that the next wave could push the price towards higher resistance zones. Such a breakout would likely draw more attention from traders, fueling additional demand and extending the rally. Investor interest in OMNIUSDT is on the rise, and the steady increase in trading activity reinforces the positive outlook. If market sentiment remains aligned with technical signals, OMNIUSDT could outperform many other altcoins in the near term, making it an attractive choice for traders seeking high-percentage gains. The combination of volume support, wave structure, and renewed investor participation makes this setup one to closely watch. ✅ Show your support by hitting the like button and ✅ Leaving a comment below! (What is You opinion about this Coin) Your feedback and engagement keep me inspired to share more insightful market analysis with you!

CryptoWithJames
OMNIUSDT UPDATE
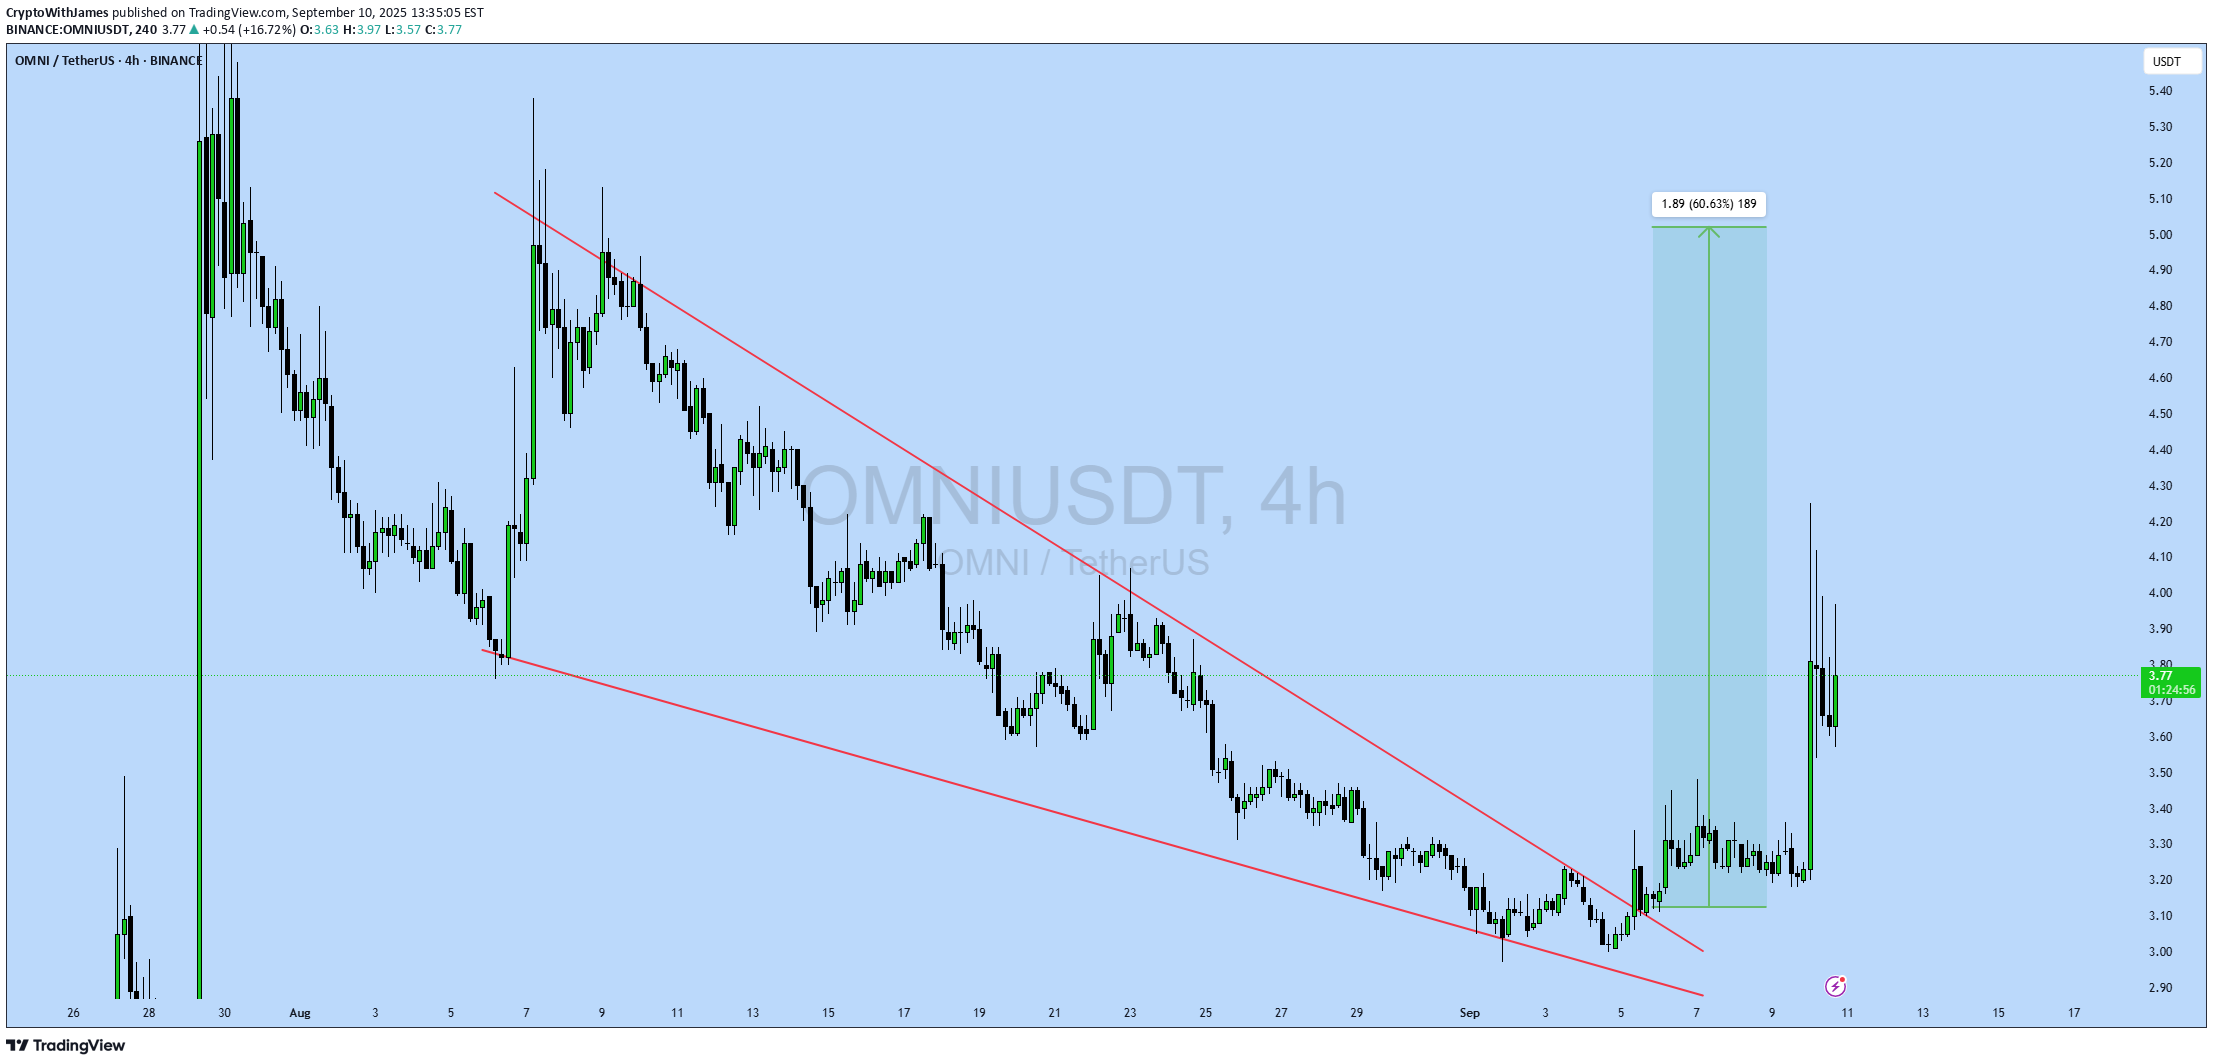
#OMNI UPDATE OMNI Technical Setup Pattern : Bullish Falling Wedge Pattern Current Price: $3.17 Target Price: $5.06 Target % Gain: 60.63% Technical Analysis: OMNI is breaking out of a falling wedge on the 4H chart, confirming a bullish reversal setup. Increased momentum near support and breakout confirmation suggest upside continuation toward $5.06. Time Frame: 4H Risk Management Tip: Always use proper risk management.
Alpha-GoldFX
OMNIUSDT Forming Bullish Wave
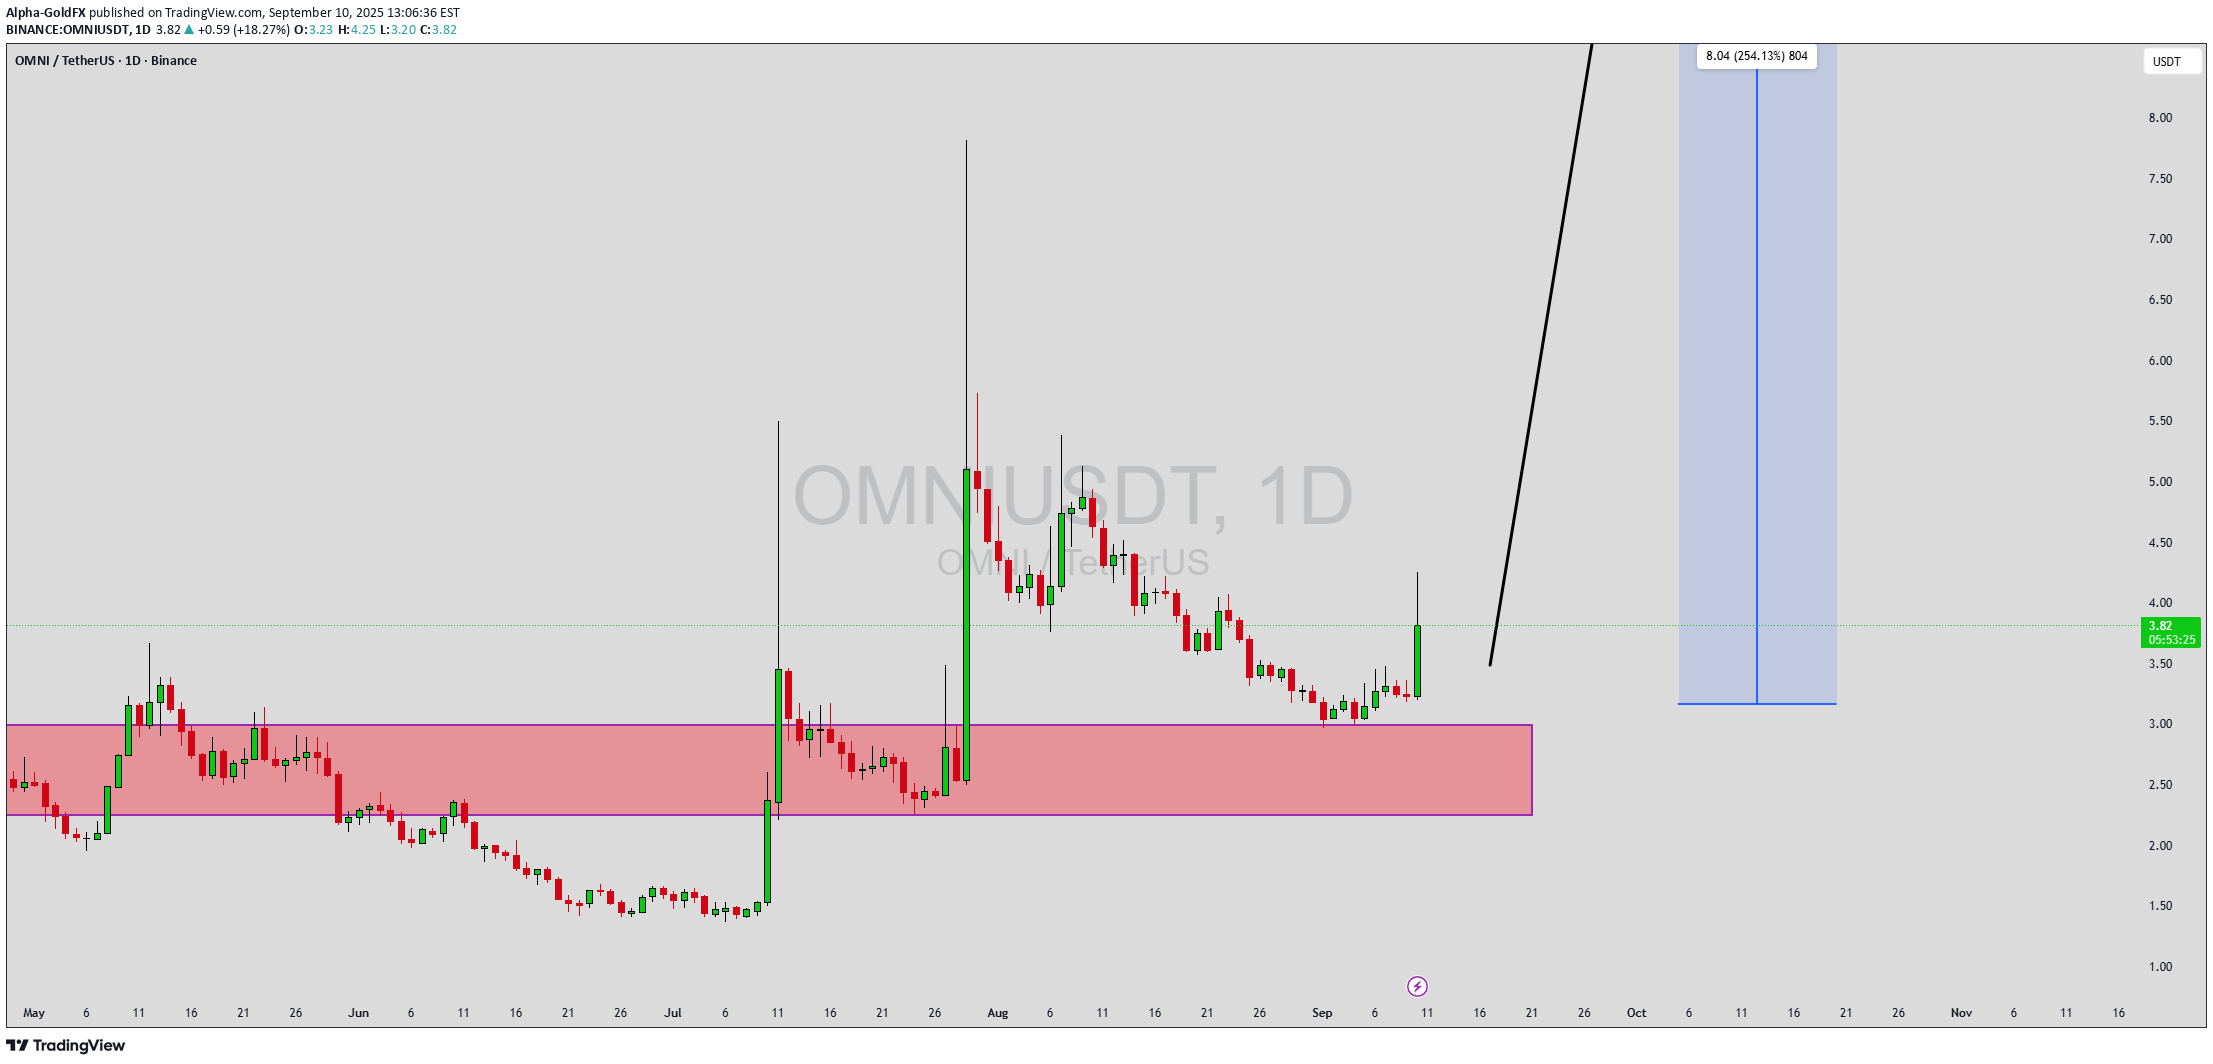
OMNIUSDT has formed a bullish wave pattern that signals strong upward momentum building in the market. After a period of consolidation, the price is now showing signs of recovery with increasing volume, suggesting that buyers are stepping back in with confidence. This technical setup indicates the potential for a major bullish rally, with expectations of a 140% to 150%+ gain if momentum continues to strengthen in favor of the bulls. The bullish wave pattern is often a precursor to significant upward price action, as it reflects strong accumulation and renewed investor optimism. With OMNIUSDT trading at favorable levels, the current chart structure suggests that the next wave could push the price towards higher resistance zones. Such a breakout would likely draw more attention from traders, fueling additional demand and extending the rally. Investor interest in OMNIUSDT is on the rise, and the steady increase in trading activity reinforces the positive outlook. If market sentiment remains aligned with technical signals, OMNIUSDT could outperform many other altcoins in the near term, making it an attractive choice for traders seeking high-percentage gains. The combination of volume support, wave structure, and renewed investor participation makes this setup one to closely watch. ✅ Show your support by hitting the like button and ✅ Leaving a comment below! (What is You opinion about this Coin) Your feedback and engagement keep me inspired to share more insightful market analysis with you!
Alpha-GoldFX
OMNIUSDT Forming Bullish Wave
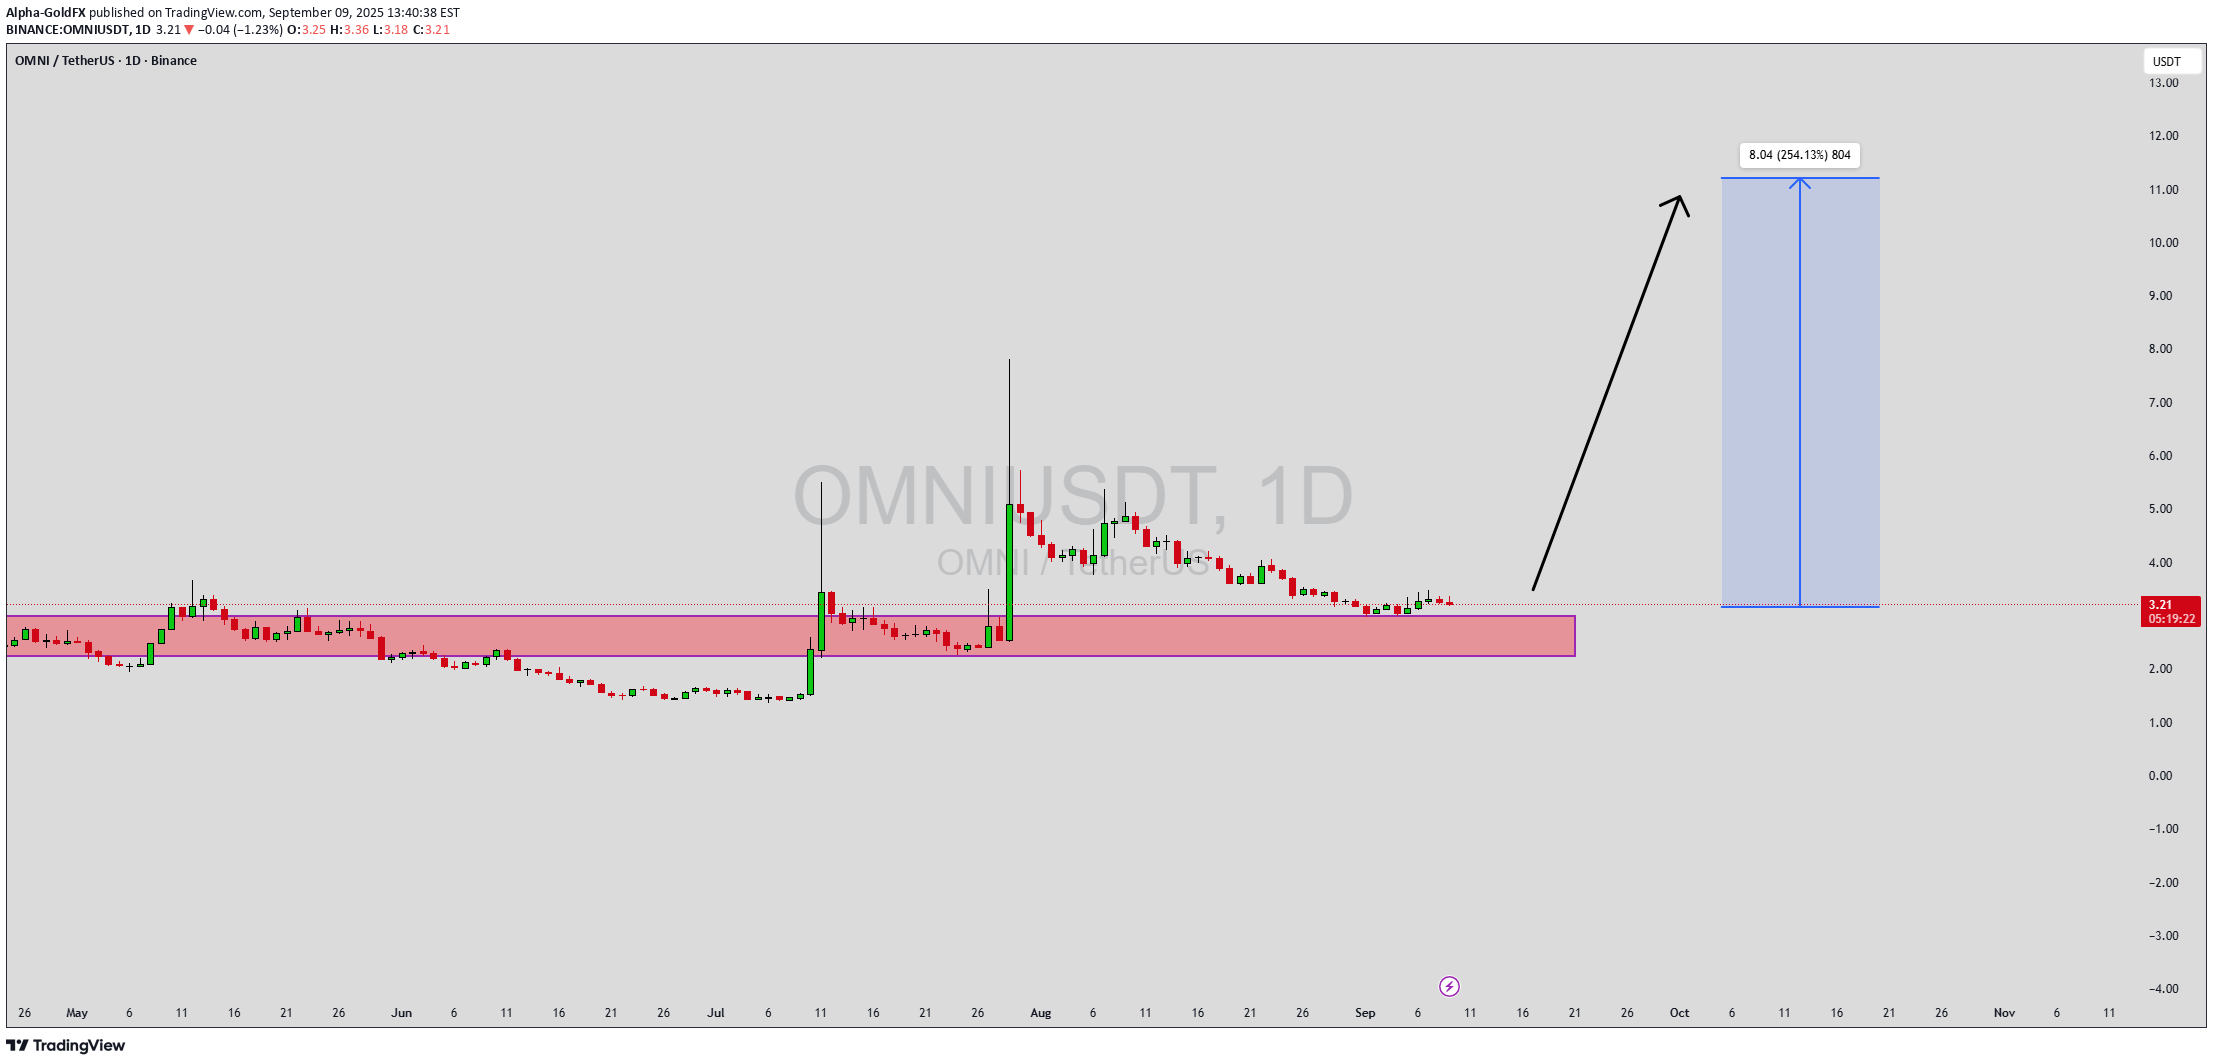
OMNIUSDT has formed a bullish wave pattern that signals strong upward momentum building in the market. After a period of consolidation, the price is now showing signs of recovery with increasing volume, suggesting that buyers are stepping back in with confidence. This technical setup indicates the potential for a major bullish rally, with expectations of a 140% to 150%+ gain if momentum continues to strengthen in favor of the bulls. The bullish wave pattern is often a precursor to significant upward price action, as it reflects strong accumulation and renewed investor optimism. With OMNIUSDT trading at favorable levels, the current chart structure suggests that the next wave could push the price towards higher resistance zones. Such a breakout would likely draw more attention from traders, fueling additional demand and extending the rally. Investor interest in OMNIUSDT is on the rise, and the steady increase in trading activity reinforces the positive outlook. If market sentiment remains aligned with technical signals, OMNIUSDT could outperform many other altcoins in the near term, making it an attractive choice for traders seeking high-percentage gains. The combination of volume support, wave structure, and renewed investor participation makes this setup one to closely watch. ✅ Show your support by hitting the like button and ✅ Leaving a comment below! (What is You opinion about this Coin) Your feedback and engagement keep me inspired to share more insightful market analysis with you!

MrHans08
OMNI ready to take off?!
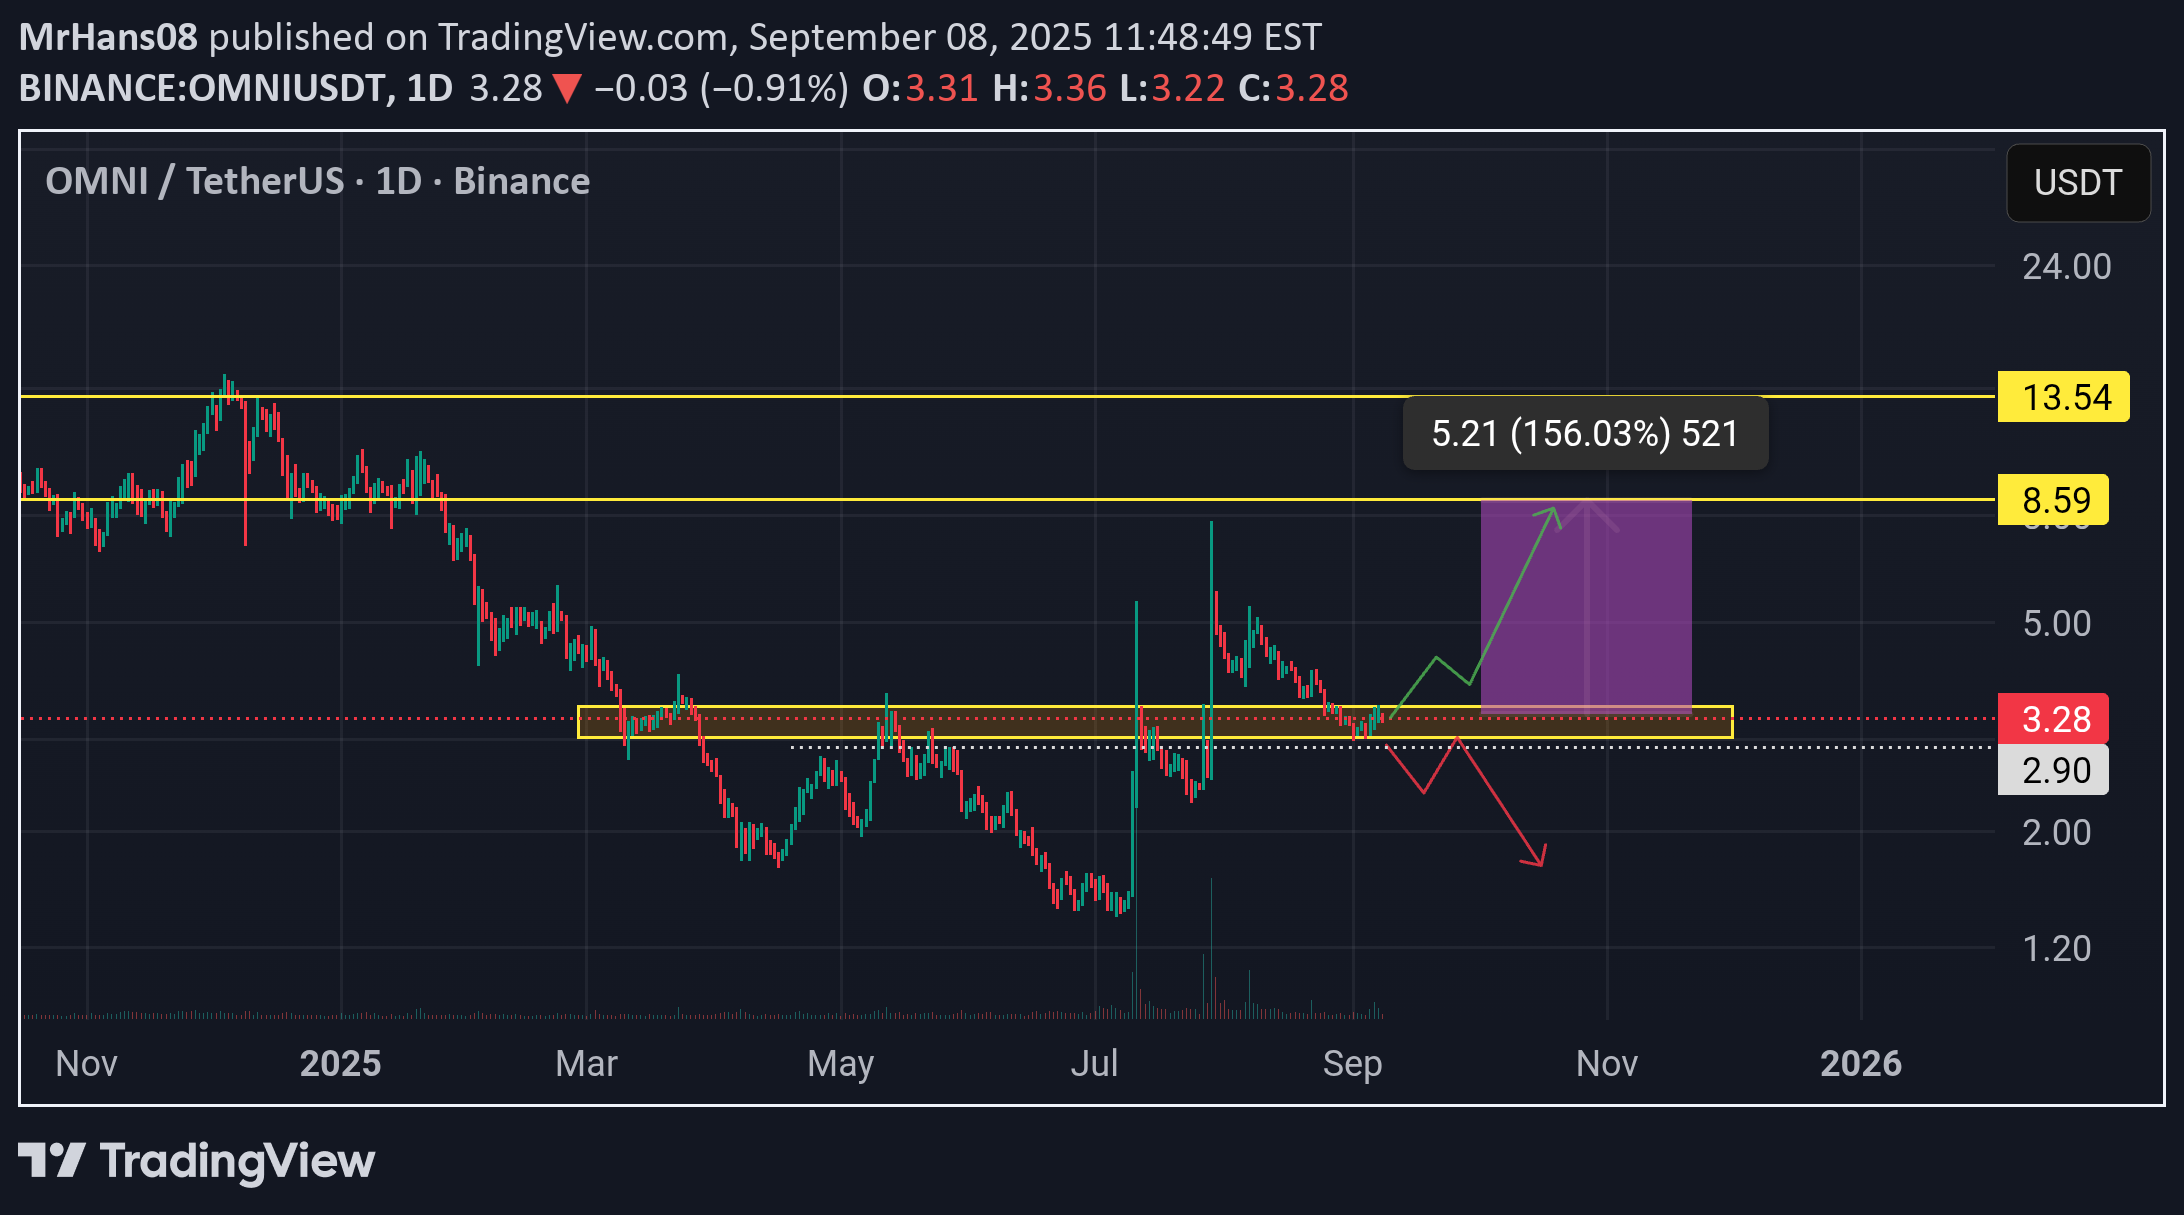
🔥 OMNI looks ready to take off! Currently sitting on a strong support zone — perfect entry with an ideal risk-to-reward setup. 🚀 🎯 Target upside: next resistance around $8.59, offering a potential gain of +156%. ❌ Setup becomes invalid if price breaks below the yellow support or $2.90 — use it as your stop-loss reference. Good luck & trade safe! 📈✨

bakbak88
omni forming triangle, another rocket & short squeeze counter
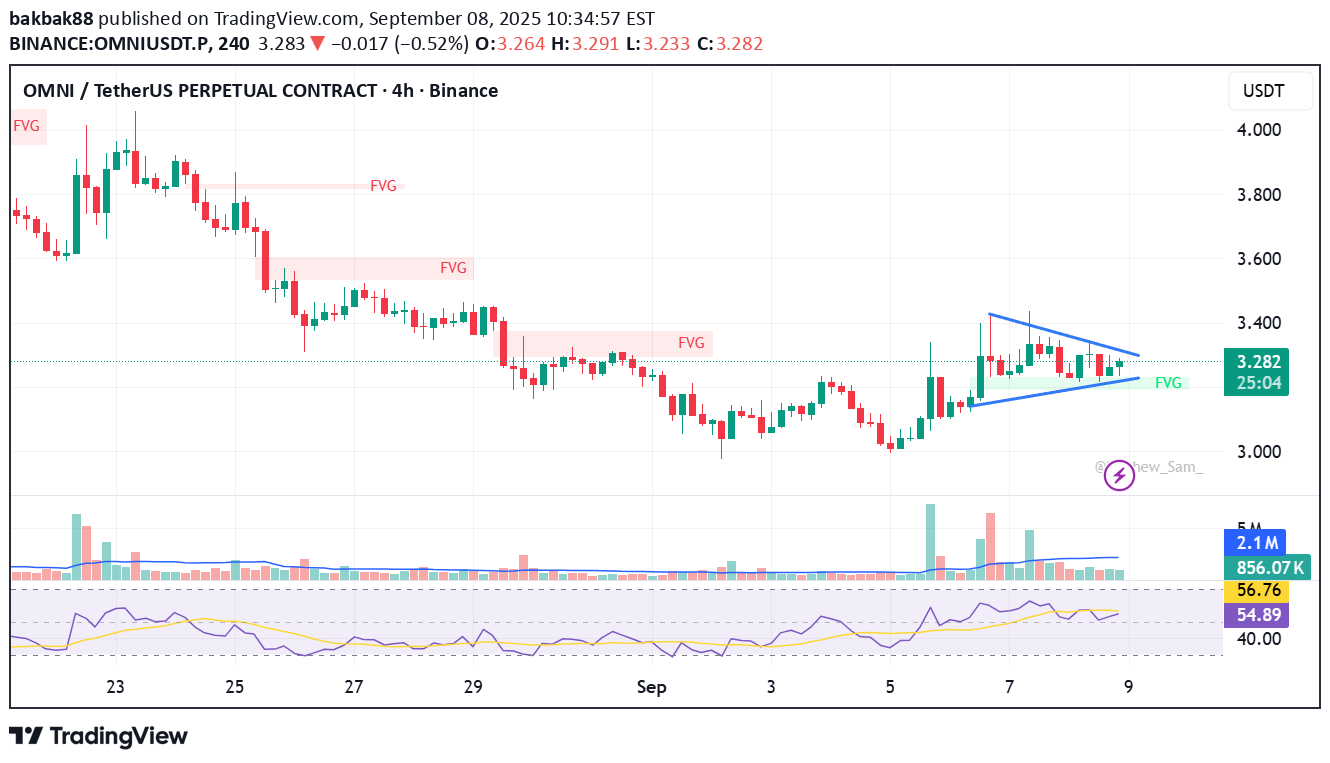
omni is forming symmetrical triangle in 4hr tf. look good on charging the power based on daily tf, this is the potential bonker. confluence with negative fund rate, positive delta, negative cvd and increase oi, this is one of potential candidate for short squeeze. 12am soon, and market is going to settle fund rate. watch out and monitor it closely. sl can put at 3.156
Disclaimer
Any content and materials included in Sahmeto's website and official communication channels are a compilation of personal opinions and analyses and are not binding. They do not constitute any recommendation for buying, selling, entering or exiting the stock market and cryptocurrency market. Also, all news and analyses included in the website and channels are merely republished information from official and unofficial domestic and foreign sources, and it is obvious that users of the said content are responsible for following up and ensuring the authenticity and accuracy of the materials. Therefore, while disclaiming responsibility, it is declared that the responsibility for any decision-making, action, and potential profit and loss in the capital market and cryptocurrency market lies with the trader.