
NEIRO
Neiro (First Neiro On Ethereum)
| تریدر | نوع سیگنال | حد سود/ضرر | زمان انتشار | مشاهده پیام |
|---|---|---|---|---|
No results found. | ||||
Price Chart of Neiro (First Neiro On Ethereum)
سود 3 Months :
سیگنالهای Neiro (First Neiro On Ethereum)
Filter
Sort messages by
Trader Type
Time Frame

asilturk
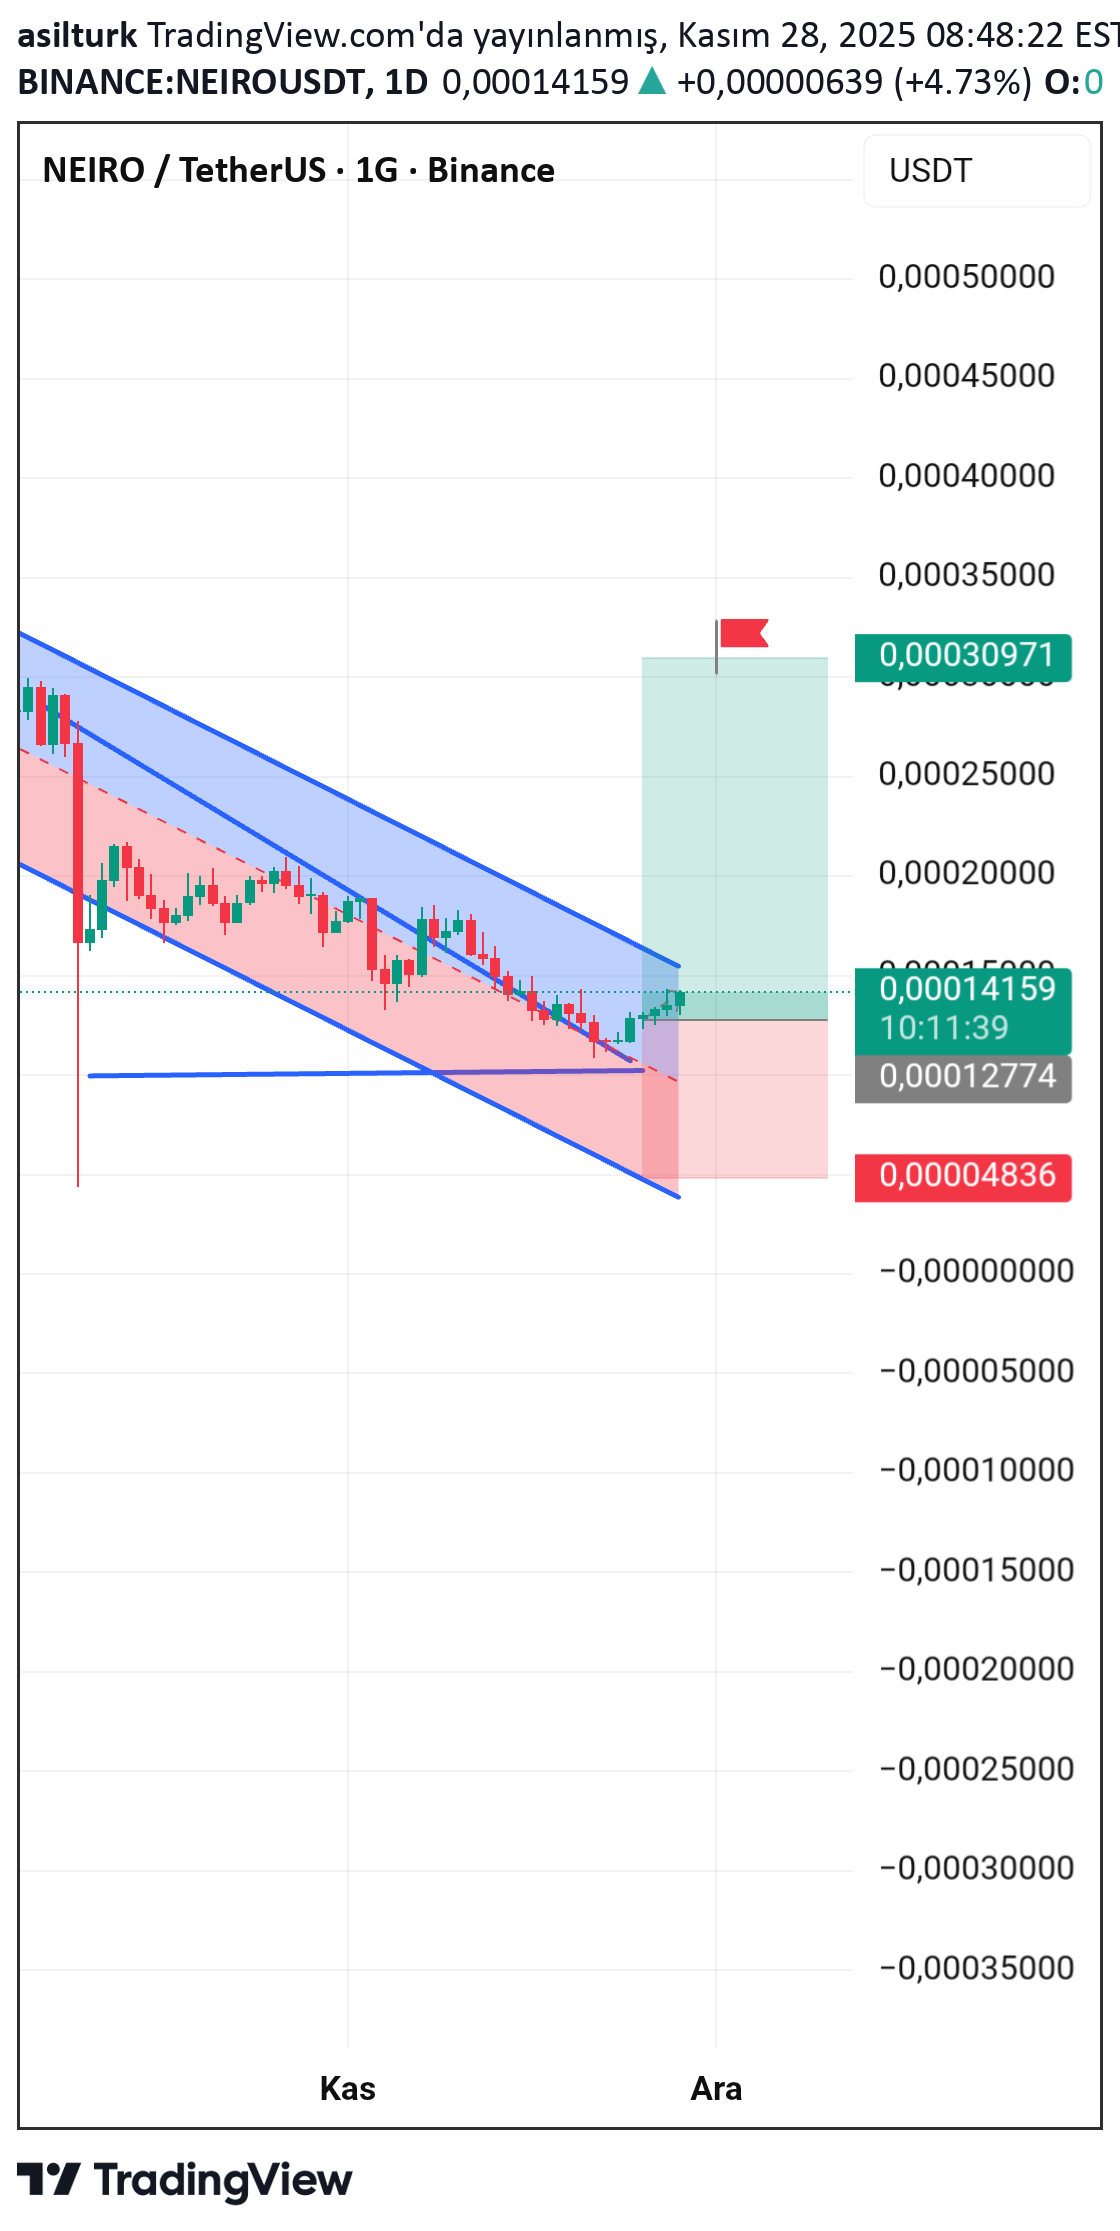
نیرو (NEIRO) در نقطه انفجار؟ فرصت خرید پنهان در میان شایعات ارزهای میم!

CryptoNuclear
NEIRO/USDT: انفجار بزرگ در راه است یا سقوط عمیقتر؟ تحلیل کلیدی مثلث نزولی
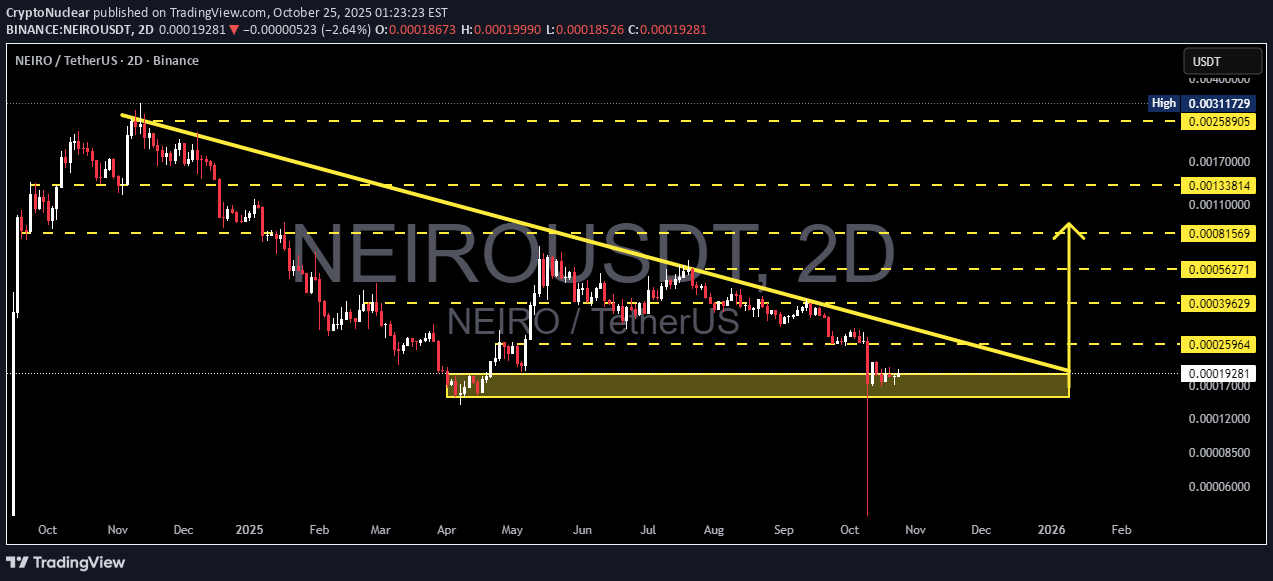
NEIRO is currently sitting at a critical juncture that could define the next major move. The 2D timeframe structure shows a Descending Triangle pattern that’s tightening — a sign that selling pressure remains dominant, yet buyers are starting to show strong defense around the main demand area. --- 📊 Technical Overview Primary trend: Mid-term downtrend with consecutive lower highs since early 2025. Main Demand Zone: 0.00019 – 0.00015, a strong accumulation area that has repeatedly held against heavy selling pressure. Descending Trendline Resistance: Pressuring the price since March, marking a key level to confirm a potential breakout. Volume: Gradually declining throughout the pattern — often a precursor to a major volatility spike. A long wick below the demand zone that quickly closed back inside indicates a liquidity grab — a classic signal of smart money accumulation from panic sellers before a large move unfolds. --- 🟢 Bullish Scenario If the price successfully breaks and closes above 0.00026 with rising volume, it would invalidate the descending trendline pressure. A confirmed breakout from this pattern could trigger a mid-term reversal, with targets at: 0.00039 (first resistance), 0.00056, and 0.00081 as extended targets. A 2D candle close above the trendline would strongly suggest that momentum is shifting to the bulls. Such moves are often followed by short-covering rallies and a sharp volume increase. --- 🔴 Bearish Scenario However, if a 2D candle closes below the demand zone at 0.00015, the Descending Triangle would confirm itself as a bearish continuation pattern. A breakdown like this could drag NEIRO further down toward the 0.00012 – 0.00009 range, or even lower if sell pressure intensifies. This scenario would indicate a lack of strong buying interest at this level — implying that the market might seek a new structural support area below. --- 🧭 Conclusion NEIRO is now in the final accumulation phase of a classical pattern that often precedes a major move. The market is simply waiting for directional confirmation. Breakout above → potential reversal and rally ahead. Breakdown below → continuation of the bearish trend. Be prepared for significant volatility — when a descending triangle completes, the move that follows is often sharp and decisive. --- #NEIRO #NEIROUSDT #CryptoBreakout #DescendingTriangle #CryptoSetup #AltcoinAnalysis #MarketStructure #AccumulationPhase #SwingTradeSetup #CryptoTrading

WaveRiders2
تحلیل فوری: آیا نِیرو (NEIRO) مقاومت قرمز را میشکند؟ هدف بعدی کجاست؟


pullbacksignal
NEIROUSDT için İşlem Sinyali
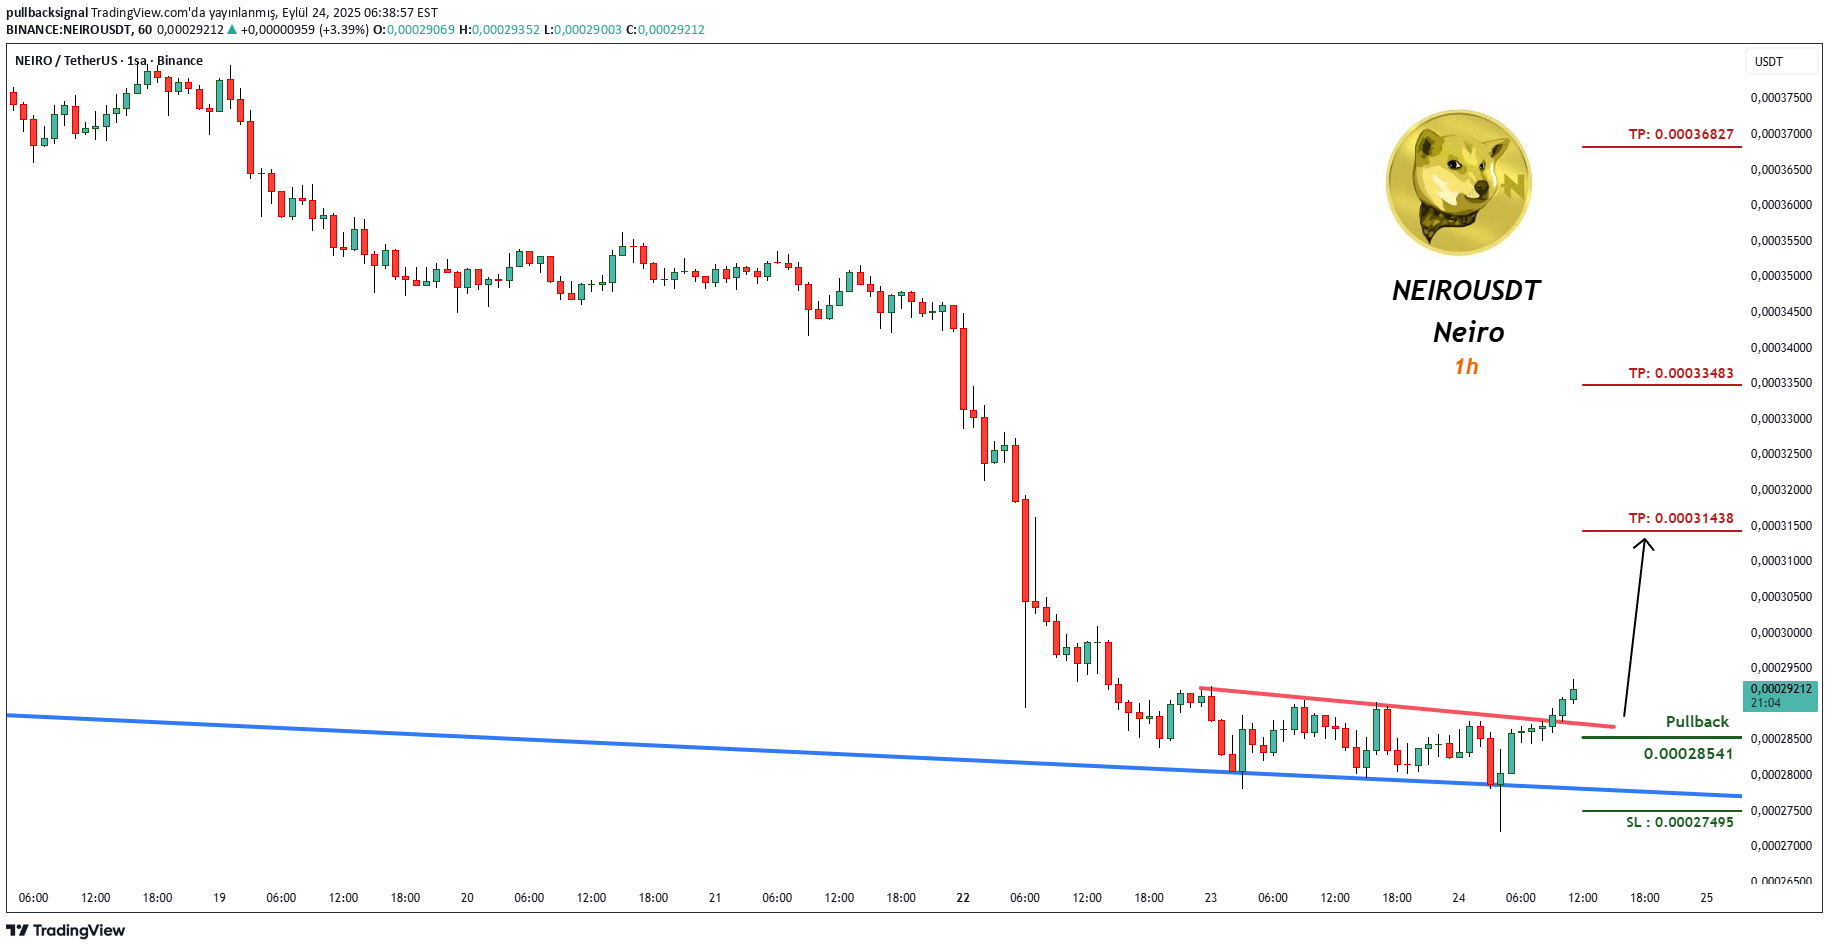
İşlem Kurulumu: NEIROUSDT Neiro'da bir İşlem Sinyali görülüyor (1s) İşlemciler ŞİMDİ Alım İşlemlerini açabilirler. ⬆️Şimdi Al veya 0,00028541'den Al ⭕️SL @ 0,00027495 🔵TP1 @ 0,00031438 🔵TP2 @ 0,00033483 🔵TP3 @ 0,00036827 Bu sinyaller neye dayanıyor? Klasik Teknik Analiz Fiyat Hareketi Mum Grafikleri Fibonacci RSI, Hareketli Ortalama, Ichimoku, Bollinger Bantları Risk Uyarısı Forex, CFD, Kripto, Vadeli İşlemler ve Hisse senetleri zarar riski taşır. Bu tür bir yatırımın sizin için uygun olup olmadığını lütfen dikkatlice değerlendirin. Geçmiş performans, gelecekteki sonuçların göstergesi değildir. Fikirlerimizi beğendiyseniz, lütfen beğenileriniz 👍 ve yorumlarınızla bizi destekleyin.
pullbacksignal
Trading Signal For NEIROUSDT
Trading Setup: A Trading Signal is seen in the NEIROUSDT Neiro (1h) Traders can open their Buy Trades NOW ⬆️Buy now or Buy on 0.00028541 ⭕️SL @ 0.00027495 🔵TP1 @ 0.00031438 🔵TP2 @ 0.00033483 🔵TP3 @ 0.00036827 What are these signals based on? Classical Technical Analysis Price Action Candlesticks Fibonacci RSI, Moving Average , Ichimoku , Bollinger Bands Risk Warning Trading Forex, CFDs, Crypto, Futures, and Stocks involve a risk of loss. Please consider carefully if such trading is appropriate for you. Past performance is not indicative of future results. If you liked our ideas, please support us with your likes 👍 and comments .
CryptoNuclear
NEIRO/USDT — Bullish Reversal Setup or Bearish Continuation?
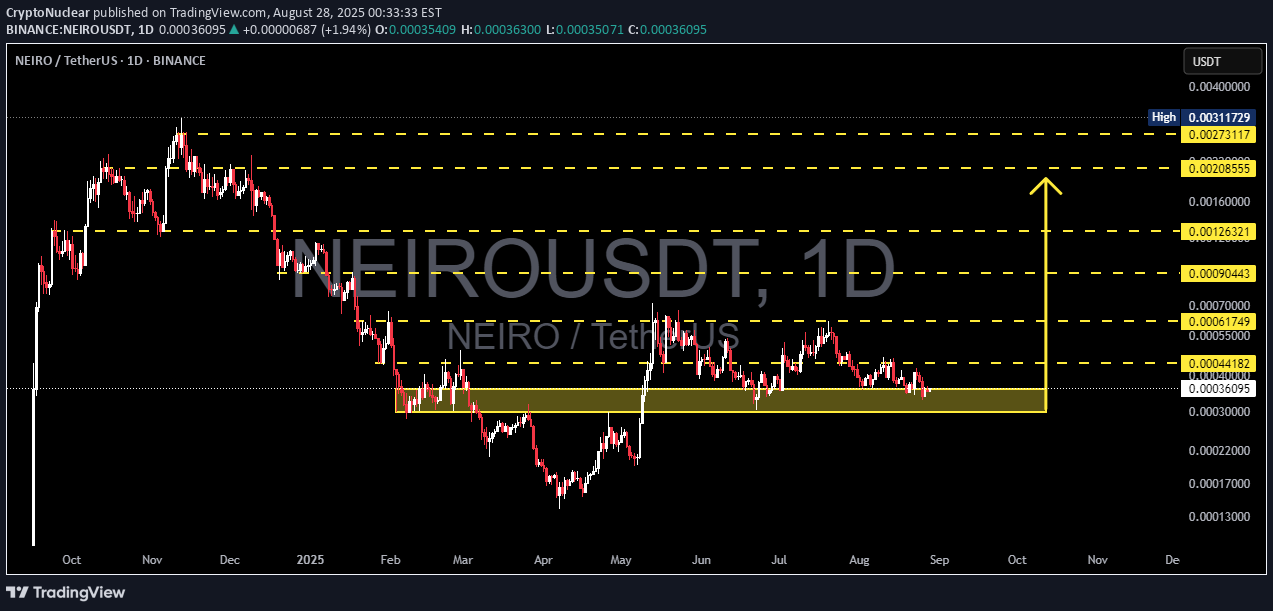
🔑 Key Takeaways NEIRO/USDT is currently sitting at a critical demand zone between 0.00030–0.00044. This area has acted as a strong defensive level for buyers, preventing deeper declines multiple times in recent months. While the macro trend remains bearish, the recent structure shows a consolidation phase (sideways range), which could either become a base for a relief rally or a continuation pattern for another leg down. The market stands at a crossroad: Will buyers push for a breakout, or will sellers take control with a breakdown? --- 📌 Key Technical Levels Demand Zone (Main Support): 0.00030 – 0.00044 Additional supports (if breakdown occurs): 0.00022 and 0.00013 Key Resistance Levels (bullish targets): R1: 0.00061749 R2: 0.00090443 R3: 0.00126321 R4: 0.00208555 R5: 0.00273117 R6: 0.00311729 (major swing high) --- 📉 Chart Structure & Pattern The broader downtrend remains visible (lower highs & lower lows). A sharp rebound in May 2025 indicates a possible liquidity sweep. Current price action shows range-bound consolidation around the yellow demand box. This setup resembles an accumulation base: strong demand could trigger a rally. Failure to hold this zone would confirm a bearish continuation toward lower supports. --- 🚀 Bullish Scenario 1. Breakout confirmation: Daily close above 0.00044182 with strong volume. 2. Upside targets: Target 1: 0.00061749 Target 2: 0.00090443 Target 3: 0.00126321 Extended targets (if momentum builds): 0.00208555 – 0.00273117 3. This zone could serve as the foundation for a strong relief rally if buyers step in. 4. Risk-to-reward is favorable: entries near support offer high potential upside vs. limited downside. --- 🐻 Bearish Scenario 1. Breakdown confirmation: Daily close below 0.00030. 2. This would invalidate the demand zone → buyers lose control. 3. Downside targets: Target 1: 0.00022 Target 2: 0.00013 4. Breakdown could trigger panic selling or a capitulation move. --- 📝 Trading Approach Conservative traders: Wait for daily close confirmation (breakout or breakdown). Aggressive traders: Consider entries inside the demand zone (0.00036–0.00040) with tight stops below 0.000295. Take profit gradually at key resistance levels to lock gains. Always check volume and momentum indicators (RSI, MACD) for confirmation. --- ⚠️ Risk Note Crypto markets are highly volatile — never go all-in. This analysis is for educational purposes only, not financial advice. Always apply stop-loss and proper risk management. --- ✨ Conclusion NEIRO/USDT is currently trading at its most critical demand zone. If it holds, buyers may fuel a significant rebound toward 0.00061749 → 0.00090443 → 0.00126321. If it fails, a breakdown toward 0.00022 and 0.00013 becomes highly likely. The market is at a major decision point: will this demand zone serve as the foundation for a bullish reversal, or will it lead to the next bearish leg down? #NEIRO #NEIROUSDT #AltcoinAnalysis #CryptoTrading #SupportResistance #DemandZone #Breakout #BearishOrBullish #PriceAction #CryptoChart

lionxruthless
Charts Don’t Lie – NEIRO is Brewing a Monster Move

"Clear as day. It's cooking... Soon to the moon" Do Only Good Everyday! 💛🐕 "Closest target is inevitable at the point-of-center: " 0.00131000 – 0.00161000 " "This is not investment advice."
CryptoNuclear
NEIRO/USDT — Accumulation Before Rally or Breakdown?

✨ Overview: NEIRO is now at a make-or-break level. Price has once again tested the daily demand zone (0.00033–0.00038), the same area that fueled the strong rally back in May. This zone acts as the last line of defense for buyers to hold the structure and prevent deeper downside. At the same time, the chart is shaping a descending triangle pattern — consistent lower highs pressing down into a flat support zone. This signals compression and building pressure, ready to explode either upward (bullish breakout) or downward (bearish breakdown). --- 🟢 Bullish Scenario 1. A positive reaction from demand with a D1 close above 0.00040 could spark a recovery. 2. Stronger confirmation comes with a break above 0.0004402, opening the path to higher resistances: 🎯 Target 1: 0.0005109 🎯 Target 2: 0.0006198 🎯 Target 3: 0.0009048 (major supply retest) 3. If buyers can maintain a higher low above 0.00036–0.00038, momentum shift toward reversal is likely. --- 🔴 Bearish Scenario 1. A daily close below 0.00033 confirms a breakdown, turning the demand zone into fresh supply. 2. Downside targets then extend to: ⚠️ Target 1: 0.0002700 ⚠️ Target 2: 0.0001650 ⚠️ Final Extension: 0.0001390 (the chart’s marked low). 3. This would reinforce the broader bearish trend that has dominated since the January 2025 peak. --- 📌 Pattern & Context Descending Triangle: lower highs compressing toward flat support — a typical breakout setup. Demand Zone: the yellow block is a historical base that once fueled a rally; now it’s the battleground. Momentum: the longer price compresses here, the stronger the breakout reaction is expected. --- 📖 Trading Plan Summary Bullish Play: look for entries near support with stop below 0.00033 → targets 0.00044 / 0.00051 / 0.00062. Bearish Play: wait for D1 close below 0.00033 → sell on retest → targets 0.00027 / 0.000165. Key: The 0.00033–0.00038 demand zone is the ultimate decision point. #NEIROUSDT #Altcoin #CryptoAnalysis #DemandZone #DescendingTriangle #PriceAction #SupportResistance
pullbacksignal
Neiro | Long Term Wedge Pattern

Ticaret Kurulumu: NEIROUSDT Neiro'da (Günlük) bir Ticaret Sinyali görülüyor Ticaretçiler ŞİMDİ Satın Alma İşlemlerini açabilirler ⬆️Şimdi satın al veya 0,000313'te satın al ⭕️SL @ 0,000178 (-%52) 🔵TP1 @ 0,00066 (+%74) 🔵TP2 @ 0,000879 (+%132) 🔵TP3 @ 0,00123 (+%225) Bu sinyaller neye dayanmaktadır? Klasik Teknik Analiz Fiyat Hareketi Mum Çubukları Fibonacci RSI, Hareketli Ortalama, Ichimoku, Bollinger Bantları Risk Uyarısı Forex Ticareti, CFD'ler, Kripto, Vadeli İşlemler ve Hisse Senetleri kayıp riski içerir. Lütfen bu tür işlemlerin sizin için uygun olup olmadığını dikkatlice düşünün. Geçmiş performans gelecekteki sonuçların göstergesi değildir. Fikirlerimizi beğendiyseniz lütfen beğenilerinizle 👍 ve yorumlarınızla bizi destekleyin.

CryptoAnalystSignal
NEIRO on Reversal Watch
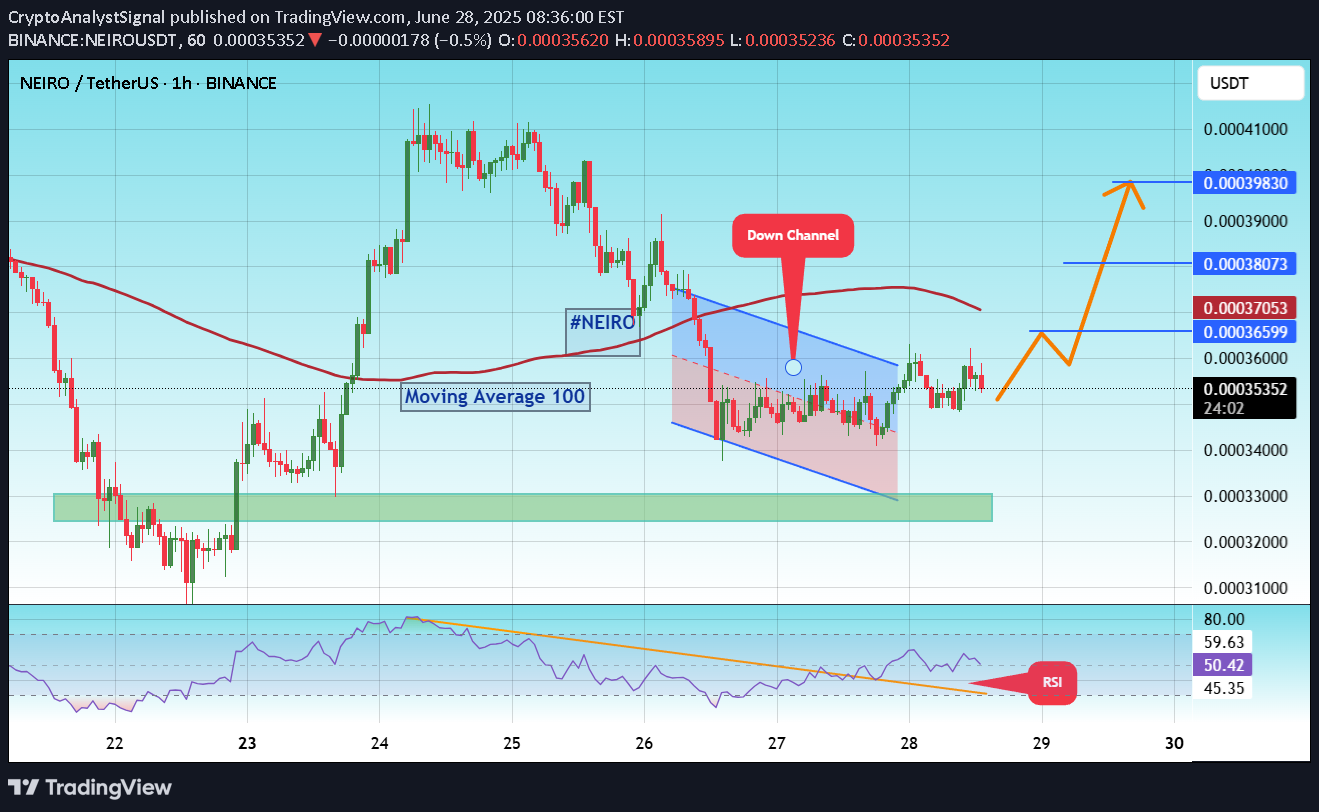
#NEIRO The price is moving within a descending channel on the 1-hour frame and is expected to break and continue upward. We have a trend to stabilize above the 100 moving average once again. We have a downtrend on the RSI indicator that supports the upward break. We have a support area at the lower boundary of the channel at 0.00033500, acting as a strong support from which the price can rebound. We have a major support area in green that pushed the price upward at 0.00032700. Entry price: 0.000352560. First target: 0.00036600. Second target: 0.00038073. Third target: 0.00029830. To manage risk, don't forget stop loss and capital management. When you reach the first target, save some profits and then change the stop order to an entry order. For inquiries, please comment. Thank you.#NEIRO First target: 0.00036600 Reached Second target: 0.00038073. Reached Third target: 0.00029830. Reached
Disclaimer
Any content and materials included in Sahmeto's website and official communication channels are a compilation of personal opinions and analyses and are not binding. They do not constitute any recommendation for buying, selling, entering or exiting the stock market and cryptocurrency market. Also, all news and analyses included in the website and channels are merely republished information from official and unofficial domestic and foreign sources, and it is obvious that users of the said content are responsible for following up and ensuring the authenticity and accuracy of the materials. Therefore, while disclaiming responsibility, it is declared that the responsibility for any decision-making, action, and potential profit and loss in the capital market and cryptocurrency market lies with the trader.