
MOVR
Moonriver
| تریدر | نوع سیگنال | حد سود/ضرر | زمان انتشار | مشاهده پیام |
|---|---|---|---|---|
 Trades_for_TradersRank: 1736 | خرید | حد سود: تعیین نشده حد ضرر: تعیین نشده | 12/29/2025 |
Price Chart of Moonriver
سود 3 Months :
سیگنالهای Moonriver
Filter
Sort messages by
Trader Type
Time Frame
Trades_for_Traders
SPOT MOVR LONG 29.12.2025

Pinning after abnormal activity. 💰I enter at the market price. I'll let you know when I record it manually. ‼️Risk per trade: 1% of the allocated funds for spot trading.

Habib-Tafazoli
Moon river
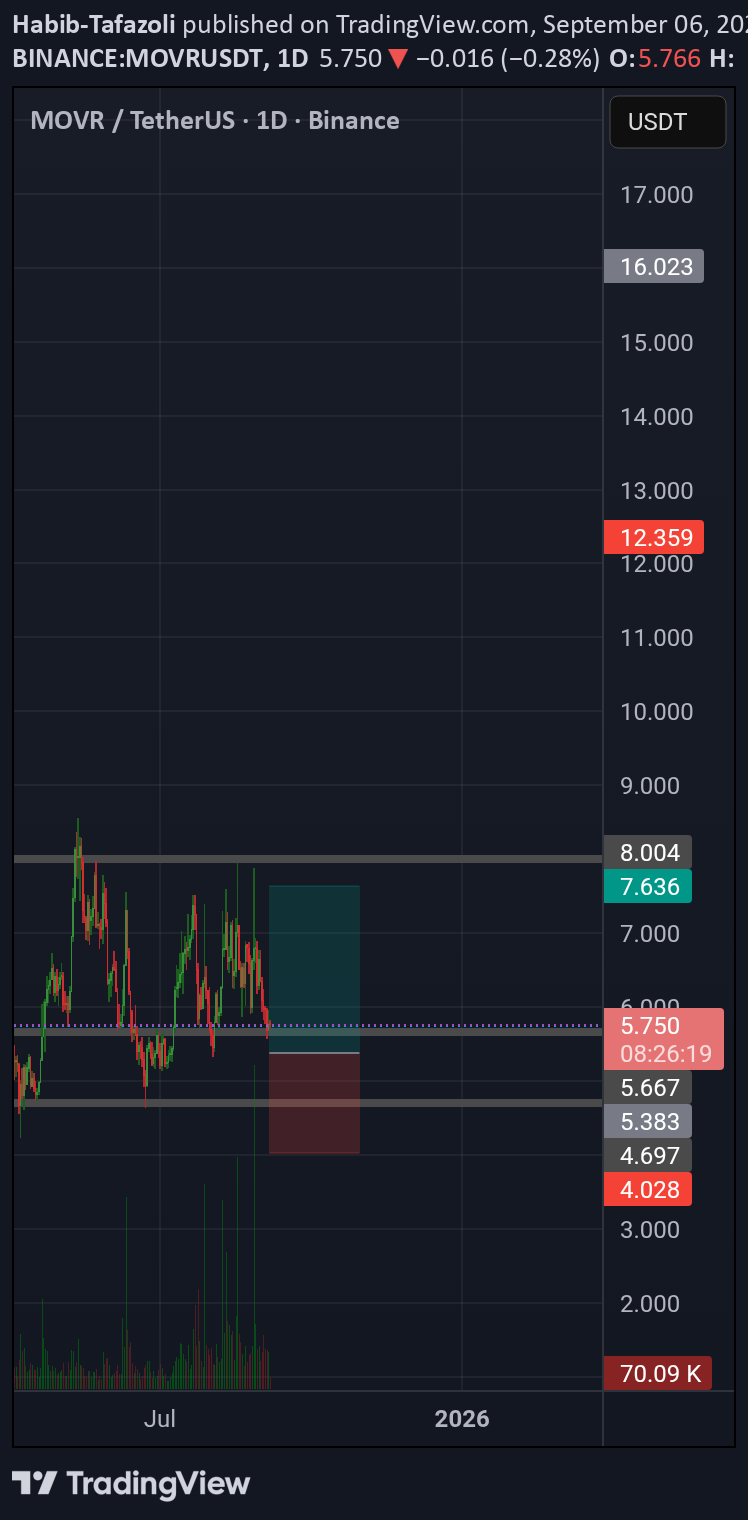
Movr usdt daily analysis Time frame daily Risk rewards ratio >1.6 Target 7.63 $

SpartaBTC
MOVR Main trend. Dying hype. Price squeeze. 08 2025
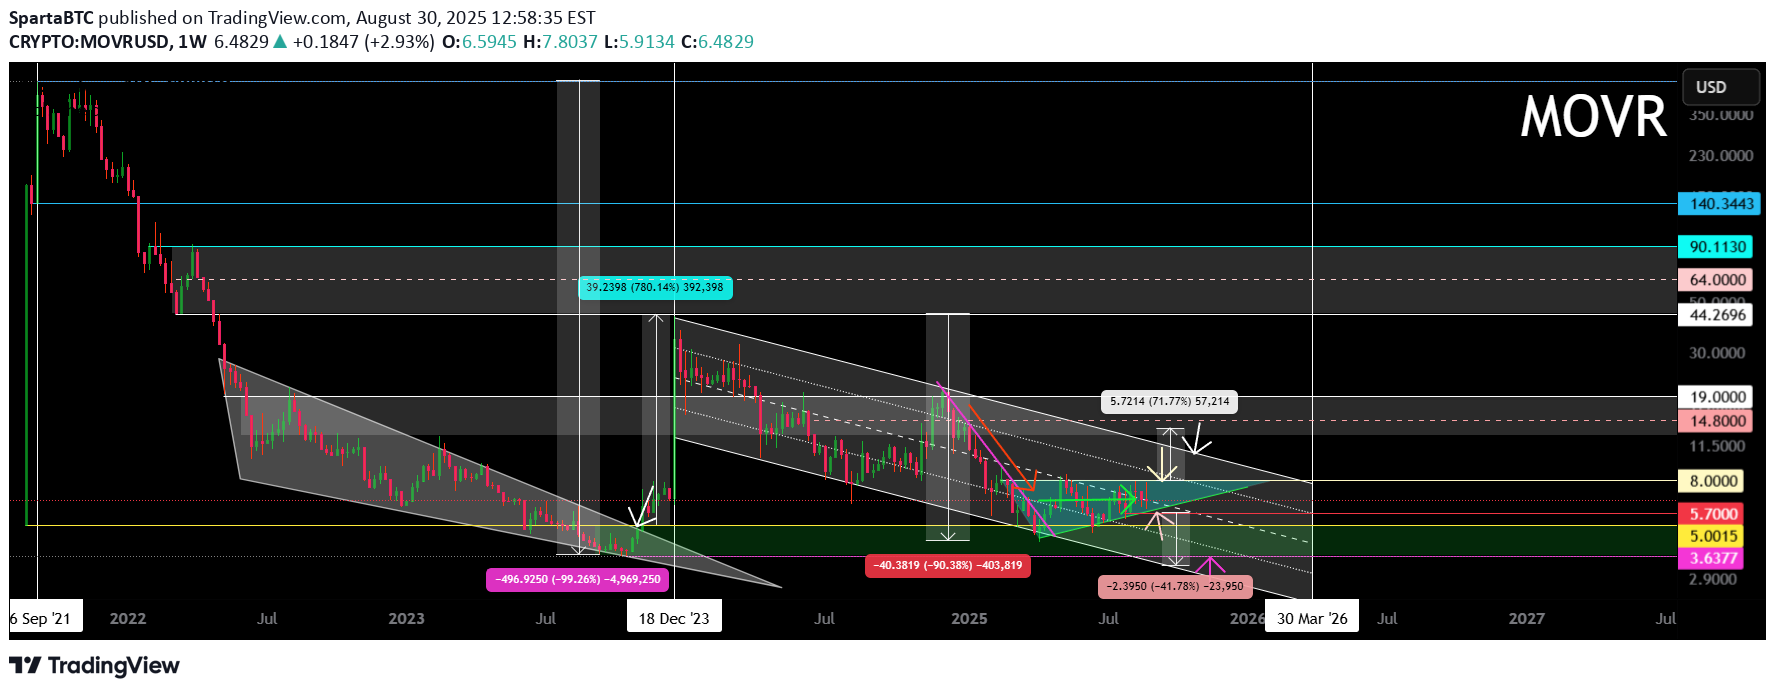
Logarithm. Time frame 1 week for the overall trend and this price clamping zone in it. The chart shows 2 zones with which it is rational to work after the trend break. The first zone is the targets of the bullish triangle (there is a clamping in this range now) and resistance zones, if it is realized. If not, and the price decreases along the descending channel to its lower zone, then after the break and exit from this channel, these prices will still be reached with a high degree of probability. It is unlikely that this will be, as before, a "stick" at +800%. Second zone — median of trend pump bowl, which, most likely, if it happens, is the maximum zone of maximums, before the project scam. Locally triangle zone on the 3-day time frame. It is also worth noting that the chart is used by tradingview spot to show the entire price history, but if you look at the price chart of some liquid exchange, you will see that bots are winding up the volume, and sometimes there are buyouts at the market. From the position of the main trend , this is the price zone of its minimums. Secondary , — conditional minimums. Work from the average price + on a breakout. Local trend — work with a triangle, or in its canvas, if you are a scalper. Volatility there is significant due to low liquidity.

Andy1GP
Possible MOVR price moving forward
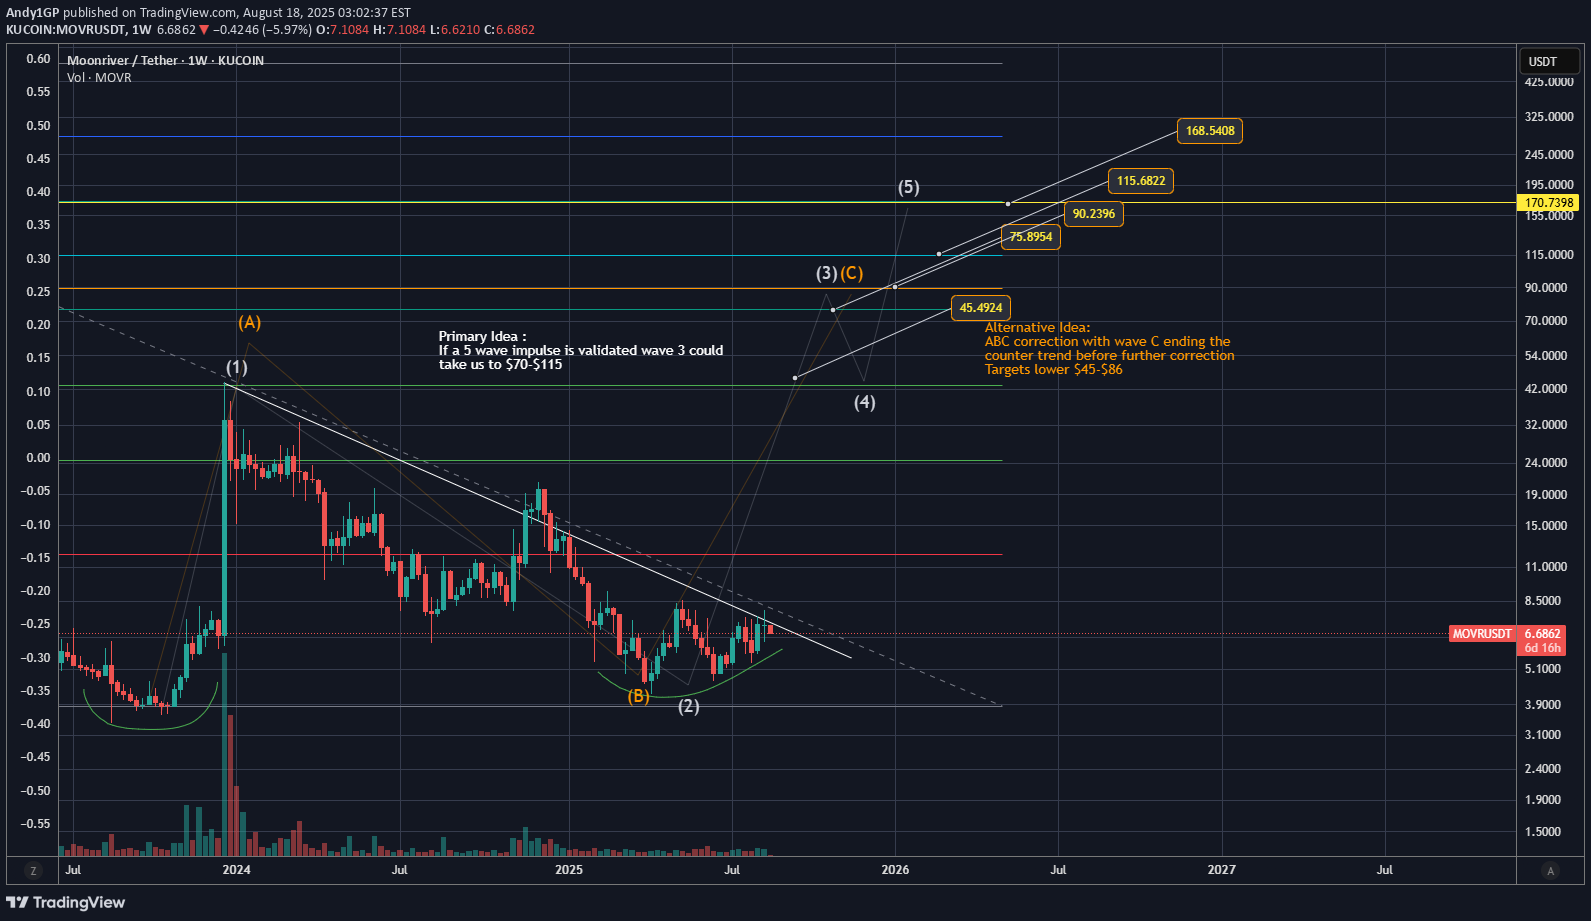
Still unsure if a correction or impulse is playing out. Time is running out and 5 wave move seems unlikely to fully complete within the remaining time of 2025. Alternating long W2 to a short W4 could aid in the new local high price. Alternate ABC corrective count still bullish short and mid term but ultimately would lead to the demise of this project price action. Time frame for completion before end of 2025 At this point OCT '25 seems likely

MasterAnanda
Moonriver Trading at Opportunity Buy Zone · 2,600% PP

Moonriver (MOVRUSDT) is doing great right now and there are many reasons why this is so. This is a good chart with a strong project. This combination gives us huge potential for growth. MOVRUSDT grew more than 1,000% in late 2023. This was only small jump and much more is possible when the market is doing good. Back in late 2023 things were much different, market conditions were not the same. Seeing an 11X rise with a weak market means this pair can do great. How will Moonriver move within a strong bull market? Growth potential is truly unlimited. The targets on the chart are conservative targets. MOVRUSDT produced a long-term higher low in April 2025. The correction that started December 2023 failed to challenge the October 2023 low. The failure to challenge this support means that buyers were present even after the market was bearish for more than a year. After the low in April we have no new lows and a slightly rising bottom with higher lows. It is as if right now MOVR is making one final stop before a massive jump. It is slow now, shy, but things are about to change. The chart is bullish (has growth potential) and points higher. Patience is key. The market will grow. Namaste.

Alpha-GoldFX
MOVRUSDT Forming Descending Channel

MOVRUSDT is currently trading within a Descending Channel Pattern, a formation that typically precedes a strong breakout to the upside once the downward pressure begins to fade. This pattern indicates a period of consolidation where lower highs and lower lows are formed in a controlled channel, often signaling that selling momentum is weakening. As price approaches the lower bound and shows signs of strength, traders often anticipate a bullish breakout. With MOVR showing strong support at current levels, this could be the early signs of a reversal. The volume backing this structure is encouraging, reflecting accumulation behavior—where informed investors begin positioning ahead of a potential trend change. When descending channel breakouts occur with solid volume confirmation, they tend to result in rapid and extended moves. Based on the current chart structure, the expected upside potential is in the range of 80% to 90%, offering a compelling risk-to-reward setup for both swing and medium-term traders. Investor interest around MOVRUSDT has been gradually increasing, driven by renewed attention to its underlying ecosystem and growing traction among crypto communities. The project’s fundamentals and continued development have kept it on the radar of market watchers. In a bullish market environment, assets like MOVR—trading near structural support and within a clear reversal pattern—often attract sharp inflows, accelerating their breakout trajectory. This is a prime opportunity for those seeking breakout setups. MOVRUSDT combines a favorable technical pattern with strong volume and growing investor sentiment, making it a high-potential candidate for the next leg up. Monitor closely for breakout confirmation to capitalize on the projected upside move. ✅ Show your support by hitting the like button and ✅ Leaving a comment below! (What is You opinion about this Coin) Your feedback and engagement keep me inspired to share more insightful market analysis with you!

Bithereum_io
MOVRUSDT 1D

#MOVR is moving inside a symmetrical triangle on the daily chart and has recently bounced from the edge of the Ichimoku Cloud — a promising sign of strength. 📌 Consider buying at the current level and near the support zone at $5.477. In case of a breakout above the triangle resistance, the potential upside targets are: 🎯 $8.374 🎯 $9.353 🎯 $10.748 🎯 $12.524 ⚠️ As always, use a tight stop-loss and apply proper risk management.

Crypto_alphabit
MOVR (SPOT)

MOVRUSDT #MOVR/ USDT Entry (5.000- 5.700) ***** (Wait for the price to come to the entry range & price may come to the lowest entry point ) ****** SL 4H close below 4.900 T1 7.00 T2 9.50 T3 12.00 Extra Target T4 13.50 _______________________________________________________ Golden Advices. ******************** * collect the coin slowly in the entry range. * Please calculate your losses before the entry. * Do not enter any trade you find it not suitable for you. * No FOMO - No Rush , it is a long journey.

rackly

rackly

Disclaimer
Any content and materials included in Sahmeto's website and official communication channels are a compilation of personal opinions and analyses and are not binding. They do not constitute any recommendation for buying, selling, entering or exiting the stock market and cryptocurrency market. Also, all news and analyses included in the website and channels are merely republished information from official and unofficial domestic and foreign sources, and it is obvious that users of the said content are responsible for following up and ensuring the authenticity and accuracy of the materials. Therefore, while disclaiming responsibility, it is declared that the responsibility for any decision-making, action, and potential profit and loss in the capital market and cryptocurrency market lies with the trader.