
MEW
cat in a dogs world
| تریدر | نوع سیگنال | حد سود/ضرر | زمان انتشار | مشاهده پیام |
|---|---|---|---|---|
No results found. | ||||
Price Chart of cat in a dogs world
سود 3 Months :
سیگنالهای cat in a dogs world
Filter
Sort messages by
Trader Type
Time Frame

mastercrypto2020
MEWUSDT LONG SIGNAL

📢 Trade Setup – MEW/USDT 📈 Position: LONG 💰 Entry Zone: 0.00101 – 0.00106 (Price is reacting inside the marked demand zone after trendline breakout) 🛑 Stop-Loss: 0.00094 (Below the demand zone and structure invalidation) 🎯 Take-Profit Targets: • TP1: 0.00115 • TP2: 0.00126 • TP3: 0.00137 • TP4: 0.00152 📊 Timeframe: 1H ⚖️ Risk / Reward: Favorable ⚙️ Leverage: Spot or low leverage (max 3×) 🧠 Technical Analysis: Price has broken the descending trendline and is holding above the key demand area. Market structure is shifting from bearish to bullish, and the current consolidation suggests continuation toward higher resistance and liquidity levels. 📌 Trade Management: ✔️ Take partial profits at each TP ✔️ Move SL to Break-Even after TP1 ✔️ Trail SL below higher lows ✔️ Risk max 1–2% per trade

iMoneyTeam
MEW Buy/Long Signals (4H)

After the bullish CH on the chart, the price has moved strongly to the upside with powerful momentum. The current market structure and price momentum clearly support long buy positions. We have two entry zones, and positions should be entered using a DCA (Dollar-Cost Averaging) approach to manage risk effectively. All target levels have been marked directly on the chart for clarity and better trade planning. If you want it more technical, simpler, or more promotional, I can adjust the style. If you would like us to analyze a coin or altcoin for you, first like this post, then comment the name of your altcoin below.

Crypto-by-PRIME
تحلیل MEW/USDT: آیا زمان خرید فرارسیده است؟ حفظ این حمایت کلیدی است!

MEW / USDT Breakout confirmed from the descending trendline. Price is retesting the demand zone, and as long as this support holds, we can expect bullish continuation towards higher levels. Breakdown below the zone will invalidate the setup.

Bithereum_io
MEWUSDT 1D
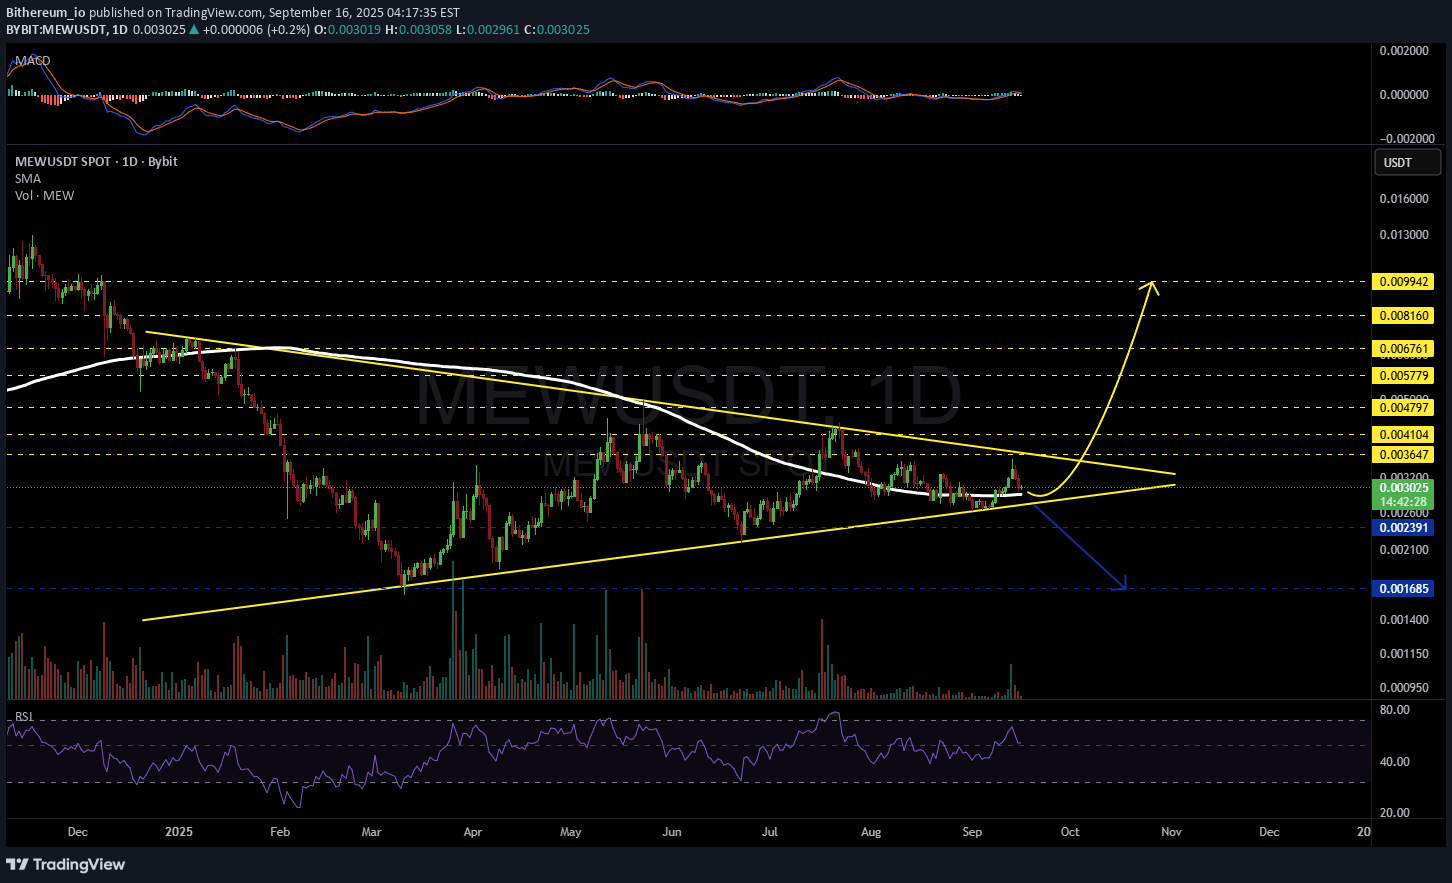
#MEW is moving within a symmetrical triangle on the daily chart and is currently sitting on the daily SMA200. In case of a bounce, we can expect it to move toward the triangle resistance and potentially break above it. If that happens, the targets are: 🎯 $0.003647 🎯 $0.004104 🎯 $0.004797 Mid-term targets: 🎯 $0.005779 🎯 $0.006761 🎯 $0.008160 🎯 $0.009942 If the triangle breaks to the downside, it could retest the support levels at $0.002391 and $0.001685. ⚠️ Always remember to use a tight stop-loss and follow proper risk management.

CryptoNuclear
MEWU/USDT — Symmetrical Triangle: A Major Breakout is Coming?
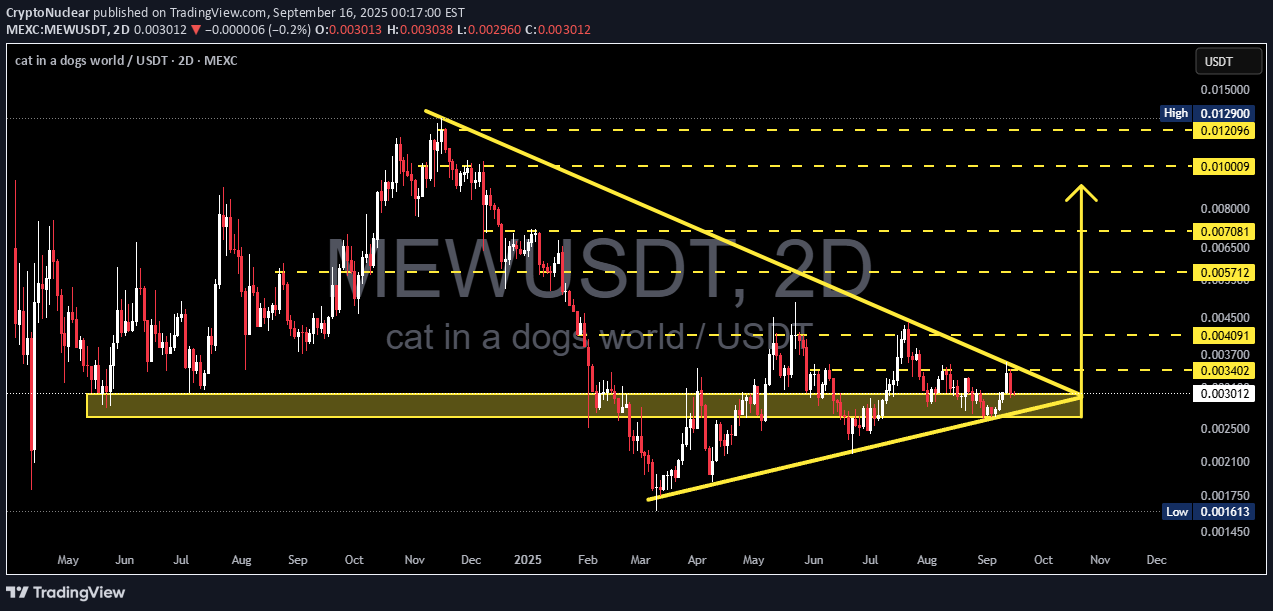
📝 Summary The MEWU/USDT pair is currently consolidating after a strong downtrend since early 2025. Price has been compressing into a symmetrical triangle pattern, trapped between a horizontal support zone at 0.0027–0.0033 and a descending resistance trendline. The structure is now very close to its apex → meaning a major breakout (up or down) is imminent. The next move will likely set the medium- to long-term direction of this token. --- 🔎 Pattern & Market Structure Main pattern: Symmetrical Triangle — formed by higher lows and lower highs. Market context: Appears after a steep downtrend. Symmetrical triangles are technically neutral, but the initial bias leans slightly bearish until proven otherwise. Accumulation zone: 0.0027–0.0033 has acted as a key battleground between buyers and sellers. Key levels: Supports: 0.0027 → 0.0021 → 0.00175 → 0.001613 (major low) Resistances: 0.003402 → 0.004091 → 0.005712 → 0.007081 → 0.010009 → 0.012096 --- 🚀 Bullish Scenario (If Breakout Upward) 1. Confirmation: A 2D close above 0.0034–0.0035 with strong volume. 2. Healthy retest: Price retests 0.0034–0.0030 as new support. If it holds → bullish confirmation. 3. Targets: 🎯 TP1: 0.00409 (+35%) 🎯 TP2: 0.00571 (+89%) 🎯 TP3: 0.00708 🎯 Extended target: 0.0100 – 0.0120 (if momentum/FOMO enters). 4. Risk management: Stop loss below 0.0027; aim for R:R ≥ 1:2. > An upside breakout would signal a major trend reversal after months of consolidation. The move could be explosive. --- 🐻 Bearish Scenario (If Breakdown Downward) 1. Confirmation: A 2D close below 0.0027 with heavy selling volume. 2. Failed retest: Price retests 0.0027–0.0029 from below and gets rejected → bearish continuation. 3. Targets: 🎯 TP1: 0.0025 🎯 TP2: 0.0021 🎯 TP3: 0.00175 🎯 TP4: 0.00161 (major historical support). 4. Risk management: Stop loss above 0.0034 if shorting. > A downside break would confirm trend continuation, exposing MEWU to another 30–50% decline. --- 📌 Key Notes The longer the triangle compresses, the stronger the breakout tends to be. Volume is the key indicator → no volume = high risk of false breakout. On the 2D timeframe, any breakout can drive a trend lasting weeks to months. Expect high volatility due to relatively low liquidity in smaller tokens. --- 📢 Conclusion MEWU/USDT is at a critical crossroads. The symmetrical triangle formed since March is nearing its apex, and a directional breakout is imminent. Breakout upward → potential rally of +100% toward 0.0057–0.0070. Breakdown downward → risk of a 30–50% drop toward 0.0016. 📌 Best approach: wait for confirmation (close + volume + retest) before entering. Patience here can prevent being trapped in a false move. --- #MEWU #MEWUUSDT #CryptoAnalysis #Breakout #TrianglePattern #Altcoin #TechnicalAnalysis #BullishScenario #BearishScenario
CryptoNuclear
MEW/USDT Retesting Key Zone, Ready for the Next Move?

📊 Technical Analysis: MEW/USDT on the 2D timeframe shows a compelling structure with a Symmetrical Triangle pattern breakout that occurred in late July 2025. This breakout indicates a potential trend reversal from bearish to bullish. Currently, the price is performing a retest of the breakout level while sitting within a strong support zone between 0.00280 – 0.00310 USDT (highlighted in yellow). This area previously acted as accumulation and now serves as a key support. --- 📈 Bullish Scenario: Price holds and bounces from the 0.00280 – 0.00310 zone, forming a new higher low. Potential upside targets include: 0.004091 (minor resistance) 0.007081 0.010009 And extended targets at 0.012096 – 0.012900 if bullish momentum continues. Bullish confirmation strengthens if price reclaims above 0.004091 with strong volume. --- 📉 Bearish Scenario: If the price fails to hold the 0.00280 support and breaks below the ascending trendline (rising yellow line), then: It may revisit the next support zone at 0.002300 Possibly retest the historical low at 0.001613 Bearish case invalidated if price pushes back above 0.0040 with a strong bullish candle. --- 📐 Pattern & Structure: Symmetrical Triangle Breakout: Signals a consolidation phase that resolved to the upside. Breakout Retest: Price is now retesting the breakout level — a crucial phase to validate trend continuation. Support-Resistance Flip: The yellow zone is key in determining whether bulls maintain control. --- 🧠 Summary: MEW/USDT is currently in a critical retest phase after a bullish breakout from a symmetrical triangle pattern. If support holds, this could be a solid swing opportunity toward higher resistance levels. However, a breakdown below the key support would invalidate the bullish setup and open room for further downside. #MEWUSDT #CryptoAnalysis #BreakoutRetest #SymmetricalTriangle #AltcoinSetup #BullishScenario #BearishScenario #TechnicalAnalysis #SwingTrade

jonathonbevell872
mew usdt looking good

1. on the daily we are consolidating in a cup and handle we are right at the 200ma if we break above it we should get a move 2 on the weekly time frame its making higher lows with bullish divergence 3 most of the time frames have had time to cool down over sold, i would enter close to the point of control. 4 the first target would be around 85 % 5 btc dom. is falling which is very bullish for our alt coins god bless

TheHunters_Company
MEW : A meme coin that hasn't grown yet

Hello friends🙌 Given the decline we had, you can see that buyers entered the specified support area and entered the price into the ascending channel. That is why we can buy with risk and capital management and stay with it until the specified targets. 🔥Follow us for more signals🔥 *Trade safely with us*
CryptoNuclear
MEWUSDT Breakout! Rounded Bottom Reversal and Key Retest Zone!

MEWUSDT has officially broken out of a long-term descending trendline that has capped price action since December 2024. The formation of a Rounded Bottom (Cup) suggests a strong accumulation phase and potential for trend reversal. The current retest of the breakout zone will be crucial in determining the next big move! --- 🔍 Technical Analysis Details: 1. Chart Pattern: A clear Rounded Bottom (Cup) pattern has formed, often signaling a bullish reversal. Price has broken through the descending trendline, and is now retesting the breakout zone (highlighted in yellow), which previously acted as resistance and is now turning into key support. 2. Resistance Levels (Upside Targets): ⚡ 0.004105 – First breakout point 🟡 0.006491 – Mid-level resistance 🟡 0.007725 – Previous local high 🟡 0.009970 – Strong resistance zone 🔵 0.012214 – Psychological resistance 🔵 0.012936 – Major swing high 3. Key Support Levels: 🟡 0.003200 – Current demand zone (yellow box) 🔵 0.001614 – Historical bottom --- ✅ Bullish Scenario: If MEWUSDT holds above the 0.0032–0.0041 support zone and confirms it as a new base: 🎯 Target 1: 0.00649 🎯 Target 2: 0.0077 🎯 Higher targets: 0.0099 up to 0.0129 This breakout may be the start of a strong bullish rally, especially if accompanied by increasing volume. --- ⚠️ Bearish Scenario: If price fails to hold the breakout zone and falls back below the trendline: Price may revisit 0.0026 – 0.0020 support Further weakness could push it back to the 0.001614 historical low --- 🧠 Conclusion: MEWUSDT is showing early signs of a bullish reversal after breaking out of a long-term descending trendline and forming a rounded bottom pattern. The current retest zone is critical — holding this level could confirm the start of a bullish trend with multiple upside targets. #MEWUSDT #CryptoBreakout #TechnicalAnalysis #Altcoins #MemeCoin #CryptoTrading #BullishSetup #RoundedBottom #TrendReversal #SupportAndResistance

O_Positive
MEW - 7/20/2025

Clear weekly momentum pushing upwards out of long term downtrend. Think we're set up for a marketwide breakout soon anyways. nfa :)
Disclaimer
Any content and materials included in Sahmeto's website and official communication channels are a compilation of personal opinions and analyses and are not binding. They do not constitute any recommendation for buying, selling, entering or exiting the stock market and cryptocurrency market. Also, all news and analyses included in the website and channels are merely republished information from official and unofficial domestic and foreign sources, and it is obvious that users of the said content are responsible for following up and ensuring the authenticity and accuracy of the materials. Therefore, while disclaiming responsibility, it is declared that the responsibility for any decision-making, action, and potential profit and loss in the capital market and cryptocurrency market lies with the trader.