
M
MemeCore
| تریدر | نوع سیگنال | حد سود/ضرر | زمان انتشار | مشاهده پیام |
|---|---|---|---|---|
 pullbacksignalRank: 30194 | خرید | حد سود: تعیین نشده حد ضرر: تعیین نشده | 1/8/2026 |
Price Chart of MemeCore
سود 3 Months :
سیگنالهای MemeCore
Filter
Sort messages by
Trader Type
Time Frame
pullbacksignal
MUSDT İçin İşlem Sinyali

İşlem Kurulumu: A trading signal appears on MUSDT MemeCore (1-hour) (spot). Yatırımcılar ŞİMDİ They can open Buy Transactions. ⬆️Buy Now or Buy at 1.59361 ⭕️SL @ 1.53772 🔵TP1 @ 1.71867 🔵TP2 @ 1.78673 🔵TP3 @ 1.91978 What are these signals based on? Classic Technical Analysis Price Action Candlestick Charts Fibonacci RSI, Moving Average, Ichimoku, Bollinger Bands Risk Warning Trading Forex, CFDs, Cryptocurrencies, Futures and Stocks involves the risk of loss. Please consider carefully whether this type of trading is suitable for you. Geçmiş performans, gelecekteki sonuçların göstergesi değildir. If you like our ideas, please your likes 👍 and with your comments support us.
pullbacksignal
Trading Signal For MUSDT

Trading Setup: A Trading Signal is seen in the MUSDT MemeCore (1h) (spot) Traders can open their Buy Trades NOW ⬆️Buy now or Buy on 1.59361 ⭕️SL @ 1.53772 🔵TP1 @ 1.71867 🔵TP2 @ 1.78673 🔵TP3 @ 1.91978 What are these signals based on? Classical Technical Analysis Price Action Candlesticks Fibonacci RSI, Moving Average , Ichimoku , Bollinger Bands Risk Warning Trading Forex, CFDs, Crypto, Futures, and Stocks involve a risk of loss. Please consider carefully if such trading is appropriate for you. Past performance is not indicative of future results. If you liked our ideas, please support us with your likes 👍 and comments .

mastercrypto2020
M USDT LONG SIGNAL

--- 📢 Official Trade Signal – M/USDT 📈 Position Type: LONG 💰 Entry Price: 1.3485 🛑 Stop-Loss: 1.3000 📊 Timeframe: 15m ⚙️ Suggested Leverage: 3× --- 🎯 Take-Profit Targets (Partial Exits): • TP1: 1.3893 • TP2: 1.4346 • TP3: 1.4844 • TP4: 1.5365 • TP5: 1.5954 --- 🧠 Technical Analysis Summary Price is reacting from a key support zone and showing bullish continuation signals on the lower timeframe. Market structure remains constructive, suggesting a potential continuation move to the upside. Targets align with previous resistance levels and liquidity zones, increasing the probability of reaching higher levels. --- ⚙️ Trade Management Rules ✔️ Take partial profit at TP1 (25–30%) ✔️ Move Stop-Loss to Break-Even after TP1 is hit ✔️ Secure profits at TP2 ✔️ Trail SL below Higher Lows as price moves toward higher targets ✔️ If price hits BE → No loss, capital protected --- ⚠️ Risk-Management Note Risk only 1–1.5% per trade Proper position sizing is mandatory Capital protection > everything --- 📌 TradingView Hashtags #MUSDT #CryptoSignal #LongSetup #TradingView #TechnicalAnalysis #Altcoins #RiskManagement ---

iMoneyTeam
M Sell/Short Setup (4H)
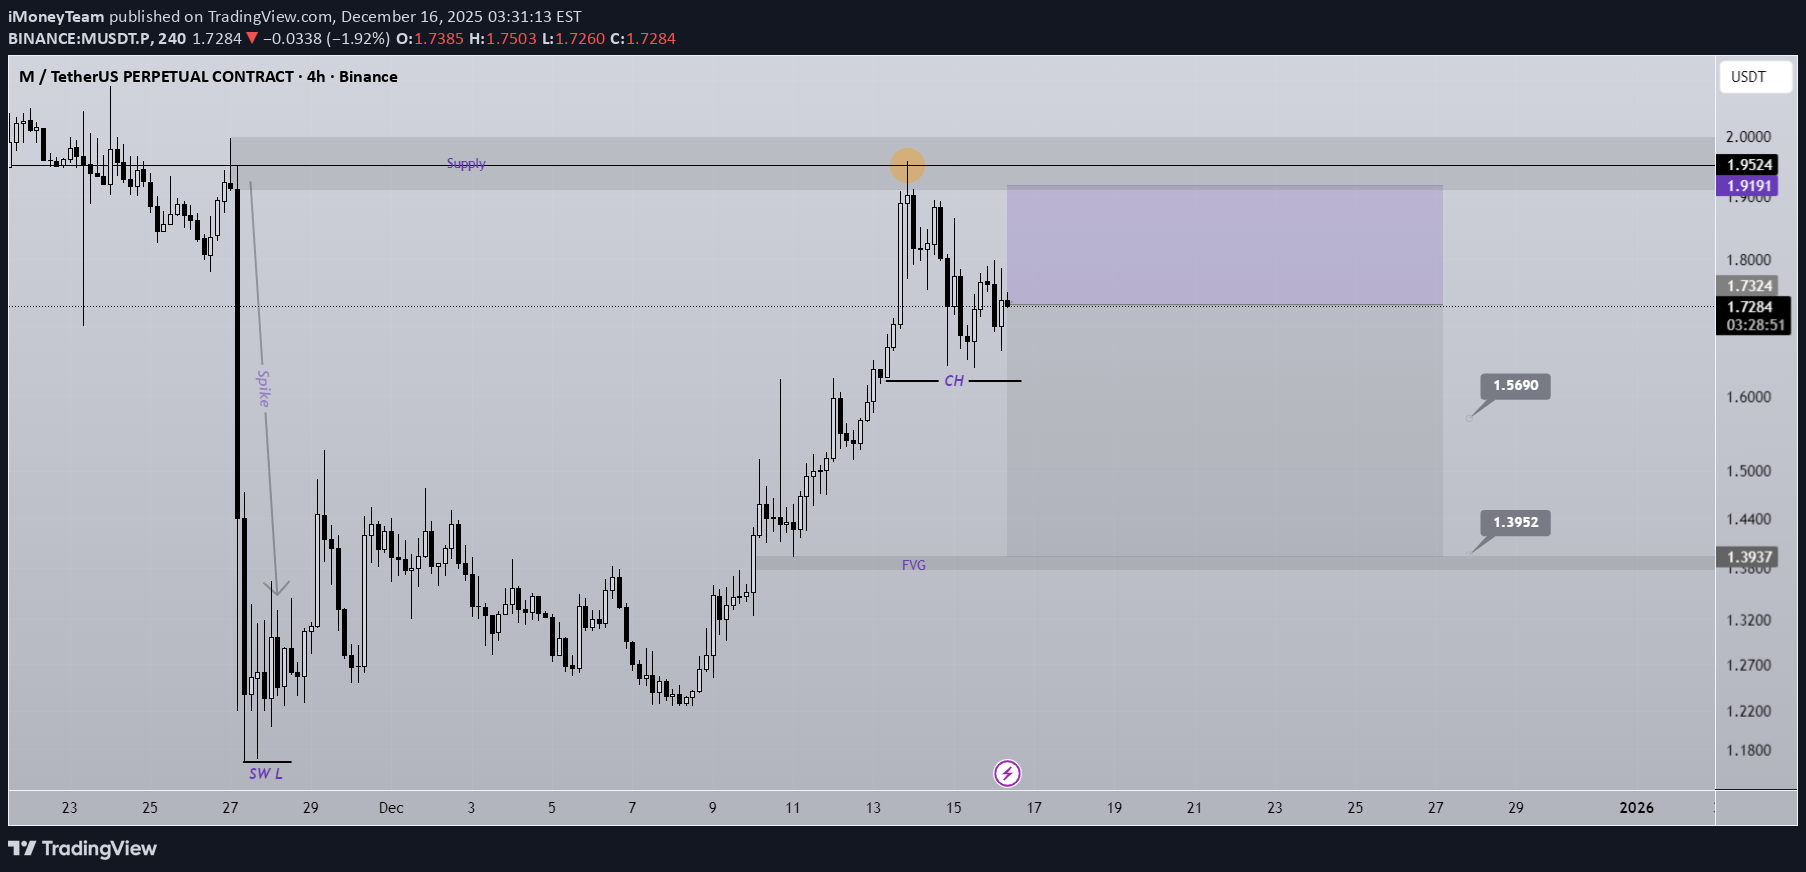
Considering the filling of the MUSDT price gap and the reaction to the originating order block, along with the formation of an FVG at the lower part of the chart, we can look for sell/short opportunities. Targets and stop loss are marked on the chart. At the first target, secure partial profits and move the stop loss to breakeven. Do not enter the position without capital management and stop setting Comment if you have any questions thank youThe first target has been hit .

ساختار AMD ارز MEME: آیا پول هوشمند برای پامپ آماده است؟ (اهداف تا ۷ دلار)
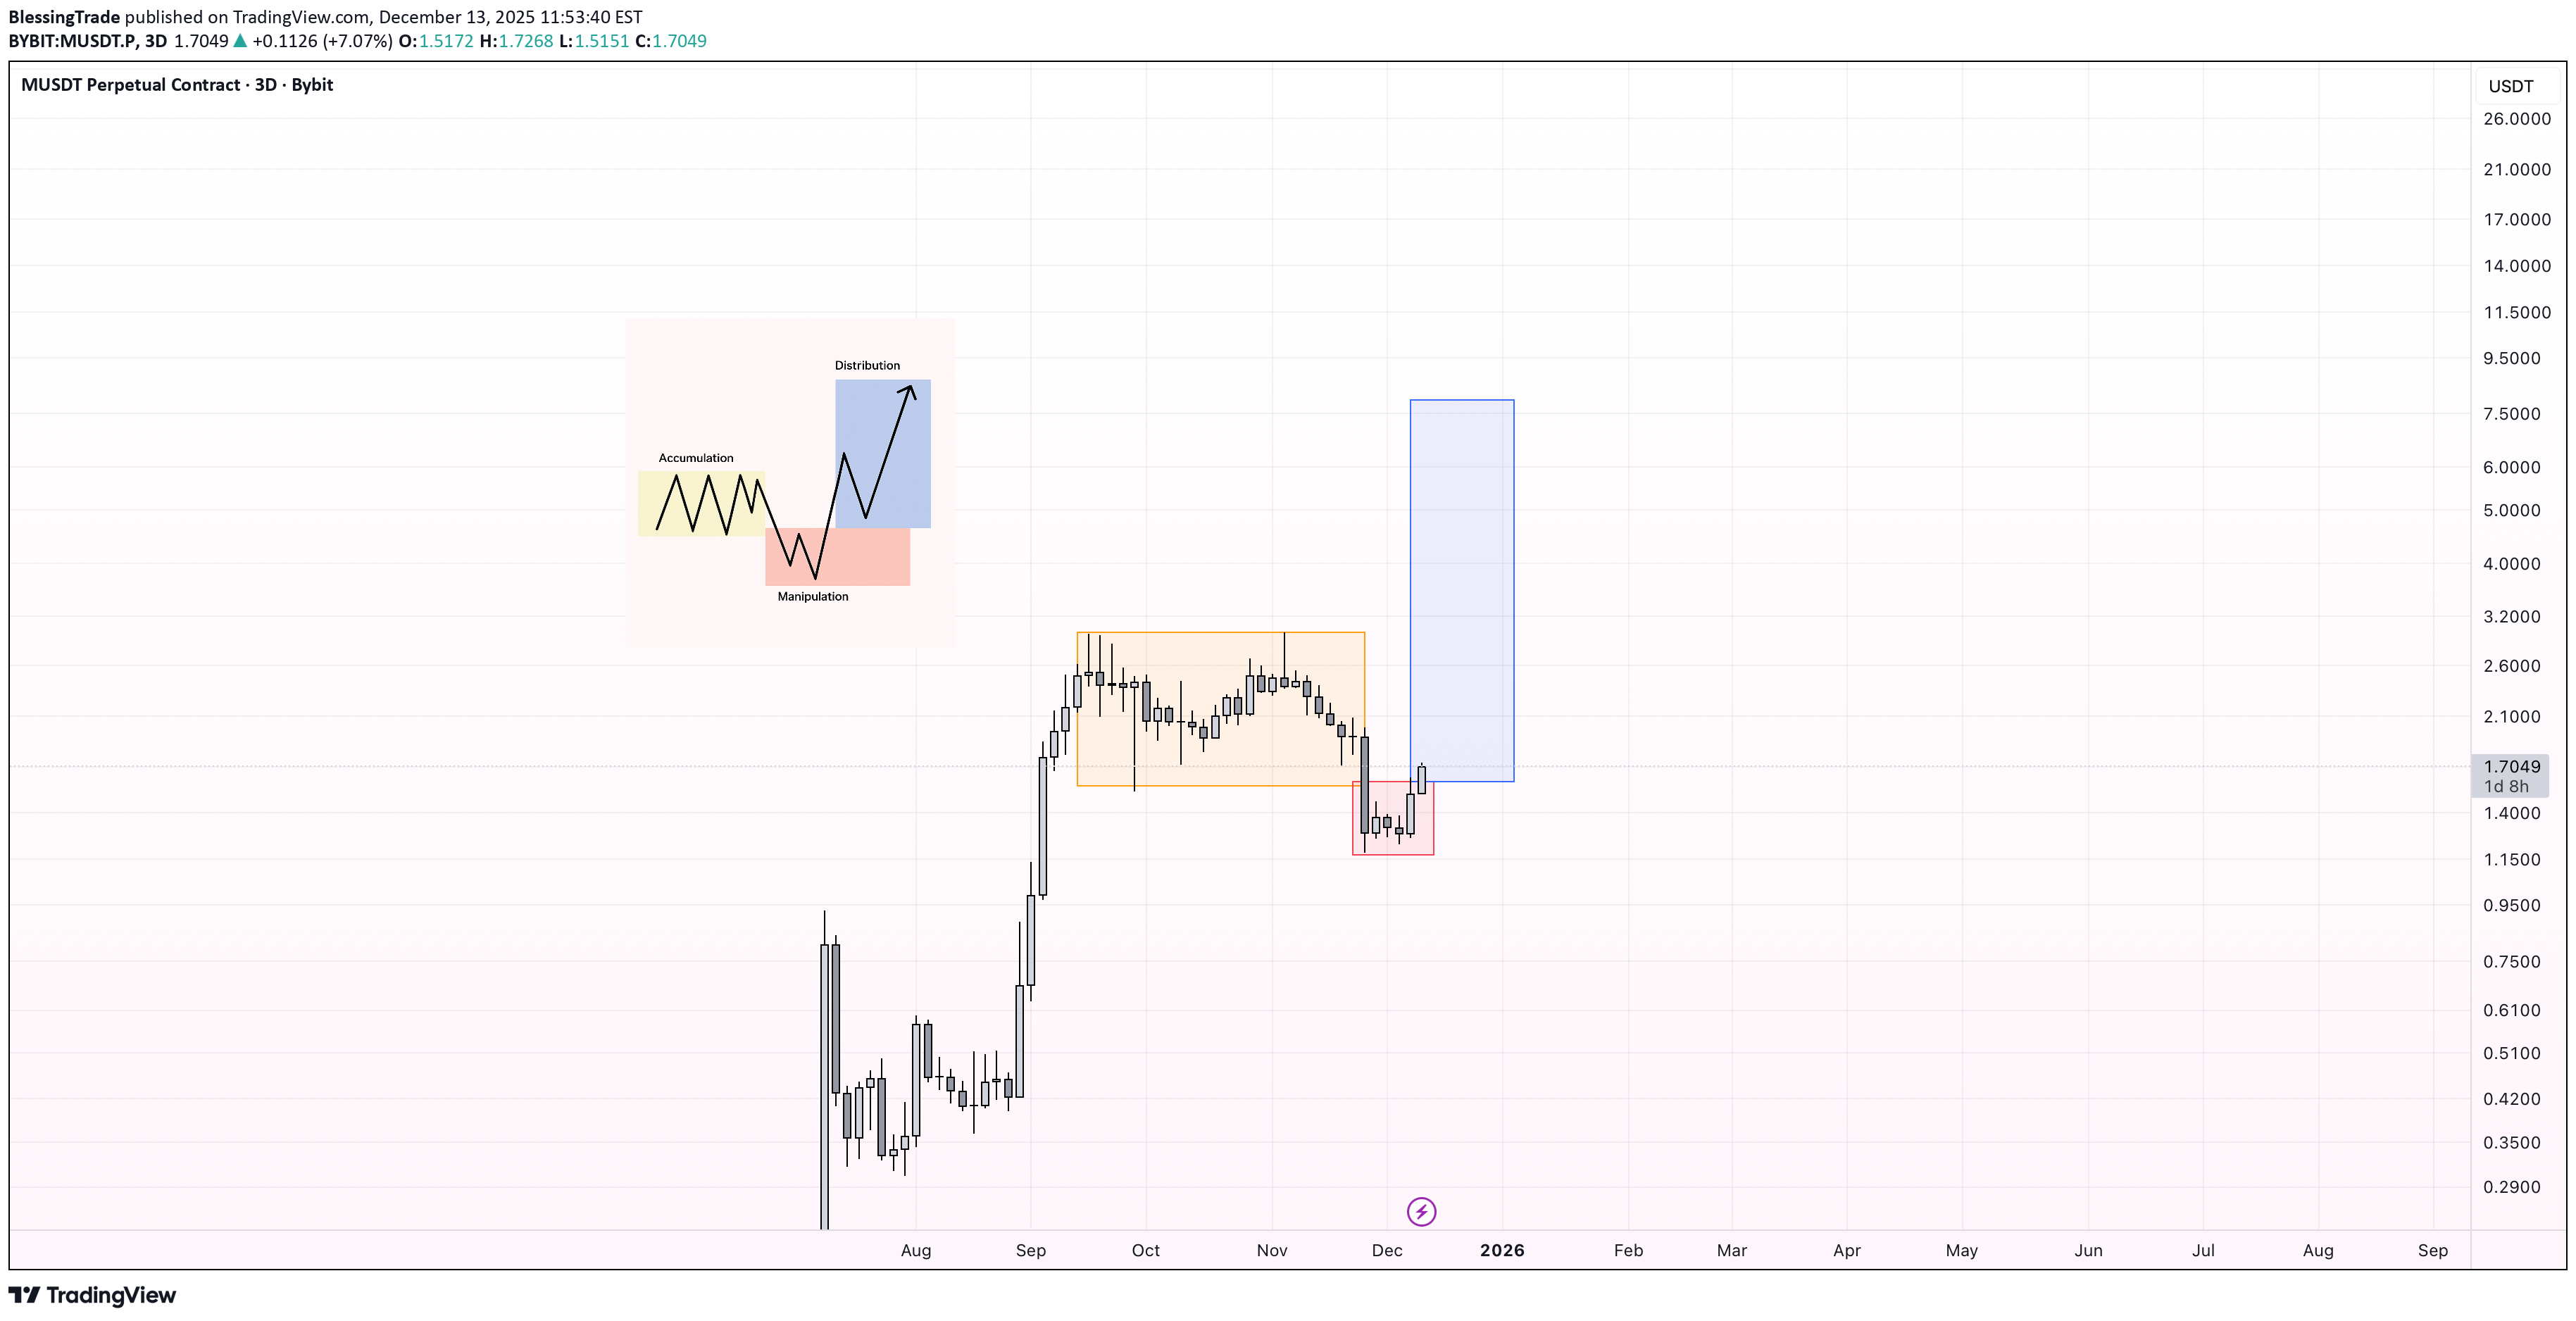
📊 Market Structure Overview Memecore is currently respecting a classic AMD (Accumulation → Manipulation → Distribution) structure on the higher timeframe. 🔹 Accumulation After the impulsive move up, price entered a prolonged range. During this phase, smart money was accumulating positions while retail participation faded and volatility compressed. 🔹 Manipulation (Liquidity Sweep) Price then performed a clean downside sweep, breaking below the range and triggering: Stop-losses of late longs Panic selling Aggressive short entries on the breakdown This move effectively reset market positioning, allowing large players to accumulate at discount prices. 🔹 Distribution / Markup Price quickly reclaimed the range and is now holding above the manipulation low — a strong sign that the breakdown was false. With ~90% of MEME supply concentrated in a few wallets, upside moves can be fast and violent due to thin liquidity above. This sets the stage for a strong distribution phase to the upside. 🎯 Price Targets $2.50 — First expansion target $5.00 — Mid-term distribution level $7.00 — Full distribution / macro target ⚠️ Invalidation A sustained breakdown and close below the manipulation low would invalidate the bullish scenario. 📌 Conclusion This setup reflects classic Smart Money behavior: Accumulation → Liquidity grab → Expansion into low-liquidity zones. As long as price holds structure, higher prices remain the primary scenario.

mehdishirian
سقوط آزاد M-USDT: از هدف سوم تا ضرر ۵۴ درصدی! (آخرین تحلیل و هشدار مهم)
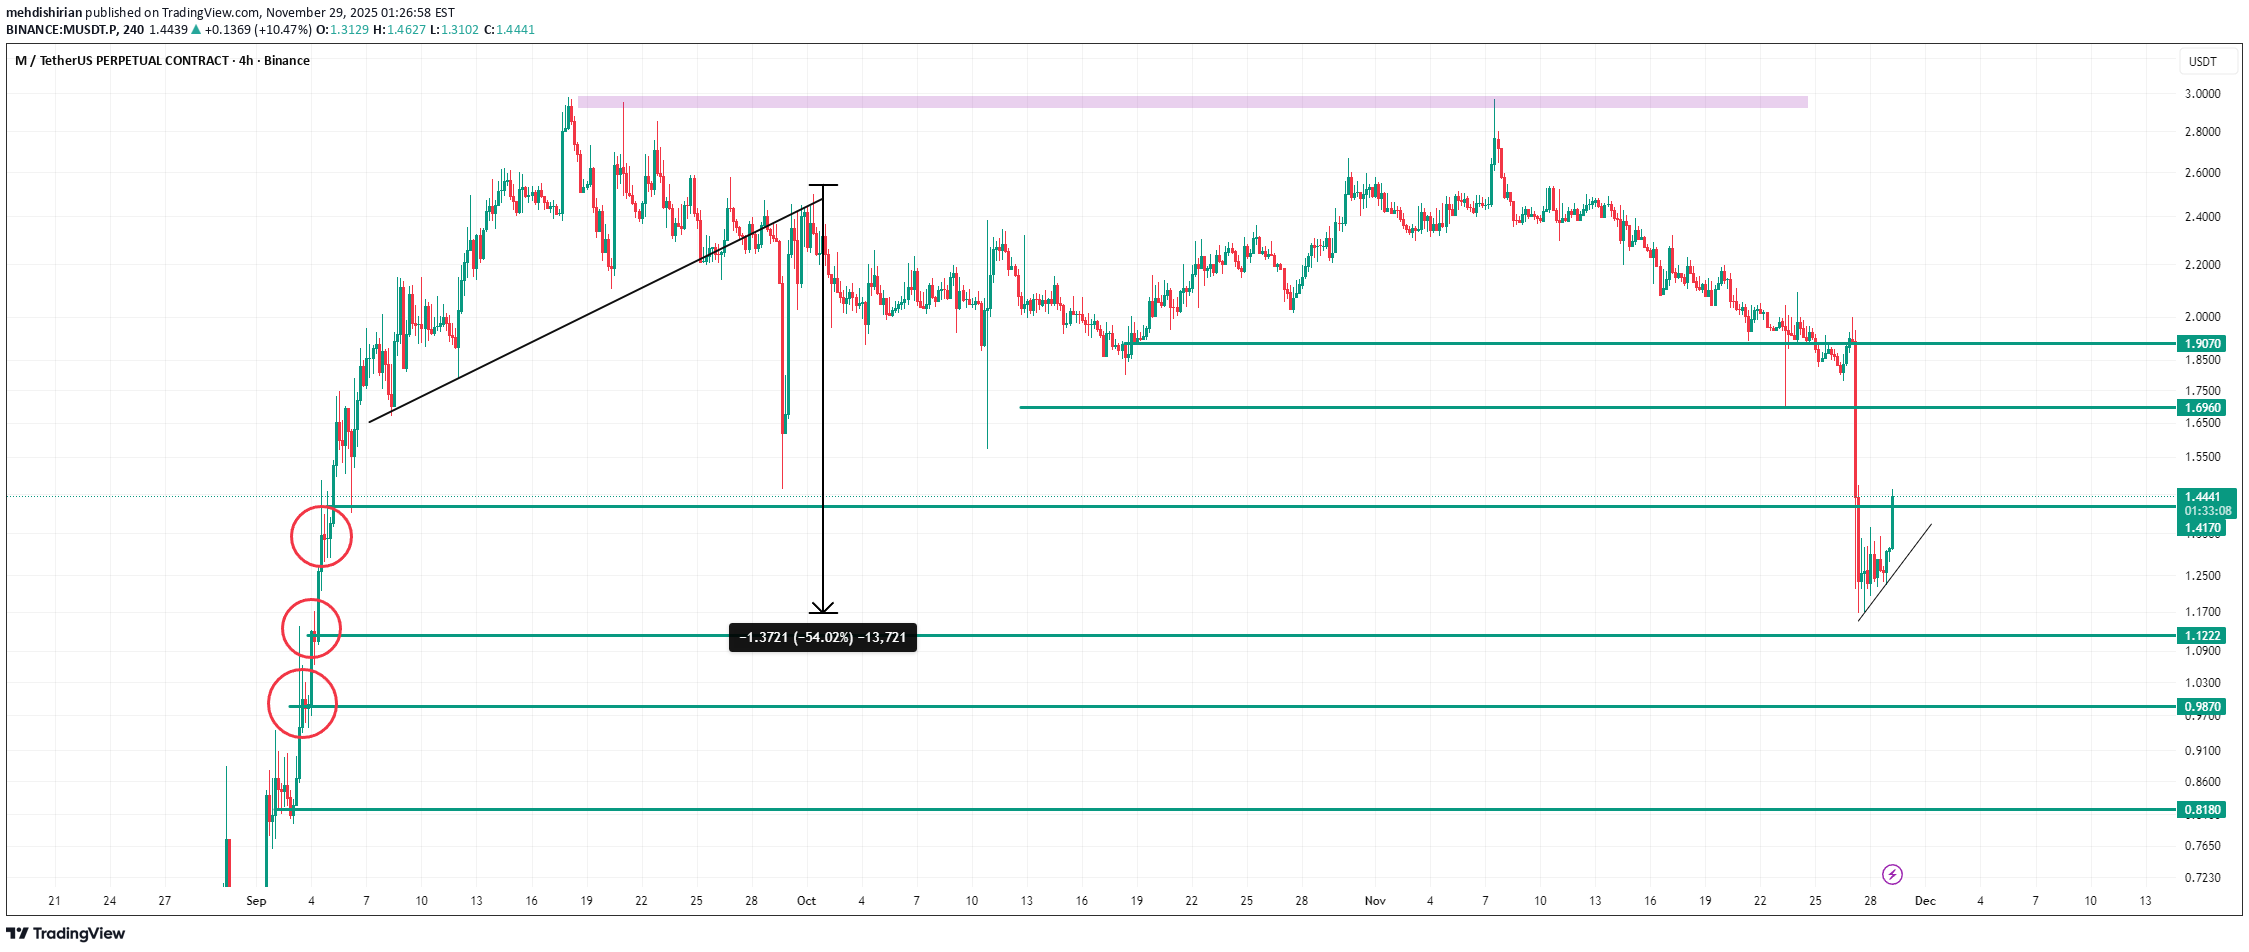
Hello everyone ❤️ I hope you are well 😍 💁♂️ The last update we made for the M- USDT cryptocurrency had reached the third target and had fallen close to the fourth target. After reaching the third target, the price moved up and started falling again. This time, the fourth target was touched and we have experienced a 54% fall so far 🔥🔥🔥🔥 It was not very accurate and did not go as I expected, but the downward trend was well recognized. 💁♂️ It seems that lower targets will also be available ⚠️The analysis may not reach the final target, so at each target, if you make a good profit and see signs of a trend change, you can exit the trade or manage your capital. ⚠️ None of the analysis is a recommendation to buy or sell, but simply my personal opinions on the charts. You can use the charts and choose any that interest you and take a position if you wish. To support me, I would appreciate it if you boost the analysis and share it with your friends so that I can analyze it with more energy for you, my dears. Thank you all. 💖
pullbacksignal
سیگنال خرید فوری MUSDT: استراتژی معاملاتی با تحلیل تکنیکال قوی (اهداف و حد ضرر اعلام شد)

Trading Setup: A Trading Signal is seen in the MUSDT MemeCore (Futures) (1h) Traders can open their Buy Trades NOW ⬇️ Sell now or sell on 2.22 ⭕️SL @ 2.34 🔵TP1 @ 1.96 🔵TP2 @ 1.87 🔵TP3 @ 1.72 What are these signals based on? Classical Technical Analysis Price Action Candlesticks Fibonacci RSI, Moving Average , Ichimoku , Bollinger Bands Risk Warning Trading Forex, CFDs, Crypto, Futures, and Stocks involve a risk of loss. Please consider carefully if such trading is appropriate for you. Past performance is not indicative of future results. If you liked our ideas, please support us with your likes 👍 and comments .✅ MUSDT MemeCore (Futures) (1h) TP1 hit Technical Analysis Update — The price has reached the target, traders can close part of the trade in profit.

AlienOvichO
تحلیل تکنیکال MUSDT: فرصت خرید در کف قیمت و پرواز به سمت ۳.۹۰ دلار!
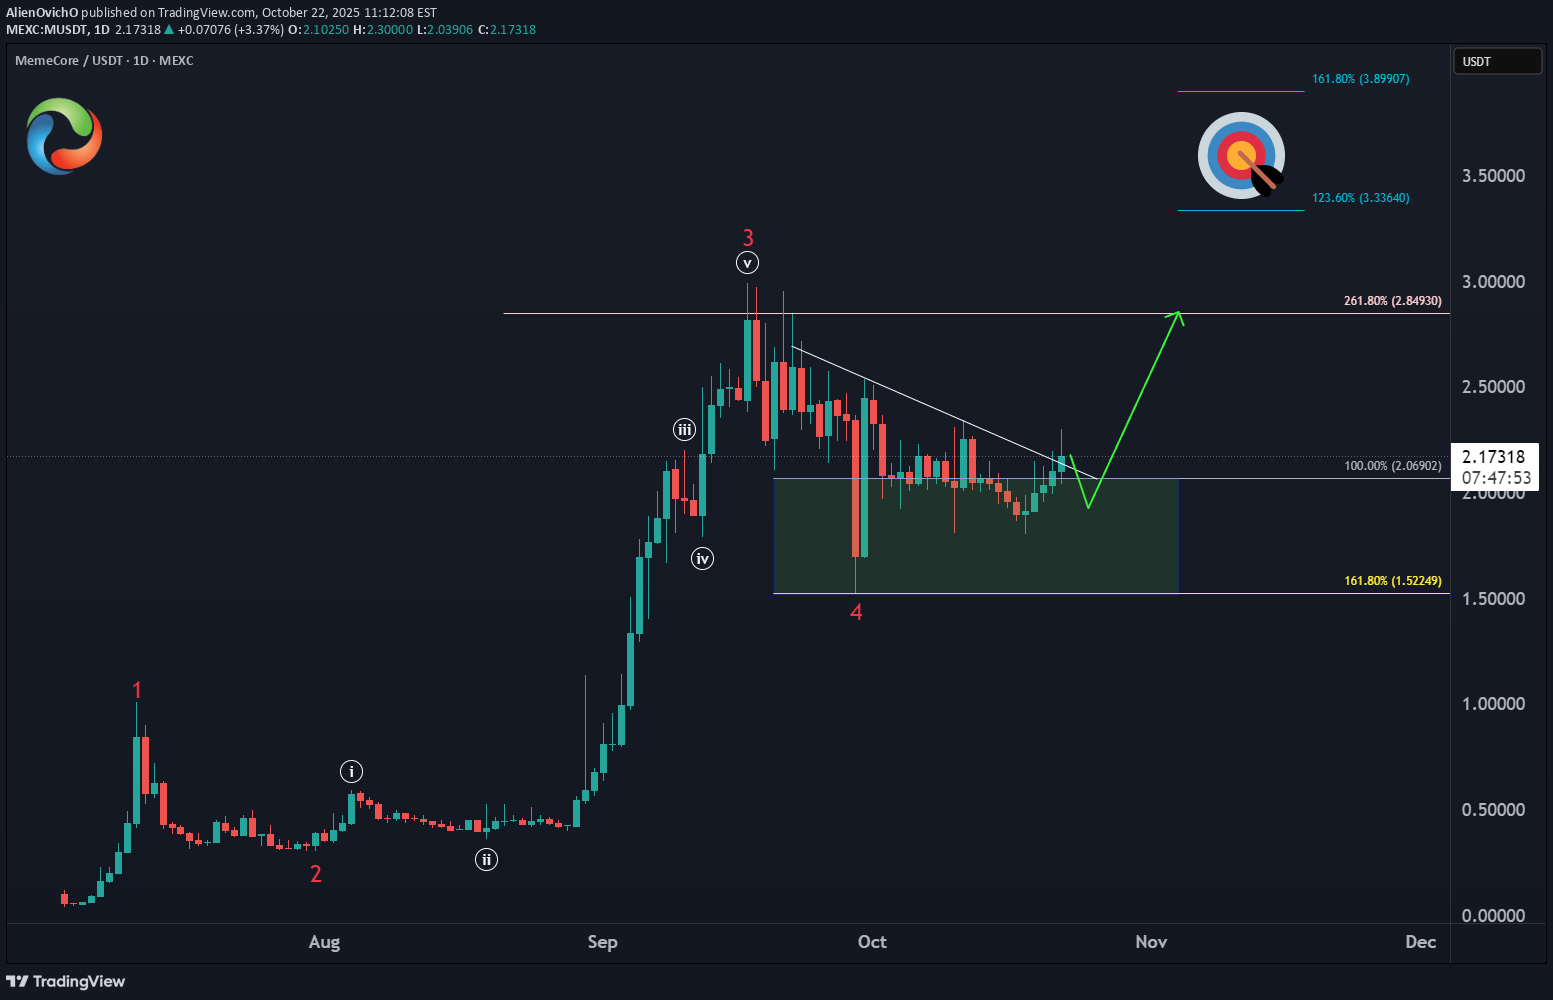
MUSDT consolidated throughout October, dipping into the buying zone and now holding above the key support at $1.52. As long as this level remains intact, the setup favors a resumption of the rally toward new highs, with bullish momentum building beneath the surface. 🚀 Next advance will be toward the $3.33–$3.90 zone, which could mark the completion of wave 5 in the current bullish sequence. Once this impulsive leg wraps up, expect a larger degree correction to follow, offering potential re-entry opportunities for trend traders.

SatochiTrader
میمکور (MEMECORE) در آستانه صعود: آیا مقاومت ۲.۳۴ دلار شکسته میشود؟
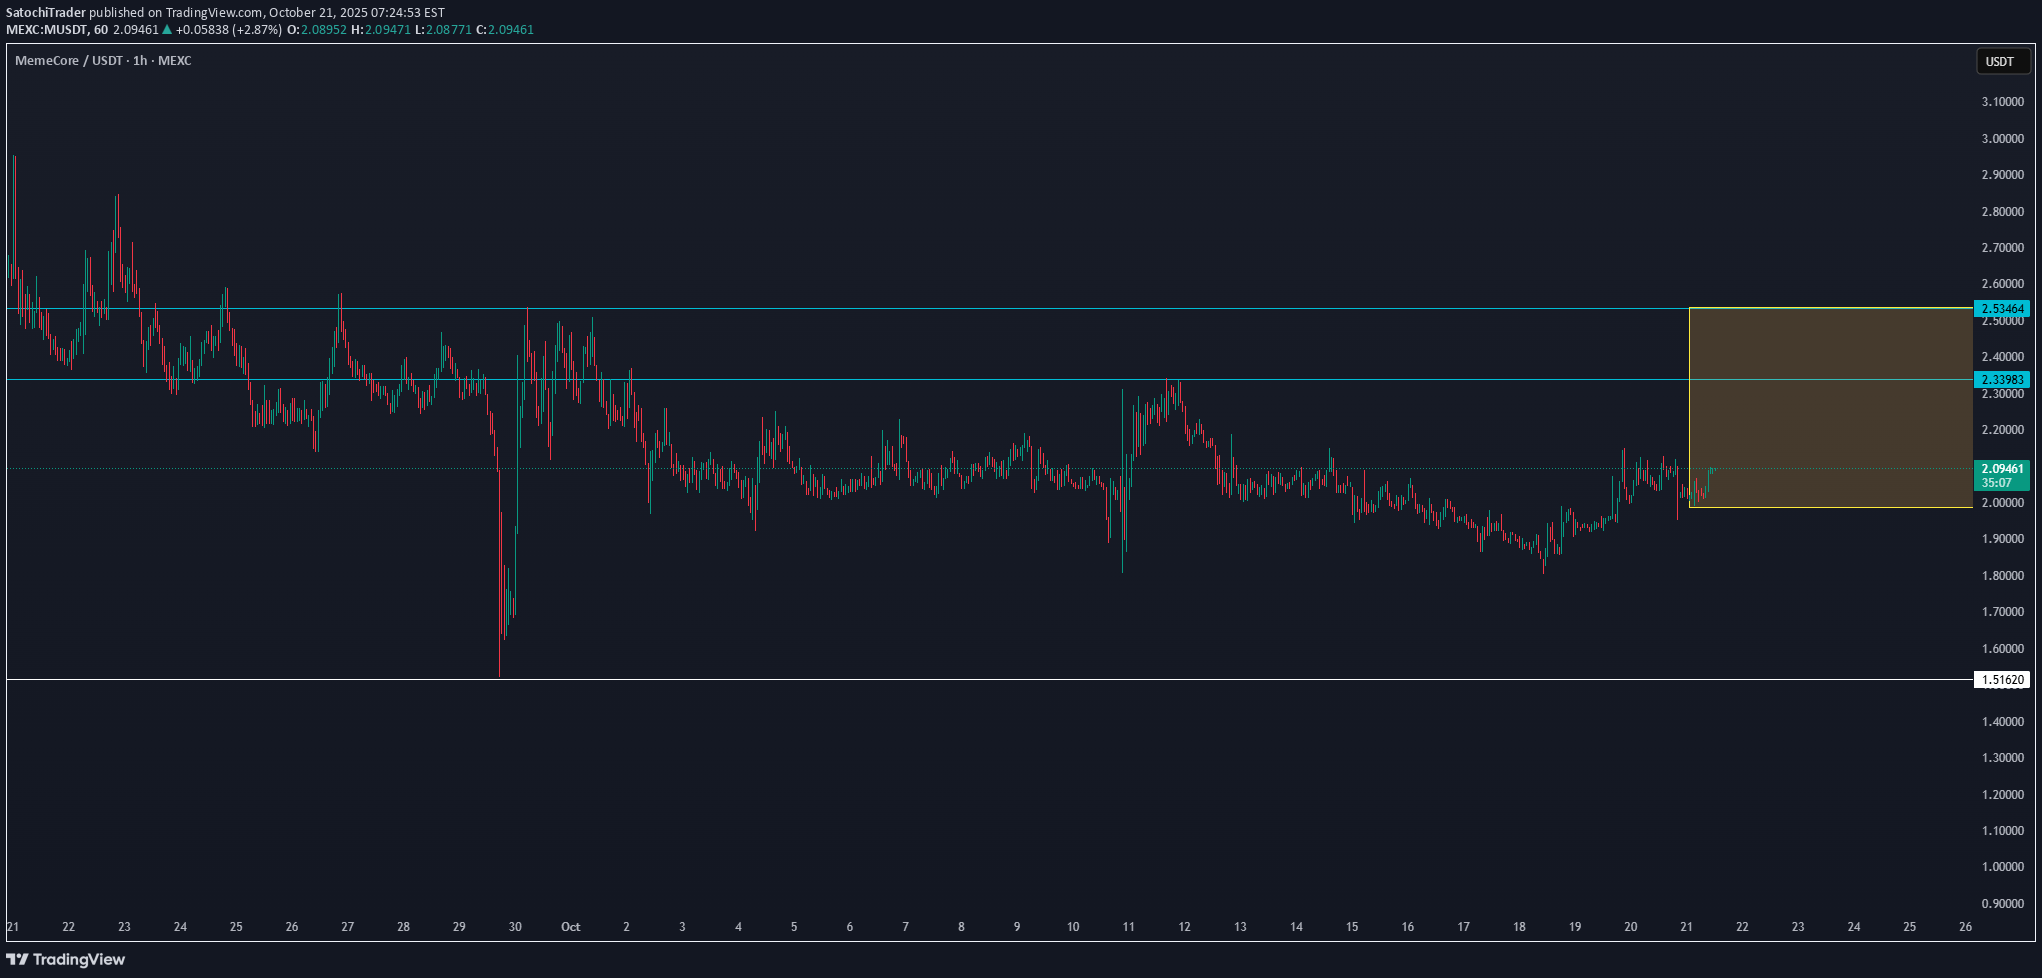
MEMECORE has shown a steady rebound from the lower range near $2.00, regaining short-term momentum as it attempts to reclaim the $2.34 zone, which has acted as a strong resistance multiple times. A confirmed breakout above $2.34 would signal a shift in momentum and open the path toward the range high at $2.53, where the next major liquidity zone sits. 📊 Technical Overview: Range Support: $2.00 Range Resistance: $2.34 Breakout Target: $2.53 Bias: Neutral → Bullish above $2.34 If MEMECORE continues to hold above the $2.00 base with rising volume, the structure suggests potential for a range breakout and short-term trend reversal. 📈 Outlook: Building strength inside range 🎯 Targets: $2.34 → $2.53

WaveRiders2
سیگنال مهم لحظهای $M: آماده شکستن مقاومت قرمز یا سقوط؟

📊 $M Update $M is testing the red resistance zone 🔴 If it breaks out, the first target will be the blue line level 🎯 Watch closely for confirmation before entering — momentum could build fast ⚡
Disclaimer
Any content and materials included in Sahmeto's website and official communication channels are a compilation of personal opinions and analyses and are not binding. They do not constitute any recommendation for buying, selling, entering or exiting the stock market and cryptocurrency market. Also, all news and analyses included in the website and channels are merely republished information from official and unofficial domestic and foreign sources, and it is obvious that users of the said content are responsible for following up and ensuring the authenticity and accuracy of the materials. Therefore, while disclaiming responsibility, it is declared that the responsibility for any decision-making, action, and potential profit and loss in the capital market and cryptocurrency market lies with the trader.