
IP
Story
| تریدر | نوع سیگنال | حد سود/ضرر | زمان انتشار | مشاهده پیام |
|---|---|---|---|---|
No results found. | ||||
Price Chart of Story
سود 3 Months :
سیگنالهای Story
Filter
Sort messages by
Trader Type
Time Frame

Bithereum_io
تحلیل تکنیکال IPUSDT: آیا سقوط در گوه ادامه دارد یا سقفها شکسته میشوند؟
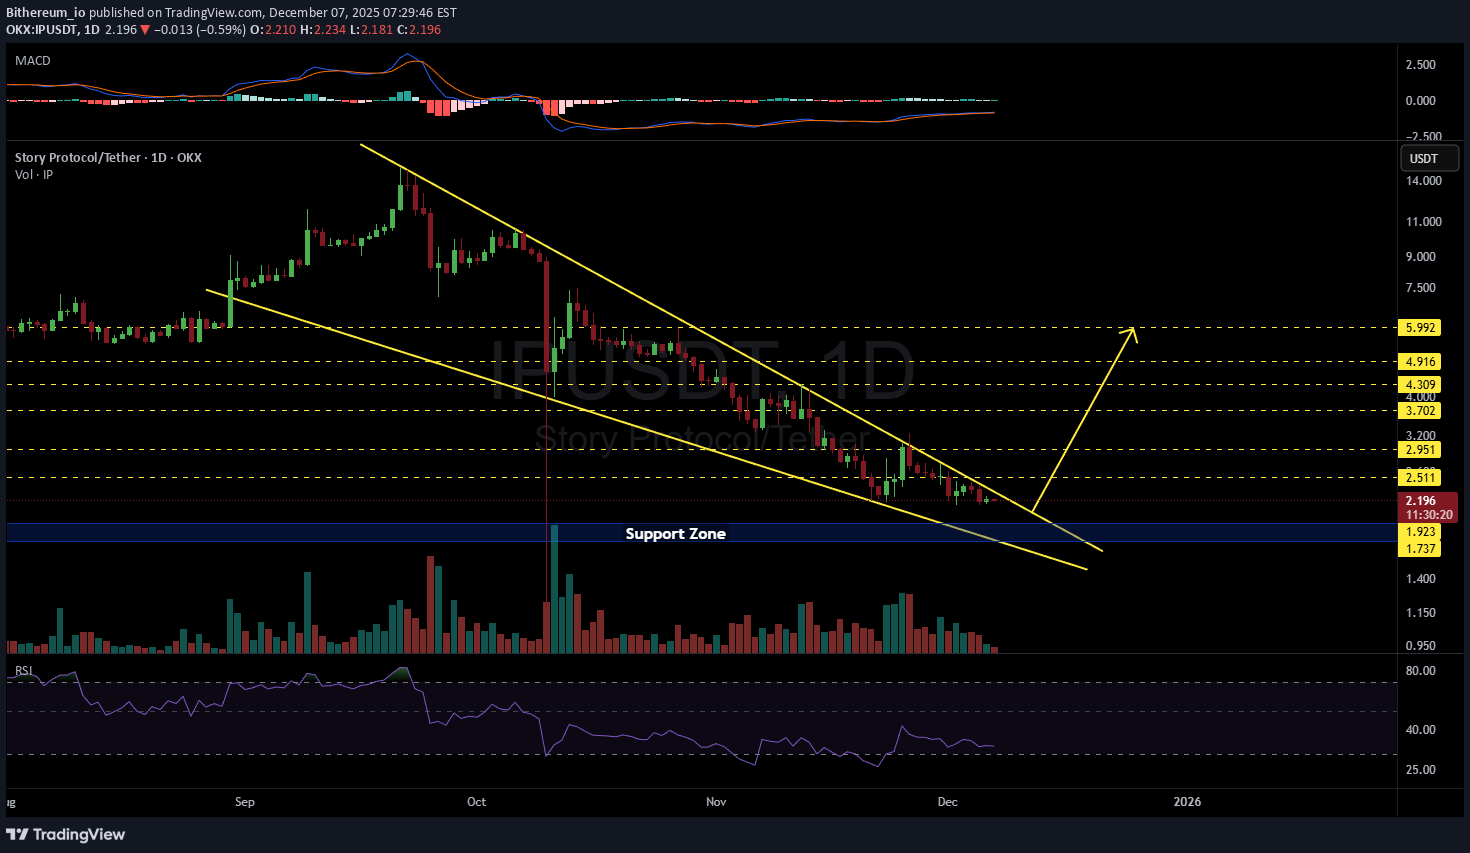
#IP is moving inside a falling wedge pattern on the daily timeframe. Due to the lack of volume, there is a chance we may retest the support zone one more time. In case of a breakout above the wedge, the potential targets are: 🎯 $2.511 🎯 $2.951 🎯 $3.702 🎯 $4.309 🎯 $4.916 🎯 $5.992 ❌ Invalidation: a daily candle closing below the wedge. ⚠️ Always remember to use a tight stop-loss and maintain proper risk management.

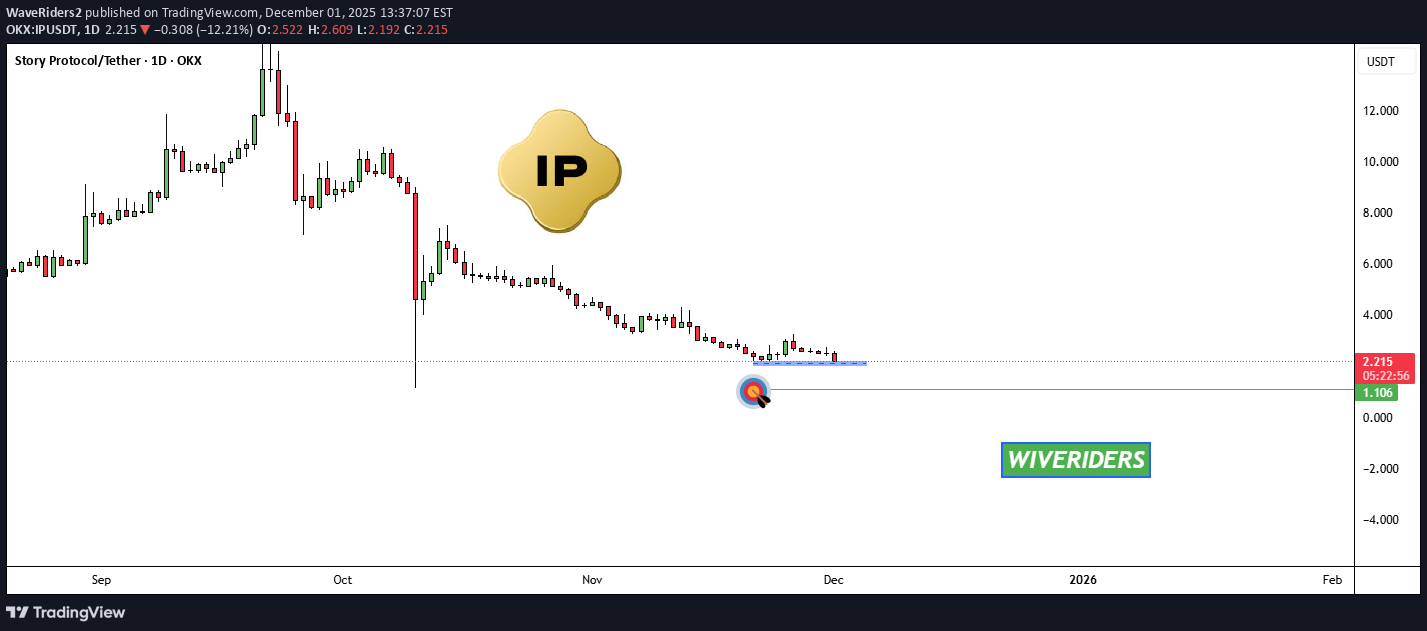
WaveRiders2
تحلیل فوری بیتکوین: آمادهسازی برای ریزش؟ سطح حمایت کلیدی شکسته میشود!

DakuNit
رشد انفجاری IP: آیا آماده پامپ بزرگ بعدی هستیم؟ (تحلیل و پیشبینی)


MadWhale
Story IP Testing Key Support, Could Surge 32% Target 11.4$
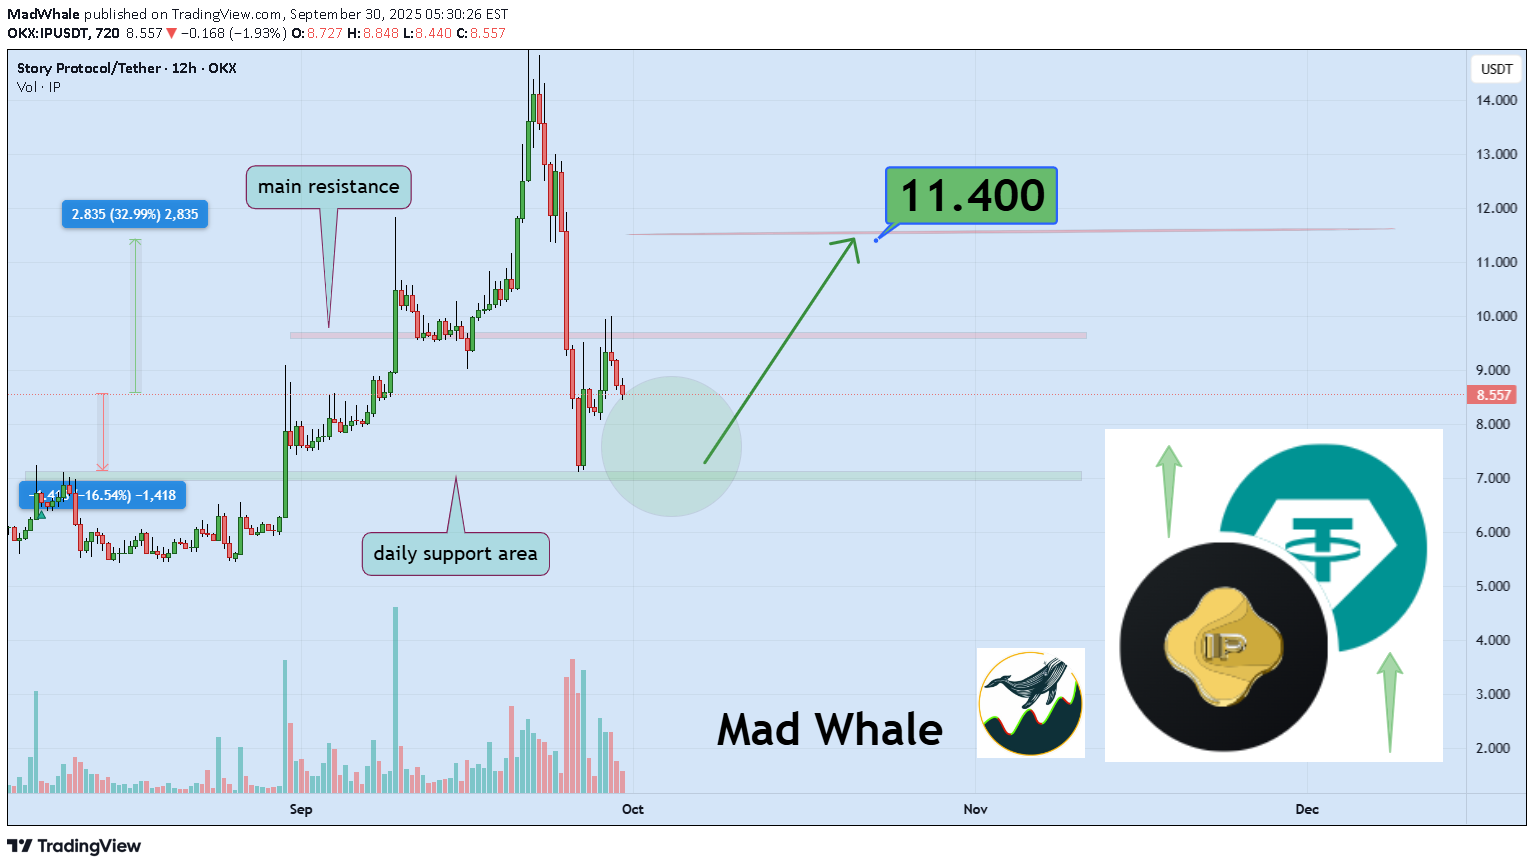
Hello✌️ Let’s analyze Story’s price action both technically and fundamentally 📈. 🔍Fundamental analysis: Story (IP) is pushing into tokenized AI training data and winning big partners. Institutions are noticing, but weak on-chain revenue raises some valuation doubts.🧩📊 📊Technical analysis: IPUSDT is testing a key daily support; holding this zone could trigger a 32% rally, targeting $11.40. 📈🛡️ 📈Using My Analysis to Open Your Position: You can use my fundamental and technical insights along with the chart. The red and green arrows on the left help you set entry, take-profit, and stop-loss levels, serving as clear signals for your trades.⚡️ Also, please review the TradingView disclaimer carefully.🛡 ✨We put love into every post! Your support inspires us 💛 Drop a comment we’d love to hear from you! Thanks, Mad Whale

behdark
IP Sell/Short Setup (12H)

A key trendline has been broken, and on the chart, along with a bearish CH, we’ve also seen a sweep of a support zone. The price is expected to drop downward upon reaching the order block. The target could be the green line. A candle closing above the invalidation level would invalidate this analysis. For risk management, please don't forget stop loss and capital management When we reach the first target, save some profit and then change the stop to entry Comment if you have any questions Thank You

The_Traders_House
IPUSDT: short setup from daily support at 8.378

A very sharp decline in the IPUSDT.P was stopped at the 8.414 level. Usually, the natural reaction to such a drop is a correction, but we are not observing one here. It is precisely this lack of a correction that is drawing my attention. On the downside (for a short scenario), there is a consolidation zone that formed from Aug 30th to Sept 7th, which is a heavy area that could be difficult to break through. Additionally, the asset has already covered a significant distance today, and there might simply not be enough energy left for a breakout. Therefore, I will be watching very closely how exactly the price approaches this level. Key factors for this scenario Correlation with the market Volatility contraction on approach Momentum stall at the level No reaction after a false break Was this analysis helpful? Leave your thoughts in the comments and follow to see more.Trade Setup: Entry: 8.342 Stop-Loss (SL): 8.471 The idea is valid as long as the price has not hit the stop-loss level.Okay, you need to keep your finger on the pulse here. The asset could go for a breakout of the level now, as the price is right near it, or it could pull back and consolidate for a few more hours. So, I am watching closely. Publishing entry and exit points in this format is inconvenient, so I'm stopping that.

Ener-traders
IP BEARISH
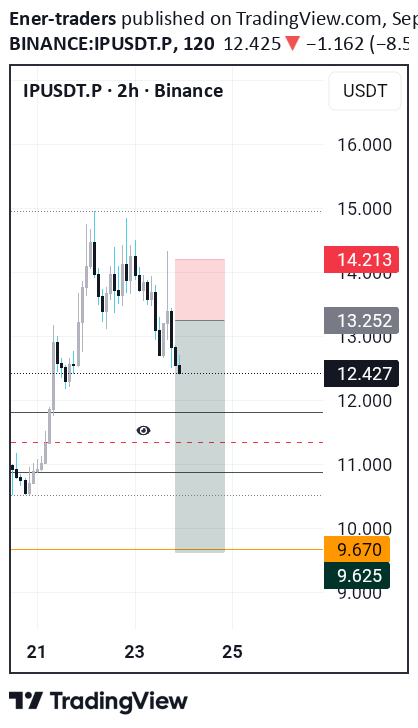
IP needs correction for a healthy growth and I do think that you should've taken some profit

patrick0134
IP/USDT Bounced to 0.382fibb
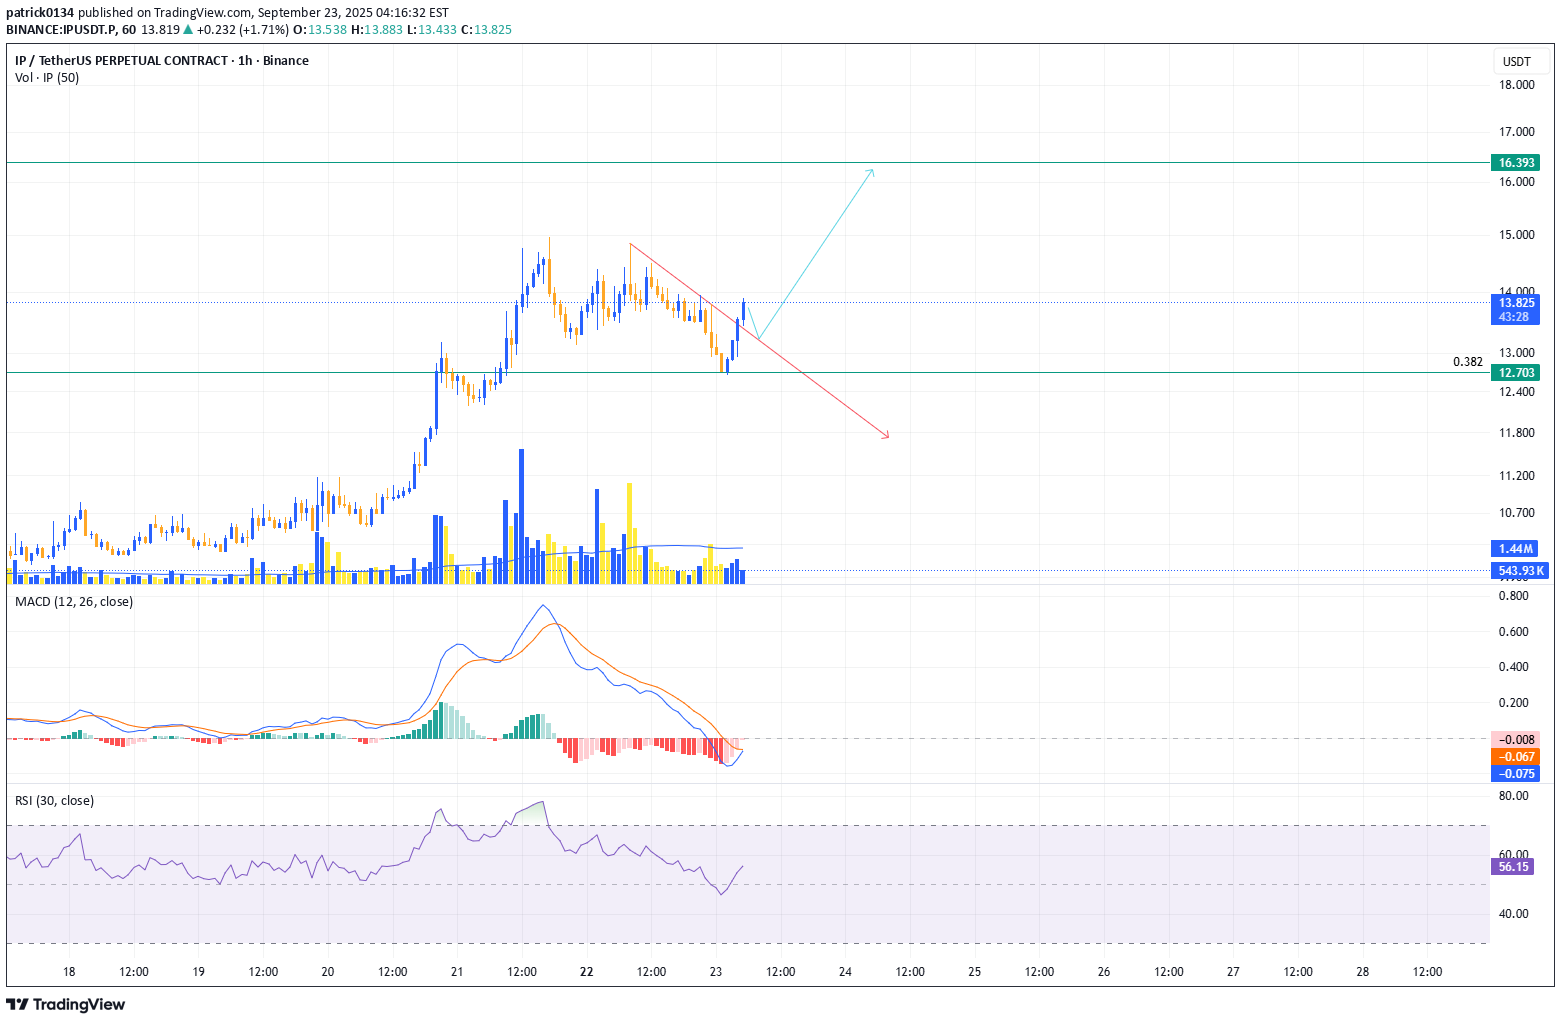
My Journal Entry #3. After an intraday shorting, IPUSDT.P bounced at 382 Fibb, I have changed my bias to long and targeting 16 area. Im hoping it retraces abit so i could find a good long entry.
patrick0134
Shorted IP/USDT
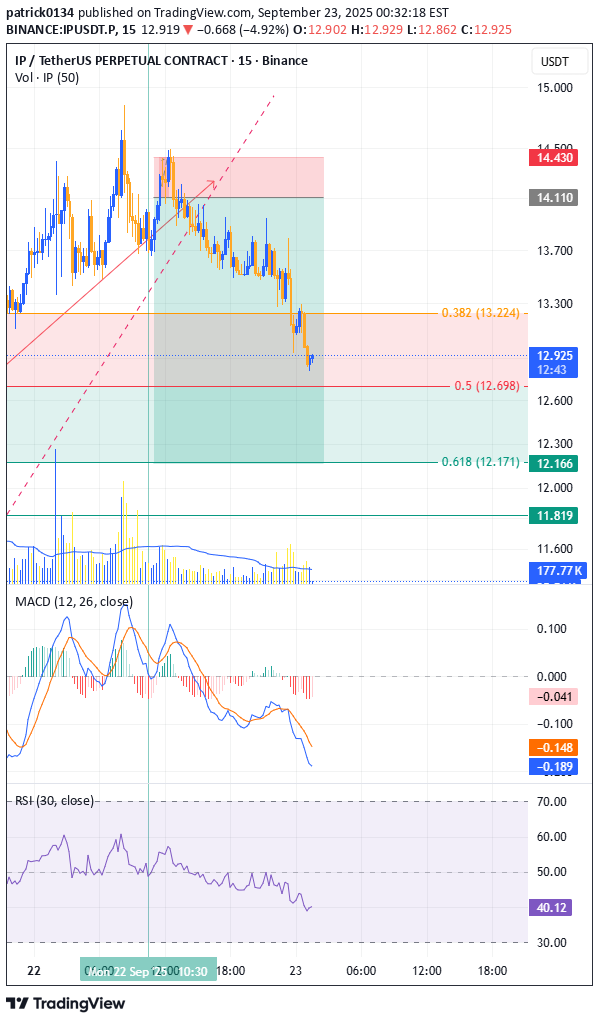
IP has been pumping since the other day, and it has shown a bearish divergence yesterday showing a probable breakdown.

Will IP dump?
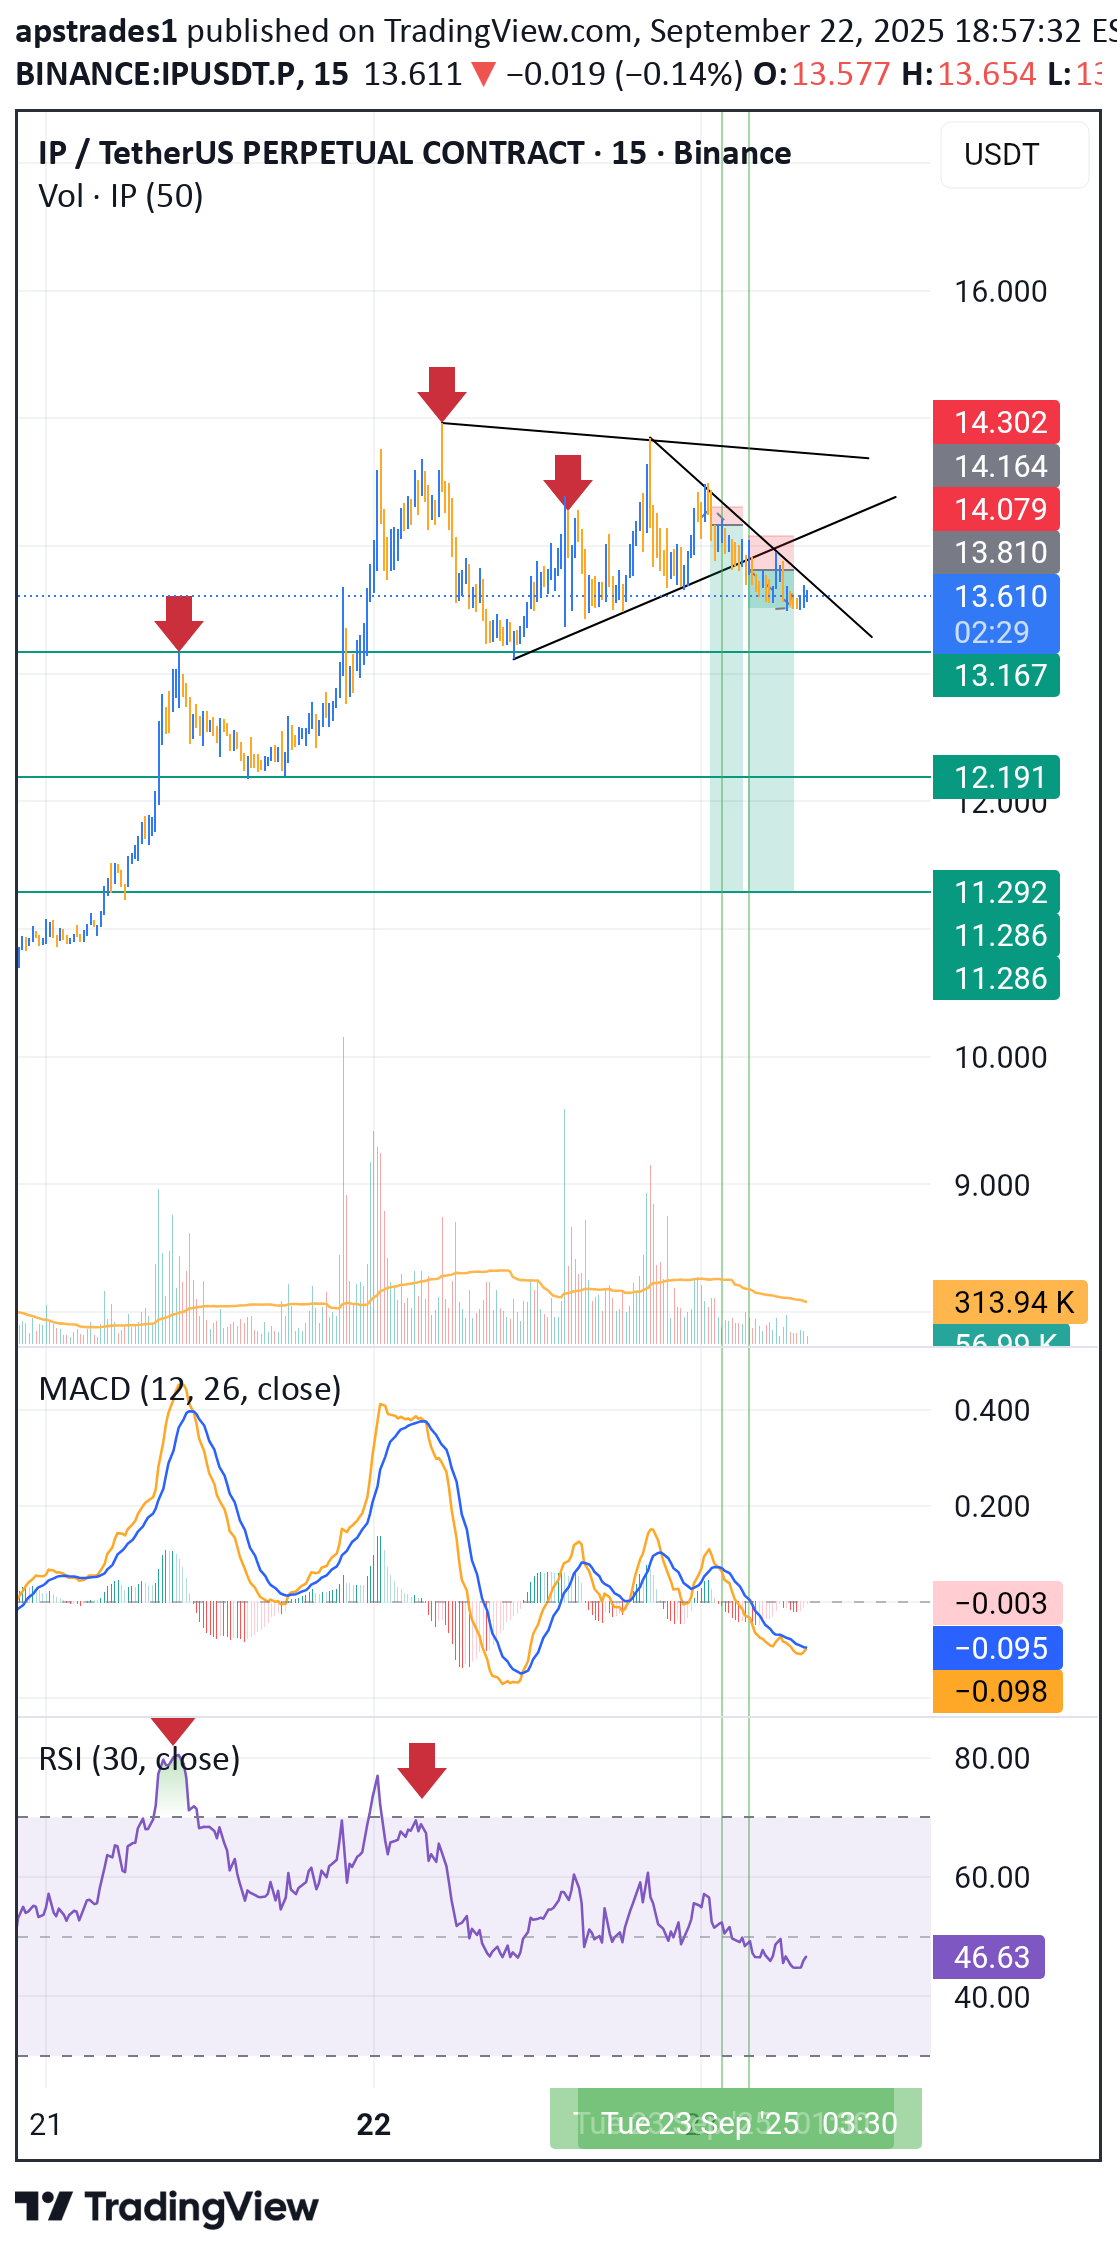
The chart shows a bearish signs, hoping to earn some gain for UPtomber 😜
Disclaimer
Any content and materials included in Sahmeto's website and official communication channels are a compilation of personal opinions and analyses and are not binding. They do not constitute any recommendation for buying, selling, entering or exiting the stock market and cryptocurrency market. Also, all news and analyses included in the website and channels are merely republished information from official and unofficial domestic and foreign sources, and it is obvious that users of the said content are responsible for following up and ensuring the authenticity and accuracy of the materials. Therefore, while disclaiming responsibility, it is declared that the responsibility for any decision-making, action, and potential profit and loss in the capital market and cryptocurrency market lies with the trader.