
ID
SPACE ID
| تریدر | نوع سیگنال | حد سود/ضرر | زمان انتشار | مشاهده پیام |
|---|---|---|---|---|
No results found. | ||||
Price Chart of SPACE ID
سود 3 Months :
سیگنالهای SPACE ID
Filter
Sort messages by
Trader Type
Time Frame

sladkamala123
افت شدید قیمت ID: چرا خریداران قدرت ندارند و فروشندگان بازار را در دست گرفتهاند؟
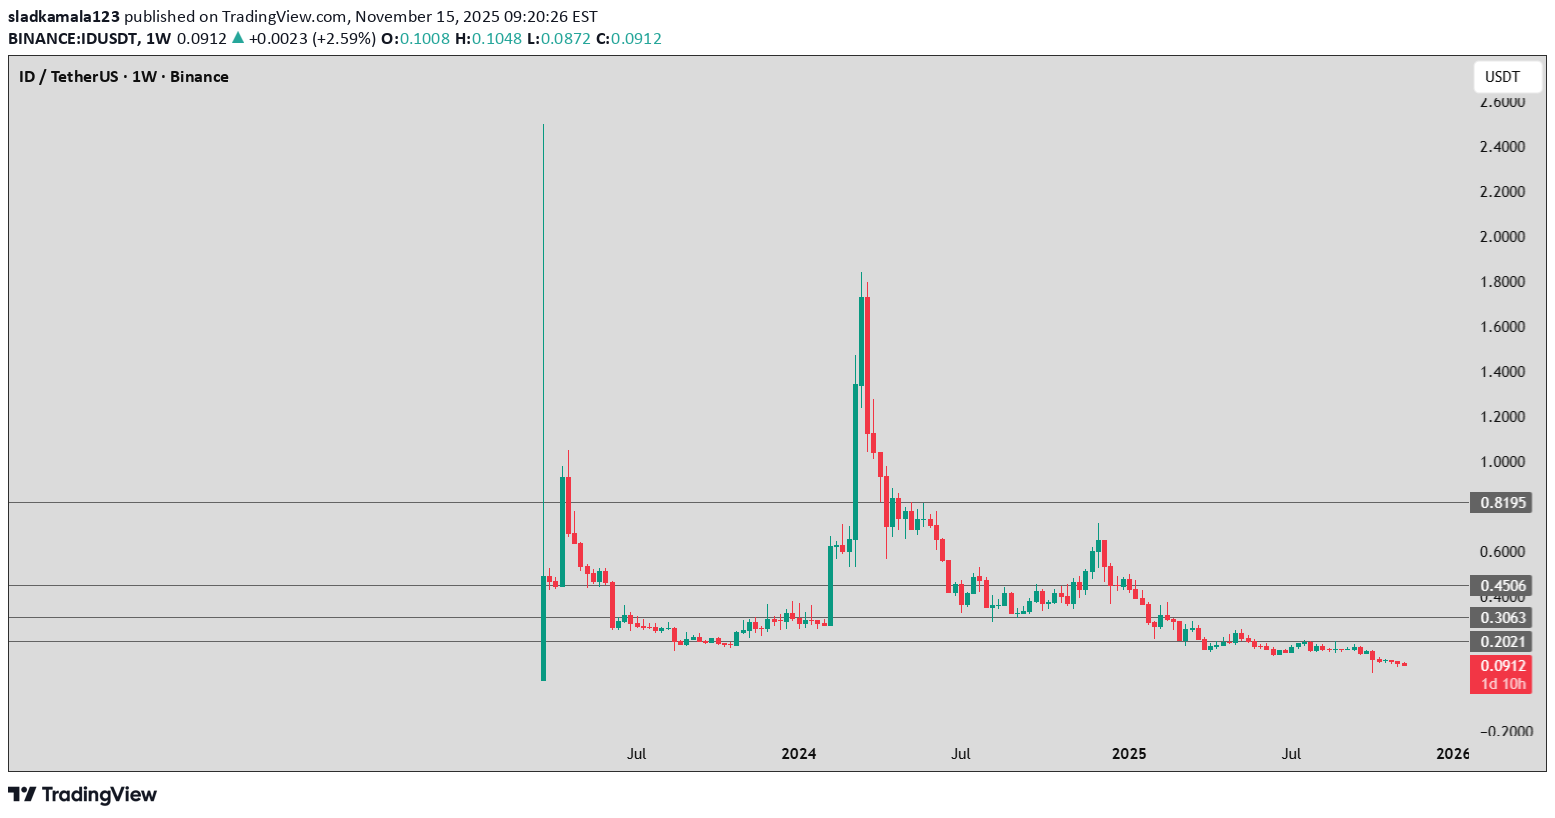
ID is in a clear and strong bearish trend — the price has been falling for more than a year. No higher lows have formed, which means buyers are showing no strength. The candles are small and red → low volume + selling pressure dominance. Additionally, large upward “spike” wicks are visible, which usually indicate: 👉 a liquidity grab → followed by a drop.

CryptoNuclear
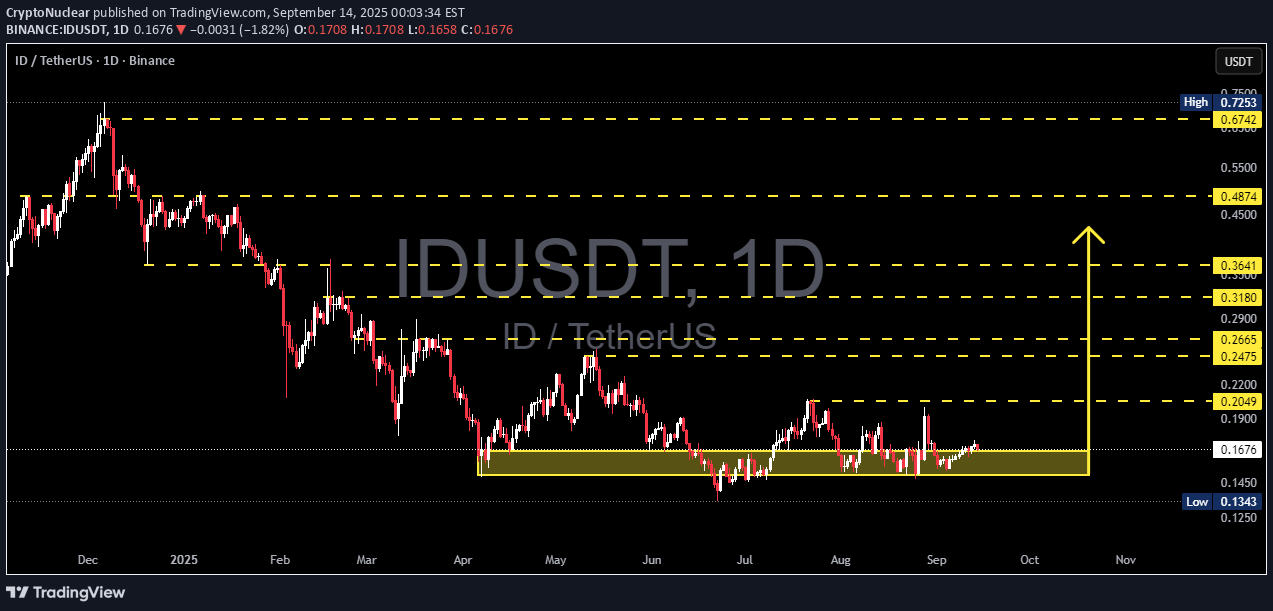
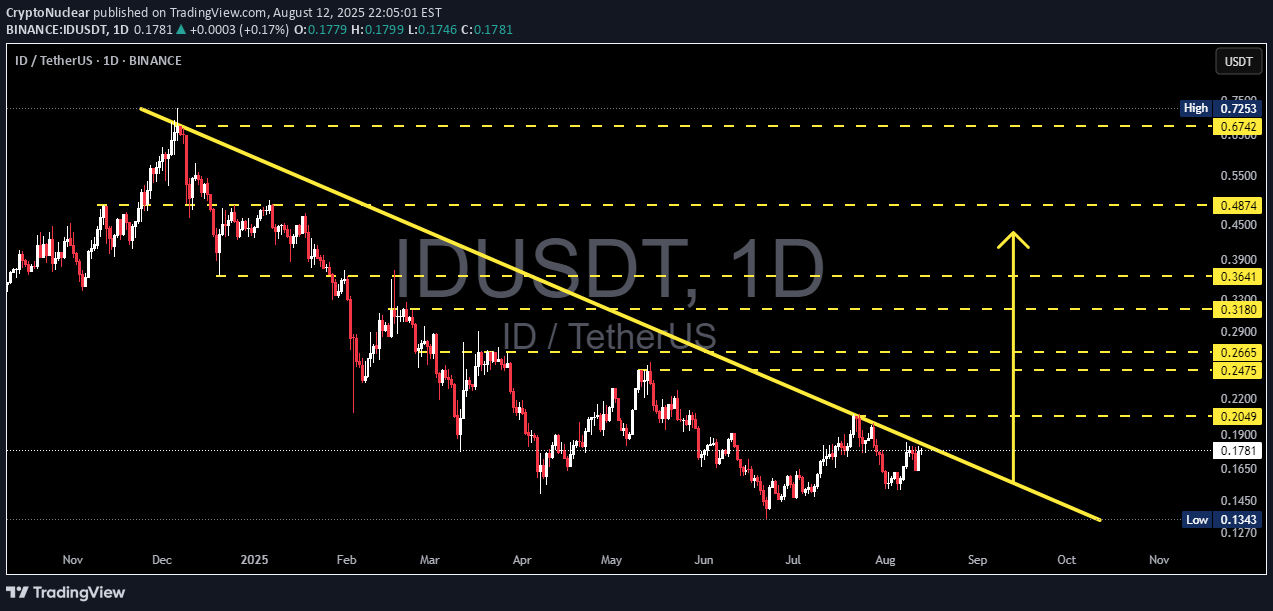
IDUSDT در نقطه حساس: منتظر انفجار قیمتی به بالا یا سقوط سنگین؟

🔎 Technical Overview IDUSDT is currently consolidating within a major support zone at 0.1343 – 0.1554 (highlighted yellow box on the chart). This level has been tested multiple times since May 2025, proving that buyers are still defending it. The price action forms a rectangle accumulation zone, but also resembles a descending triangle as lower highs continue to appear. This means the next move will depend on whether we see a confirmed breakout or a breakdown. --- 🟢 Bullish Scenario If the price manages to hold above support and break key resistance levels: First trigger: daily close above 0.1748 Strong confirmation: daily close above 0.2049 Upside targets: 🎯 0.2475 – 0.2665 🎯 0.3180 🎯 0.3641 Each higher resistance break increases the probability of a trend reversal. --- 🔴 Bearish Scenario If selling pressure dominates and the support fails: Main trigger: daily close below 0.1343 Implication: breakdown from the accumulation zone → continuation of the downtrend. Downside target: psychological area below 0.120 (check lower TF for minor supports). A breakdown here could extend the bearish trend significantly. --- 📌 Visible Patterns Rectangle Accumulation: price consolidating in a horizontal range, awaiting direction. Descending Triangle: sellers still pressuring with lower highs. Demand Zone: 0.1343 – 0.1554 is the key battleground between bulls and bears. --- ⚖️ Conclusion IDUSDT is at a critical decision point. Bullish case: breakout above 0.1748 – 0.2049 with strong volume, targeting higher resistance zones. Bearish case: breakdown below 0.1343, opening downside potential toward 0.120 and lower. Traders should wait for a confirmed breakout/breakdown before entering positions, while maintaining strict risk management (stop loss at invalidation levels). --- 📌 Key Levels for IDUSDT Support: 0.1343 – 0.1554 Resistance: 0.1748 – 0.2049 Bullish Targets: 0.2475 – 0.2665 → 0.3180 → 0.3641 Bearish Target: below 0.1343 (towards 0.12 zone) --- #IDUSDT #CryptoAnalysis #Altcoin #Breakout #SupportResistance #TechnicalAnalysis #BullishScenario #BearishScenario

CryptoWithJames
IDUSDT UPDATE
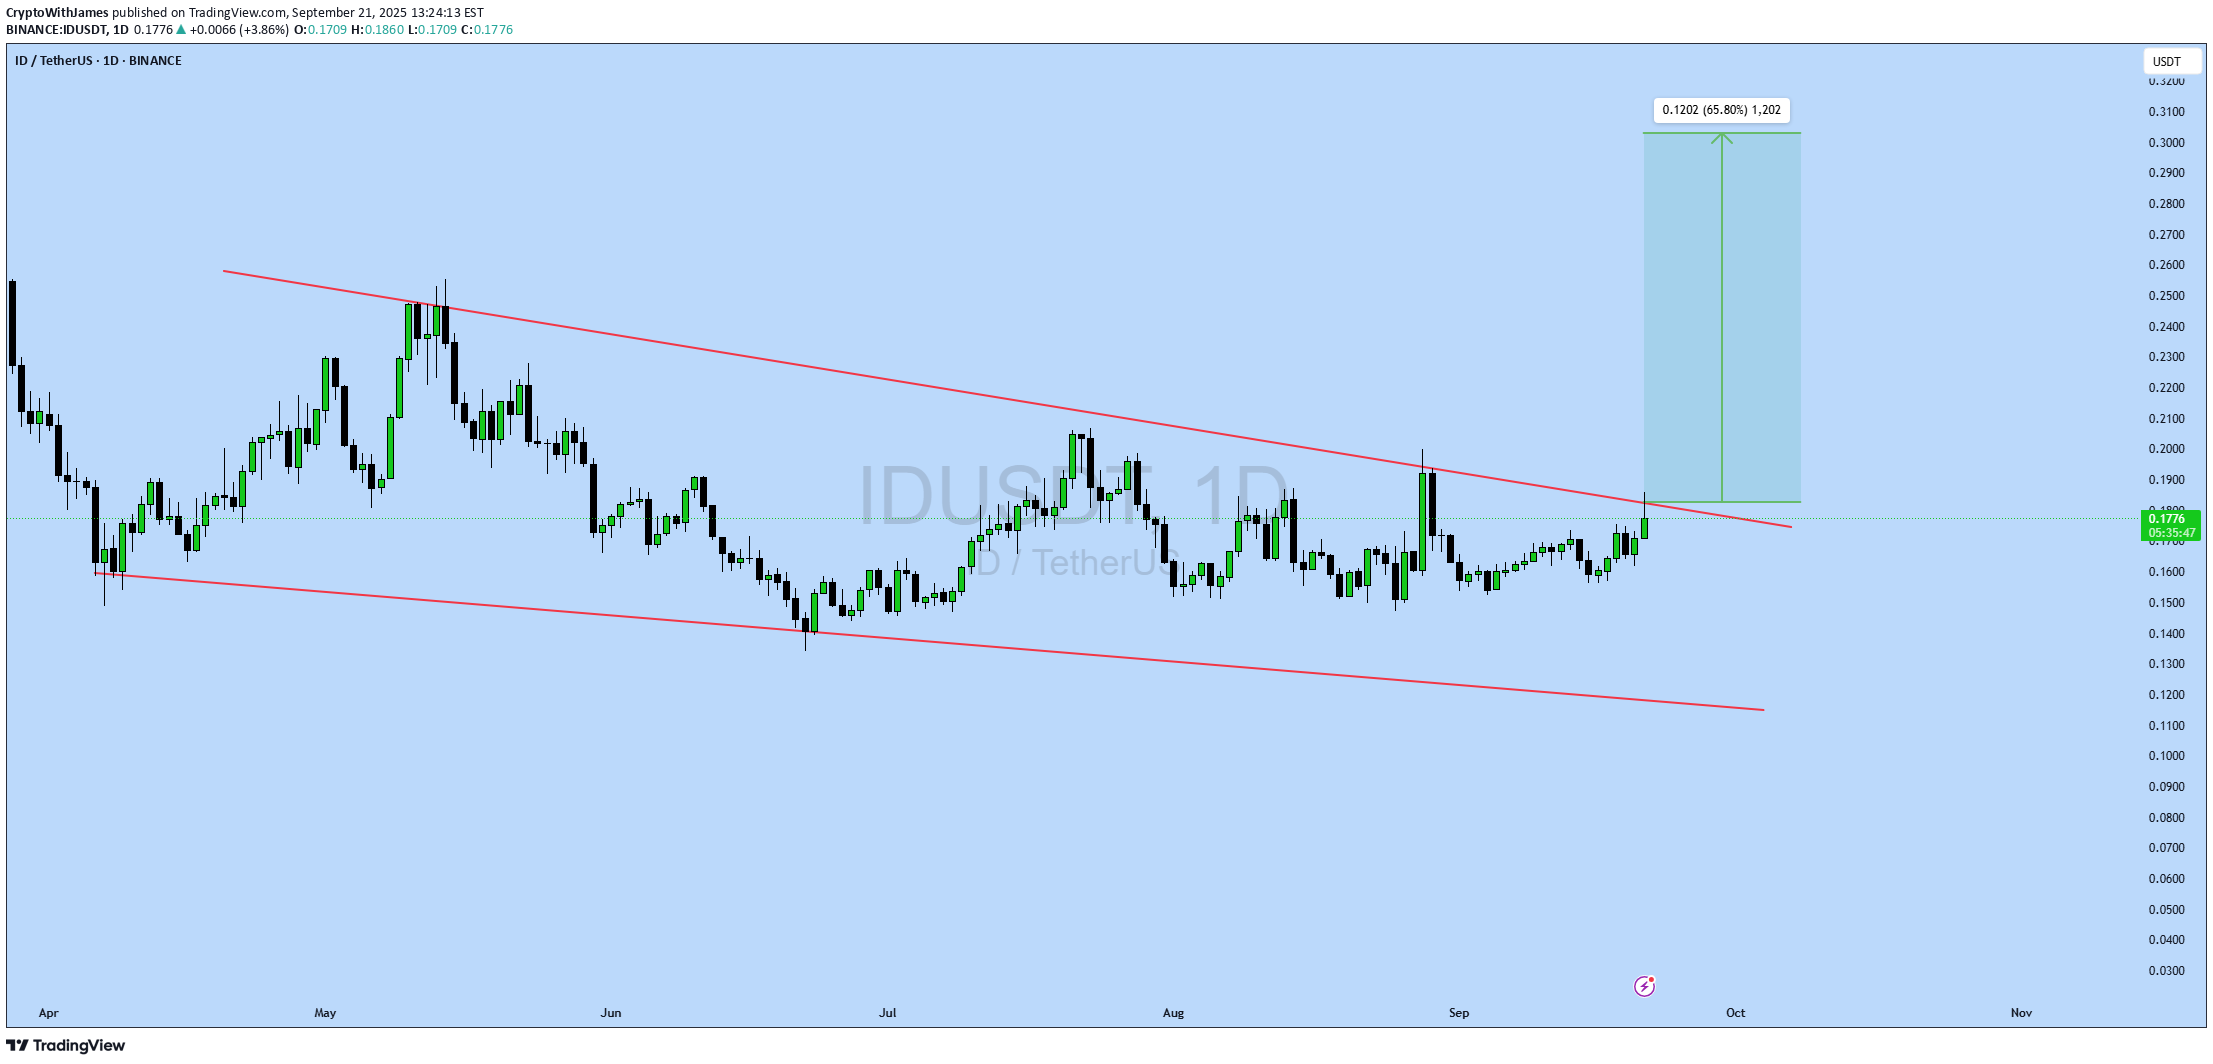
#ID UPDATE ID Technical Setup Pattern: Bullish Falling Wedge Pattern Current Price: $0.1779 Target Price: $0.298 Target % Gain: 65.80% ID is breaking out of a falling wedge pattern on the 1D timeframe. Current price is $0.1779 with a target near $0.298, showing about 66% potential upside. The breakout confirms bullish momentum with structure favoring continuation. Always use proper risk management. Time Frame: 1D Risk Management Tip: Always use proper risk management.

Bithereum_io
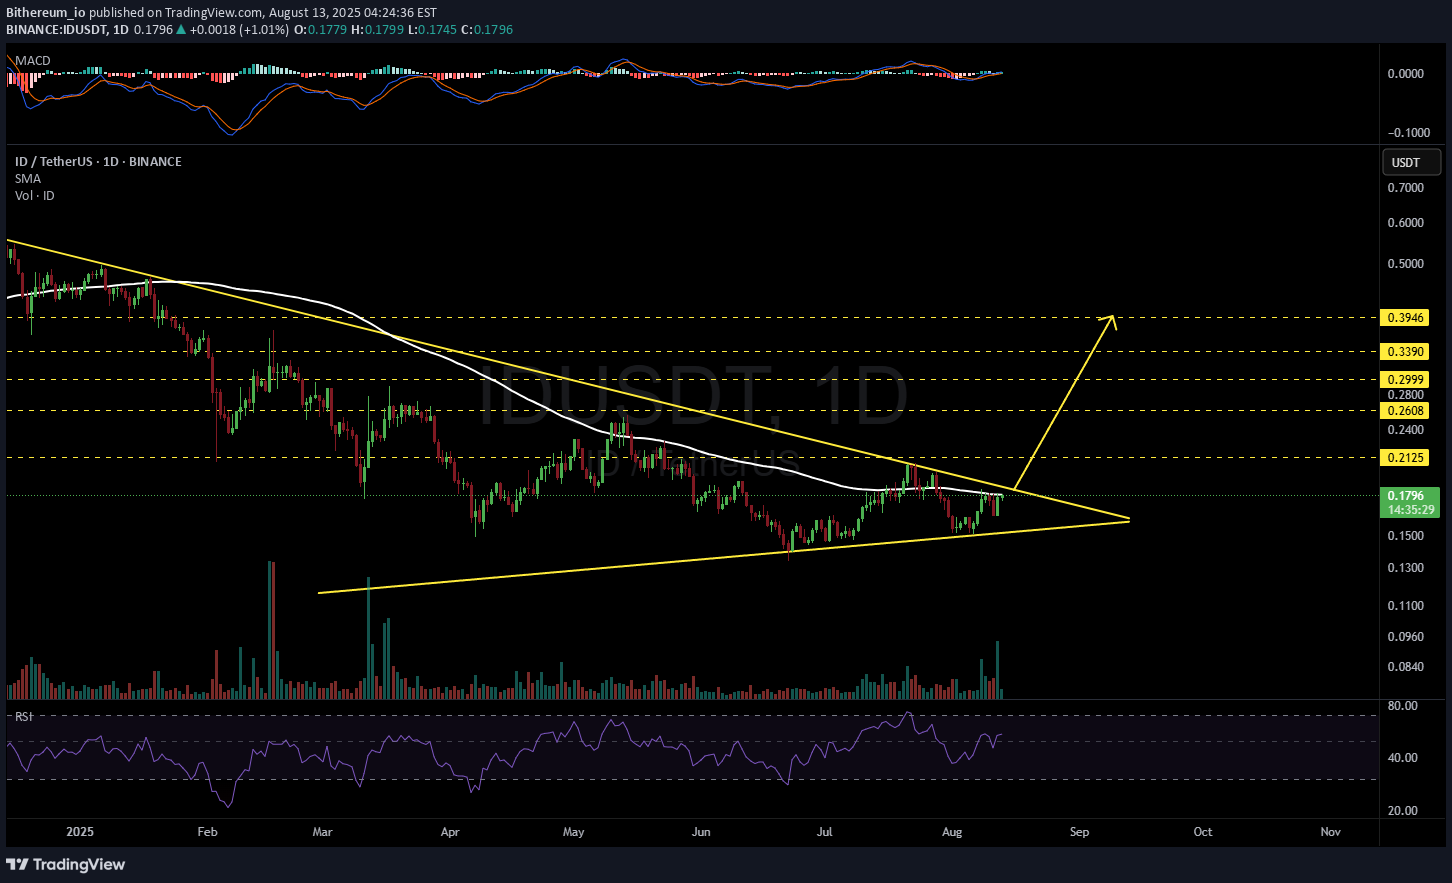
IDUSDT 1D
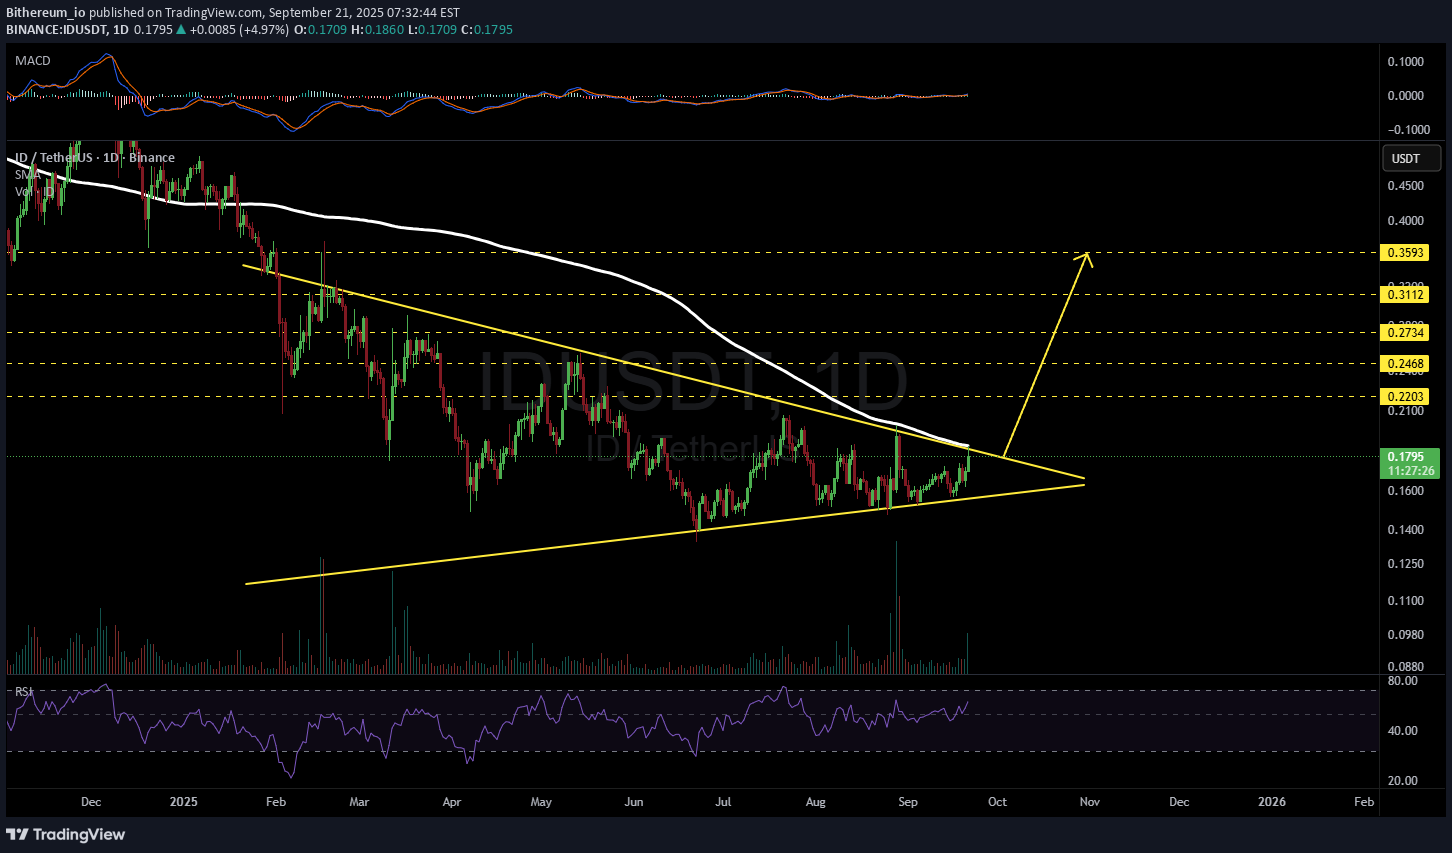
#ID is moving inside a symmetrical triangle on the daily timeframe. In case of a breakout above the triangle resistance and the daily SMA200, the potential targets are: 🎯 $0.2203 🎯 $0.2468 🎯 $0.2734 🎯 $0.3112 🎯 $0.3593 ⚠️ Always remember to use a tight stop-loss and follow proper risk management.
CryptoNuclear
ID/USDT — Long Consolidation for Reversal or Breakdown Ahead?
📌 Overview The ID/USDT pair has been moving in a prolonged consolidation phase since May 2025, trapped within a tight accumulation box between 0.1343–0.1674. This zone has acted as a critical demand area, tested multiple times but still holding strong, showing significant buyer defense. However, the broader structure remains bearish (lower highs & lower lows since December 2024), meaning this consolidation is a make-or-break stage: Is it a genuine accumulation before a bullish reversal? Or just distribution before another breakdown? --- 🔎 Pattern & Structure Main pattern: Horizontal range / accumulation box. Characteristics: Sideways movement, low volatility, frequent false breakouts with long wicks → signaling a strong tug-of-war between bulls and bears. Key technical levels: Support: 0.1343 (range low) Resistance: 0.1674 (range high) Immediate upside levels: 0.2049 – 0.2475 – 0.3180 Major supply zones: 0.3641 – 0.4874 – 0.6742 --- 🟢 Bullish Scenario If price manages to break above 0.1674 and especially confirm above 0.2049 with strong volume: 1. Signals the start of a new bullish momentum after months of accumulation. 2. Potential upside targets: TP1: 0.2475 (intermediate resistance) TP2: 0.3180 (strong resistance zone) TP3: 0.3641 (major supply zone) 3. Confirmation: Daily close above 0.205, supported by a retest holding as new support + volume expansion. 4. Bullish invalidation: A failed breakout where price falls back into the box (false breakout). --- 🔴 Bearish Scenario If price breaks down below 0.1343 (range low): 1. Indicates buyers lost control of the demand zone. 2. Downside targets: Psychological support: 0.120 – 0.110 Measured move of the range box: points toward ~0.100 3. Bearish continuation is confirmed if breakdown comes with high volume. 4. Bearish invalidation: A quick rebound back inside the box (false breakdown). --- 🎯 Trading Implications For swing traders: This 0.134–0.167 range offers a prime opportunity to trade the box (buy support, sell resistance) until a breakout occurs. For trend followers: Wait for a confirmed breakout/breakdown with volume before entering, to reduce false signal risk. Risk management: Place stops just outside the box (below 0.134 for longs, above 0.167 for shorts). Risk no more than 1–2% per trade. --- 📌 Conclusion ID/USDT is currently in a “calm before the storm” phase. This long consolidation will soon dictate the next major trend: A confirmed breakout could trigger a strong reversal after the prolonged downtrend. A breakdown would likely extend the bearish cycle toward deeper lows. Traders should stay patient and wait for daily close confirmation with volume to validate the next direction. --- #IDUSDT #CryptoAnalysis #TechnicalAnalysis #SupportResistance #Breakout #Bearish #Bullish #Altcoins #SwingTrading #Accumulation

Crypto_alphabit
ID

IDUSDT #ID/ USDT Entry range (0.1500- 0.1650) SL 4H close below 0.1460 T1 0.18 T2 0.26 T3 0.30 Extra Target is optional 0.45 _______________________________________________________ Golden Advices. ******************** * collect the coin slowly in the entry range. * Please calculate your losses before the entry. * Do not enter any trade you find it not suitable for you. * No FOMO - No Rush , it is a long journey.
Bithereum_io
CryptoNuclear
ID/USDT — Final Battle at the Multi-Month Downtrend Line!
📌 Market Structure Overview Since peaking in late 2024, ID/USDT has been trapped under a relentless multi-month downtrend line lasting almost 10 months. Every rally attempt has been shut down at this descending wall. Now, the market is at a critical inflection point — price is pressing right against the trendline and sitting in the decision zone between 0.190–0.205. A breakout here would not only be a technical victory for the bulls but could also trigger a shift in market psychology from seller dominance to buyer control. --- 📊 Key Levels to Watch Major Resistances: 0.2049 → 0.2475 → 0.2665 → 0.3180 → 0.3641 → 0.4874 → 0.6742 Supports: 0.177–0.180 → 0.165 → 0.134–0.145 (major demand zone) --- 📐 Pattern & Sentiment Analysis The dominant structure is a classic Descending Trendline Resistance, showing consistent lower highs under seller pressure. However, there’s an early sign of sentiment shift — a higher low compared to the July bottom, suggesting that buyers are stepping in earlier and absorbing supply. If price can close a daily candle above the trendline and 0.2049, we could see the start of a trend reversal rally toward higher resistance levels. --- 🚀 Bullish Scenario 1. Trigger: Daily close above the trendline + 0.2049. 2. Confirmation: Retest of 0.19–0.205 holds as new support. 3. Upside Targets: Initial: 0.2475 Mid-term: 0.2665 → 0.3180 Extended: 0.3641 (psychological zone) 4. Invalidation: Closing back below 0.190 or losing 0.177–0.180. --- 📉 Bearish Scenario 1. Trigger: Sharp rejection from the trendline/0.19–0.205 zone. 2. Downside Targets: First: 0.177–0.180 Next: 0.165 Extreme: 0.134–0.145 (historical low) 3. Invalidation: Sustained breakout above 0.205 with strong volume. --- ⚖️ Perspective & Risk Management This is a “make or break” moment for ID/USDT. Don’t rely solely on intraday spikes — wait for a confirmed daily close to avoid fakeouts. Use the above S/R levels as tiered take-profit zones and for placing protective stops. #IDUSDT #ID #Crypto #PriceAction #TechnicalAnalysis #DowntrendBreak #Breakout #SupportResistance #CryptoTrading

Captain-MAO
ID/USDT – Parabolic Reversal Loading

Price action is coiling for a parabolic move, signaling the early stages of a major reversal trend. Accumulation structure is forming as buyers step in to absorb supply, creating the foundation for a powerful breakout. A confirmed push above key resistance could ignite the next impulsive leg, shifting the market into a sustained bullish phase.

asilturk
ID Düzeltme Tamamlanmış Hareket Başlangıç Noktası
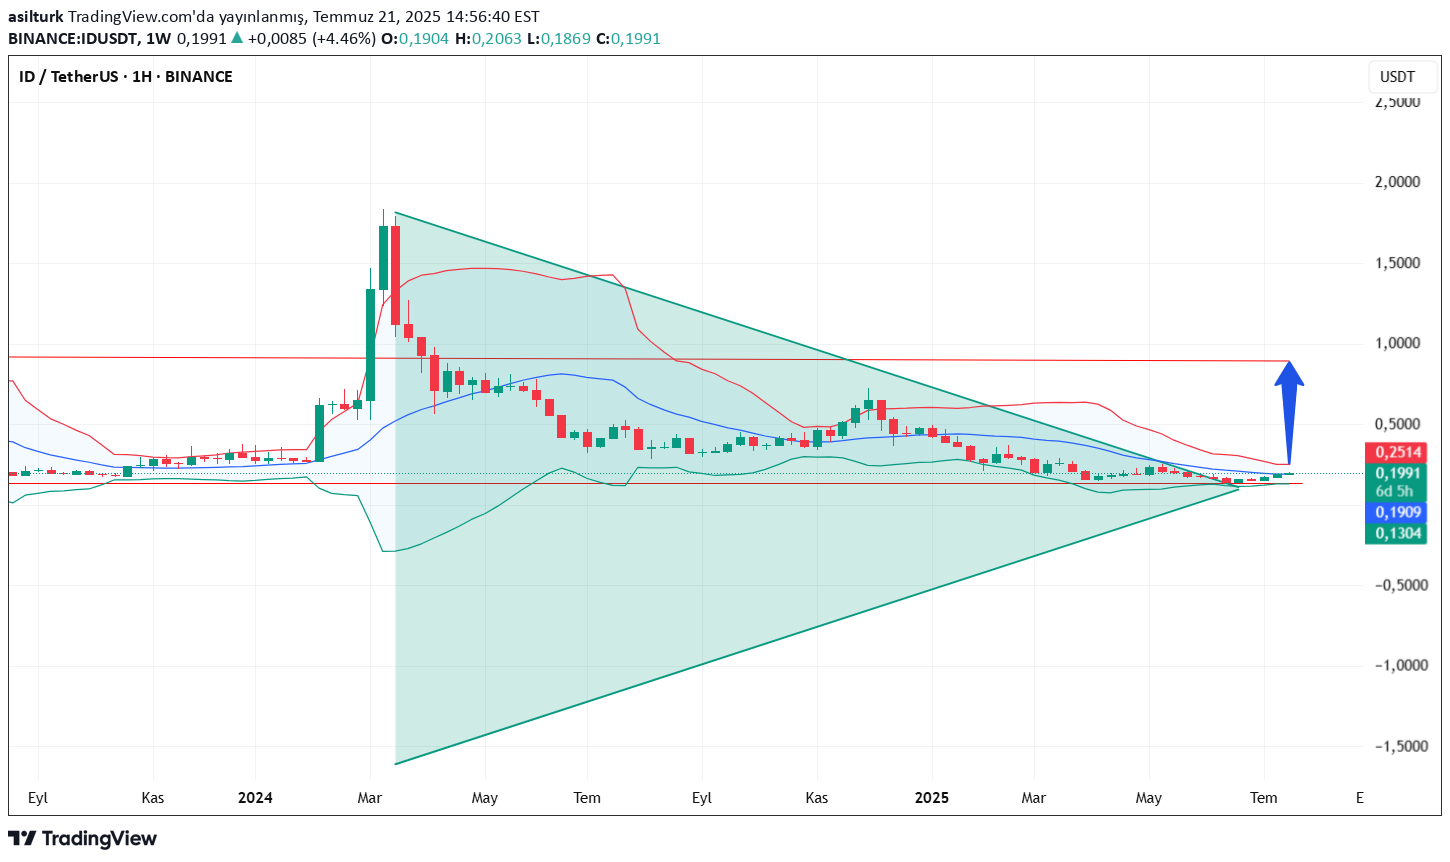
ID Coin $ 400 million with market value of 238. ranks alt Coin is in front of us 2 billion units of total supply of 1 billion units of actual circulation of 0.50 cents released from the market in February 2024 seems to have completed its withdrawal from $ 1.84 to $ 0.19Cente. A giant triangular formation typical cliché alt The same formation as coins, but the difference of ID Web3 wallet addresses. The fact that the domain names are stored and transferred as NFTs to be very chained to the fact that it is listed in Binance Launchpad for DApps is a project that will come in the field of web3 identities and domain names in the face of web3 identities and domain names. However, high supply is a medium -risk asset that should be carefully approached due to limited use and harsh competitors. It can be evaluated for thematic investment, not speculative. Binance Launchpad is out of output, I think it supports price performance in certain periods. As a foot note, I also have to say randomly alt COIN I do not select or not to share graphics upon request. I feel the need to share coins with serious rise potential. There may be serious movements in the short term and I determine this based on technical data and strategy, so when opening the transactions, open your term transactions as a short term except for bist shares ...
Disclaimer
Any content and materials included in Sahmeto's website and official communication channels are a compilation of personal opinions and analyses and are not binding. They do not constitute any recommendation for buying, selling, entering or exiting the stock market and cryptocurrency market. Also, all news and analyses included in the website and channels are merely republished information from official and unofficial domestic and foreign sources, and it is obvious that users of the said content are responsible for following up and ensuring the authenticity and accuracy of the materials. Therefore, while disclaiming responsibility, it is declared that the responsibility for any decision-making, action, and potential profit and loss in the capital market and cryptocurrency market lies with the trader.