
HIGH
Highstreet
| تریدر | نوع سیگنال | حد سود/ضرر | زمان انتشار | مشاهده پیام |
|---|---|---|---|---|
No results found. | ||||
Price Chart of Highstreet
سود 3 Months :
سیگنالهای Highstreet
Filter
Sort messages by
Trader Type
Time Frame

Crypto-by-PRIME
صعود HIGH/USDT: آیا به زودی به مرز ۰.۸۵ دلار میرسیم؟

HIGH is bouncing back from strong support and is now heading towards trendline resistance. If momentum sustains and the breakout confirms, we could see a rally towards $0.70 – $0.85. Manage risk wisely—any breakdown below the support will invalidate this setup.

Bithereum_io
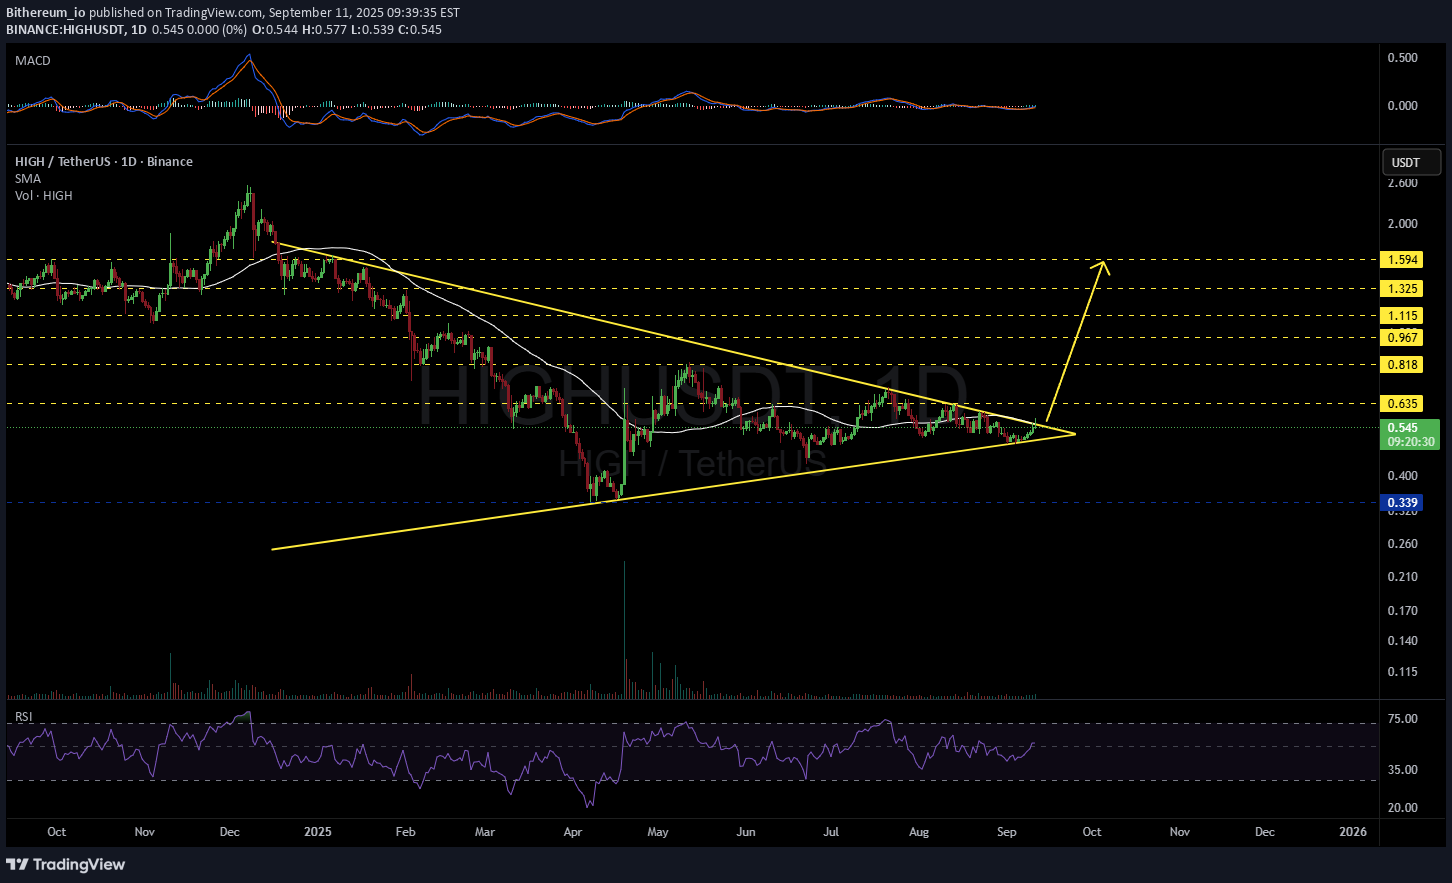
Keep an eye on the #HIGH daily chart. It is on the verge of breaking out above the symmetrical triangle resistance and the daily SMA50. If that happens, the potential targets are: 🎯 $0.635 🎯 $0.818 🎯 $0.967 🎯 $1.115 🎯 $1.325 🎯 $1.594 ⚠️ Always remember to use a tight stop-loss and follow proper risk management.

CryptoNuclear
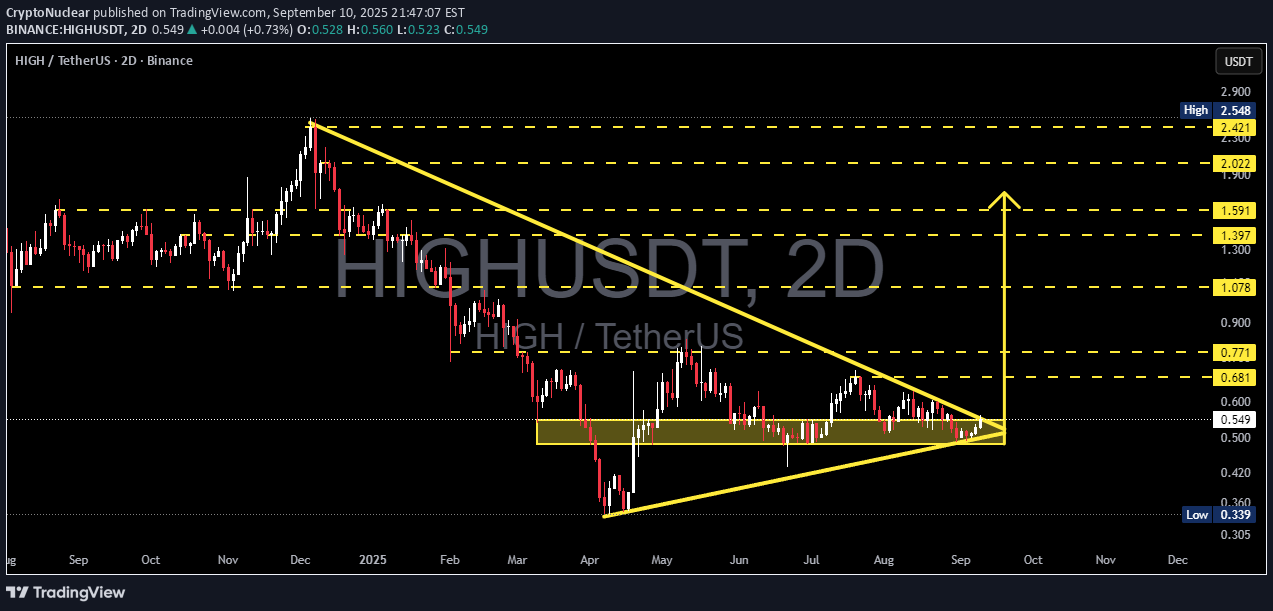
The pair HIGH/USDT is currently at a critical stage after experiencing a prolonged downtrend earlier this year. On the chart, we can clearly see the formation of a Symmetrical Triangle, marked by a descending resistance line from the $2.5 peak and a rising support line that has been holding since April 2025. This type of pattern usually appears during a consolidation phase, where both buyers and sellers are competing to decide the next medium-term trend. --- 🔑 Key Highlights from the Chart: 1. The accumulation zone (0.45 – 0.55) has been tested multiple times since April and continues to hold — making it a critical demand area. 2. Price action is now squeezing into the apex of the triangle, suggesting that a major breakout is likely to occur soon. 3. Key resistances: 0.681 → 0.771 → 1.078 → 1.397 → 1.591 → 2.022 → 2.421. 4. Key supports: 0.45, with the last major floor at 0.339. A breakdown here would strengthen the bearish case. --- 📈 Bullish Scenario A breakout above the descending trendline and a confirmed 2D candle close above 0.68–0.77 would open the door for a strong rally. Short-term targets: 0.77 → 1.08 → 1.40 Mid-term targets: 1.59 → 2.02 → 2.42 Full measured move target: 2.63 – 2.76 Confirmation: Breakout must come with rising volume + successful retest. --- 📉 Bearish Scenario Failure to hold above 0.45 would invalidate the triangle pattern and likely lead to further downside. First bearish target: 0.339 (previous low). If broken, extended bearish measured move could reach around 0.12 (extreme scenario). Confirmation: 2D close below 0.45 with strong selling volume. --- 🧭 Conclusion HIGH is at a decisive turning point. Bulls need a confirmed breakout above 0.68–0.77 to shift momentum and reclaim medium-term strength. Bears will dominate if 0.45 breaks, pushing price back to 0.339 or lower. Until confirmation, the setup remains neutral, but the tightening triangle indicates that a large move is imminent. --- #HIGHUSDT #HIGH #Crypto #TechnicalAnalysis #SymmetricalTriangle #Breakout #Bullish #Bearish #Altcoin #SupportResistance

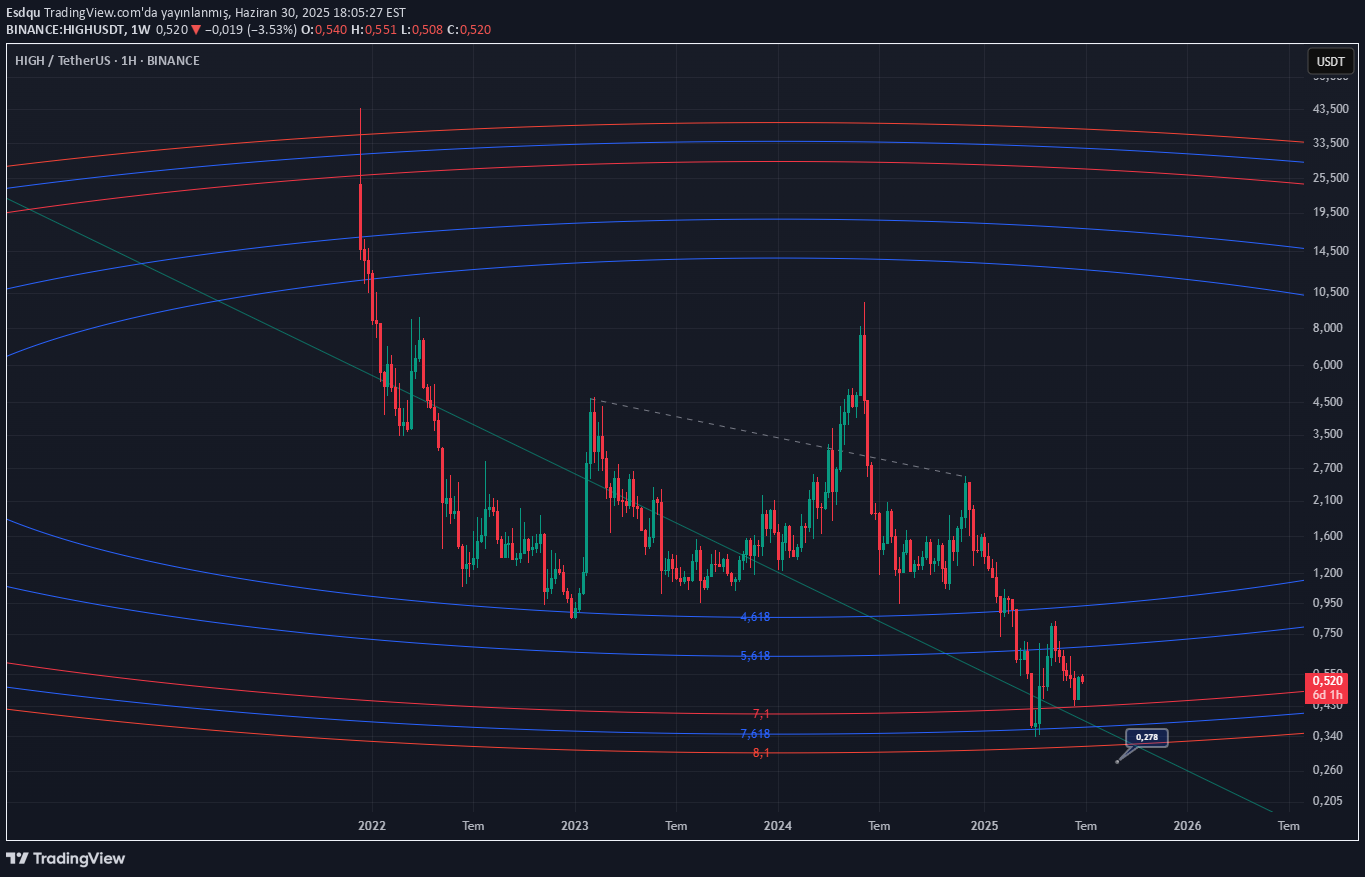
The price seems to throw the needle under the 8.1 FIB channel and then make a hard turn. Of course, it may not go down there, but it seems like the last point that is likely to be purchased. Do your risk management carefully. YTD.

RiskandReward

به نظر می رسد یک فرصت سرمایه گذاری خوب وجود دارد که باید بررسی شود. (این توصیه مالی نیست)

darwan318

recent test on daily supply line , and if this can consolidate nicely, it may present buy opportunity.

InnerCircleAnalysis

HIGHUSDT Already Broken Descending Broadening and started Recovery in D1 ChartContinuity of momentum can see 80-120% Bullish Rally in Short-term .

Rockybullcrypto

Break trendline with a short -term target of at least 10%+ from here.HIGH pumped +15% profit

mohamed_yousef_elziny

تحلیل جفت ارز HIGHUSDT با استفاده از روش SMC 🧠🚀یک فرصت خرید ویژه در جفت ارز HIGHUSDT بر اساس روش Smart Money شناسایی شده است، جایی که عوامل متعددی از ورود به معامله با اطمینان حمایت می کنند. 🔍 نگاهی به تحلیل تکنیکال:نقدینگی از یک کف اصلی جمع آوری شده است، که نشان دهنده حرکت موسسات مالی و جمع آوری موقعیت های خرید است.یک Order Block خرید واضح در تایم فریم مناسب تشکیل شده است و یک بار با یک کندل بازگشتی قوی آزمایش شده است.قیمت ساختار صعودی را حفظ کرده و ساختار صعودی قبلی شکسته نشده است، که روند را مثبت نگه می دارد.از سطح فیبوناچی دقیق برای ورود از یک منطقه واکنش بالا استفاده شده است.هدف در آخرین قله شکسته شده تعیین شده است، که یک منطقه منطقی برای تخلیه نقدینگی و کسب سود است.📍 جزئیات معامله:🟡 ورود (Entry): 0.501000🟢 هدف (TP): 0.568278🔴 حد ضرر (SL): 0.488072📊 نسبت ریسک به پاداش (RR): 1 : 5.20📈 درصد سود مورد انتظار: +13.43%⚠️ شرایط مدیریت معامله:❗️ فعال شدن حد ضرر فقط در صورتی محاسبه می شود که بدنه کندل ساعتی زیر سطح SL بسته شود.❌ اگر قبل از فعال شدن ورود، هدف زده شود، معامله به طور کامل لغو می شود.⚠️ تذکر مهم:این تحلیل توصیه مالی نیست. ورود به معامله مسئولیت شخصی شماست، و باید تحلیل را به خوبی بررسی کنید و به دیدگاه و برنامه مدیریت ریسک خود اعتماد کنید.💬 آیا این معامله را منطقی می دانید؟ نظر خود را در نظرات به اشتراک بگذارید!📊 برای تحلیل های فنی بیشتر، سیگنال های ورود و بحث های مستقیم:تلگرام: @ELZINYTERAD
mohamed_yousef_elziny

HIGUSDT analysis using the SMC 🧠🚀 A distinctive purchasing opportunity is monitored on the Highusdt pair according to the Smart Money methodology, where several factors that support entry into the deal with confidence appeared. Look at technical analysis: Reduced liquidity from a major bottom, indicating the movements of financial institutions and the collection of purchasing centers. The appropriate time, it was tested once with a strong reflexive candle. The price maintained the emerging structure and the previous rising structure was not broken, which keeps the direction positive. (TP): 0.568278🔴 Alstop Important: This analysis is not a financial recommendation. Enter your personal responsibility, you should review the analysis well, rely on your own vision and your risk management plan. Do you see this deal logical? Share your opinion on the comments!
Disclaimer
Any content and materials included in Sahmeto's website and official communication channels are a compilation of personal opinions and analyses and are not binding. They do not constitute any recommendation for buying, selling, entering or exiting the stock market and cryptocurrency market. Also, all news and analyses included in the website and channels are merely republished information from official and unofficial domestic and foreign sources, and it is obvious that users of the said content are responsible for following up and ensuring the authenticity and accuracy of the materials. Therefore, while disclaiming responsibility, it is declared that the responsibility for any decision-making, action, and potential profit and loss in the capital market and cryptocurrency market lies with the trader.