
HBAR
Hedera
| تریدر | نوع سیگنال | حد سود/ضرر | زمان انتشار | مشاهده پیام |
|---|---|---|---|---|
 SwallowAcademyRank: 720 | خرید | حد سود: تعیین نشده حد ضرر: تعیین نشده | 20 hour ago | |
 pullbacksignalRank: 1886 | فروش | حد سود: تعیین نشده حد ضرر: تعیین نشده | 10/30/2025 | |
 BeInCryptoRank: 2279 | خرید | حد سود: ۰٫۲۳ حد ضرر: ۰٫۱۵ | 10/21/2025 | |
 CryptoAnalystSignalRank: 2324 | خرید | حد سود: تعیین نشده حد ضرر: تعیین نشده | 10/31/2025 | |
 Alpha-GoldFXRank: 2059 | خرید | حد سود: تعیین نشده حد ضرر: تعیین نشده | 10/28/2025 |
Price Chart of Hedera
سود 3 Months :
خلاصه سیگنالهای Hedera
سیگنالهای Hedera
Filter
Sort messages by
Trader Type
Time Frame
SwallowAcademy
نقطه ورود طلایی هدرا (HBAR): صبر کنید، سود بزرگ در راه است!
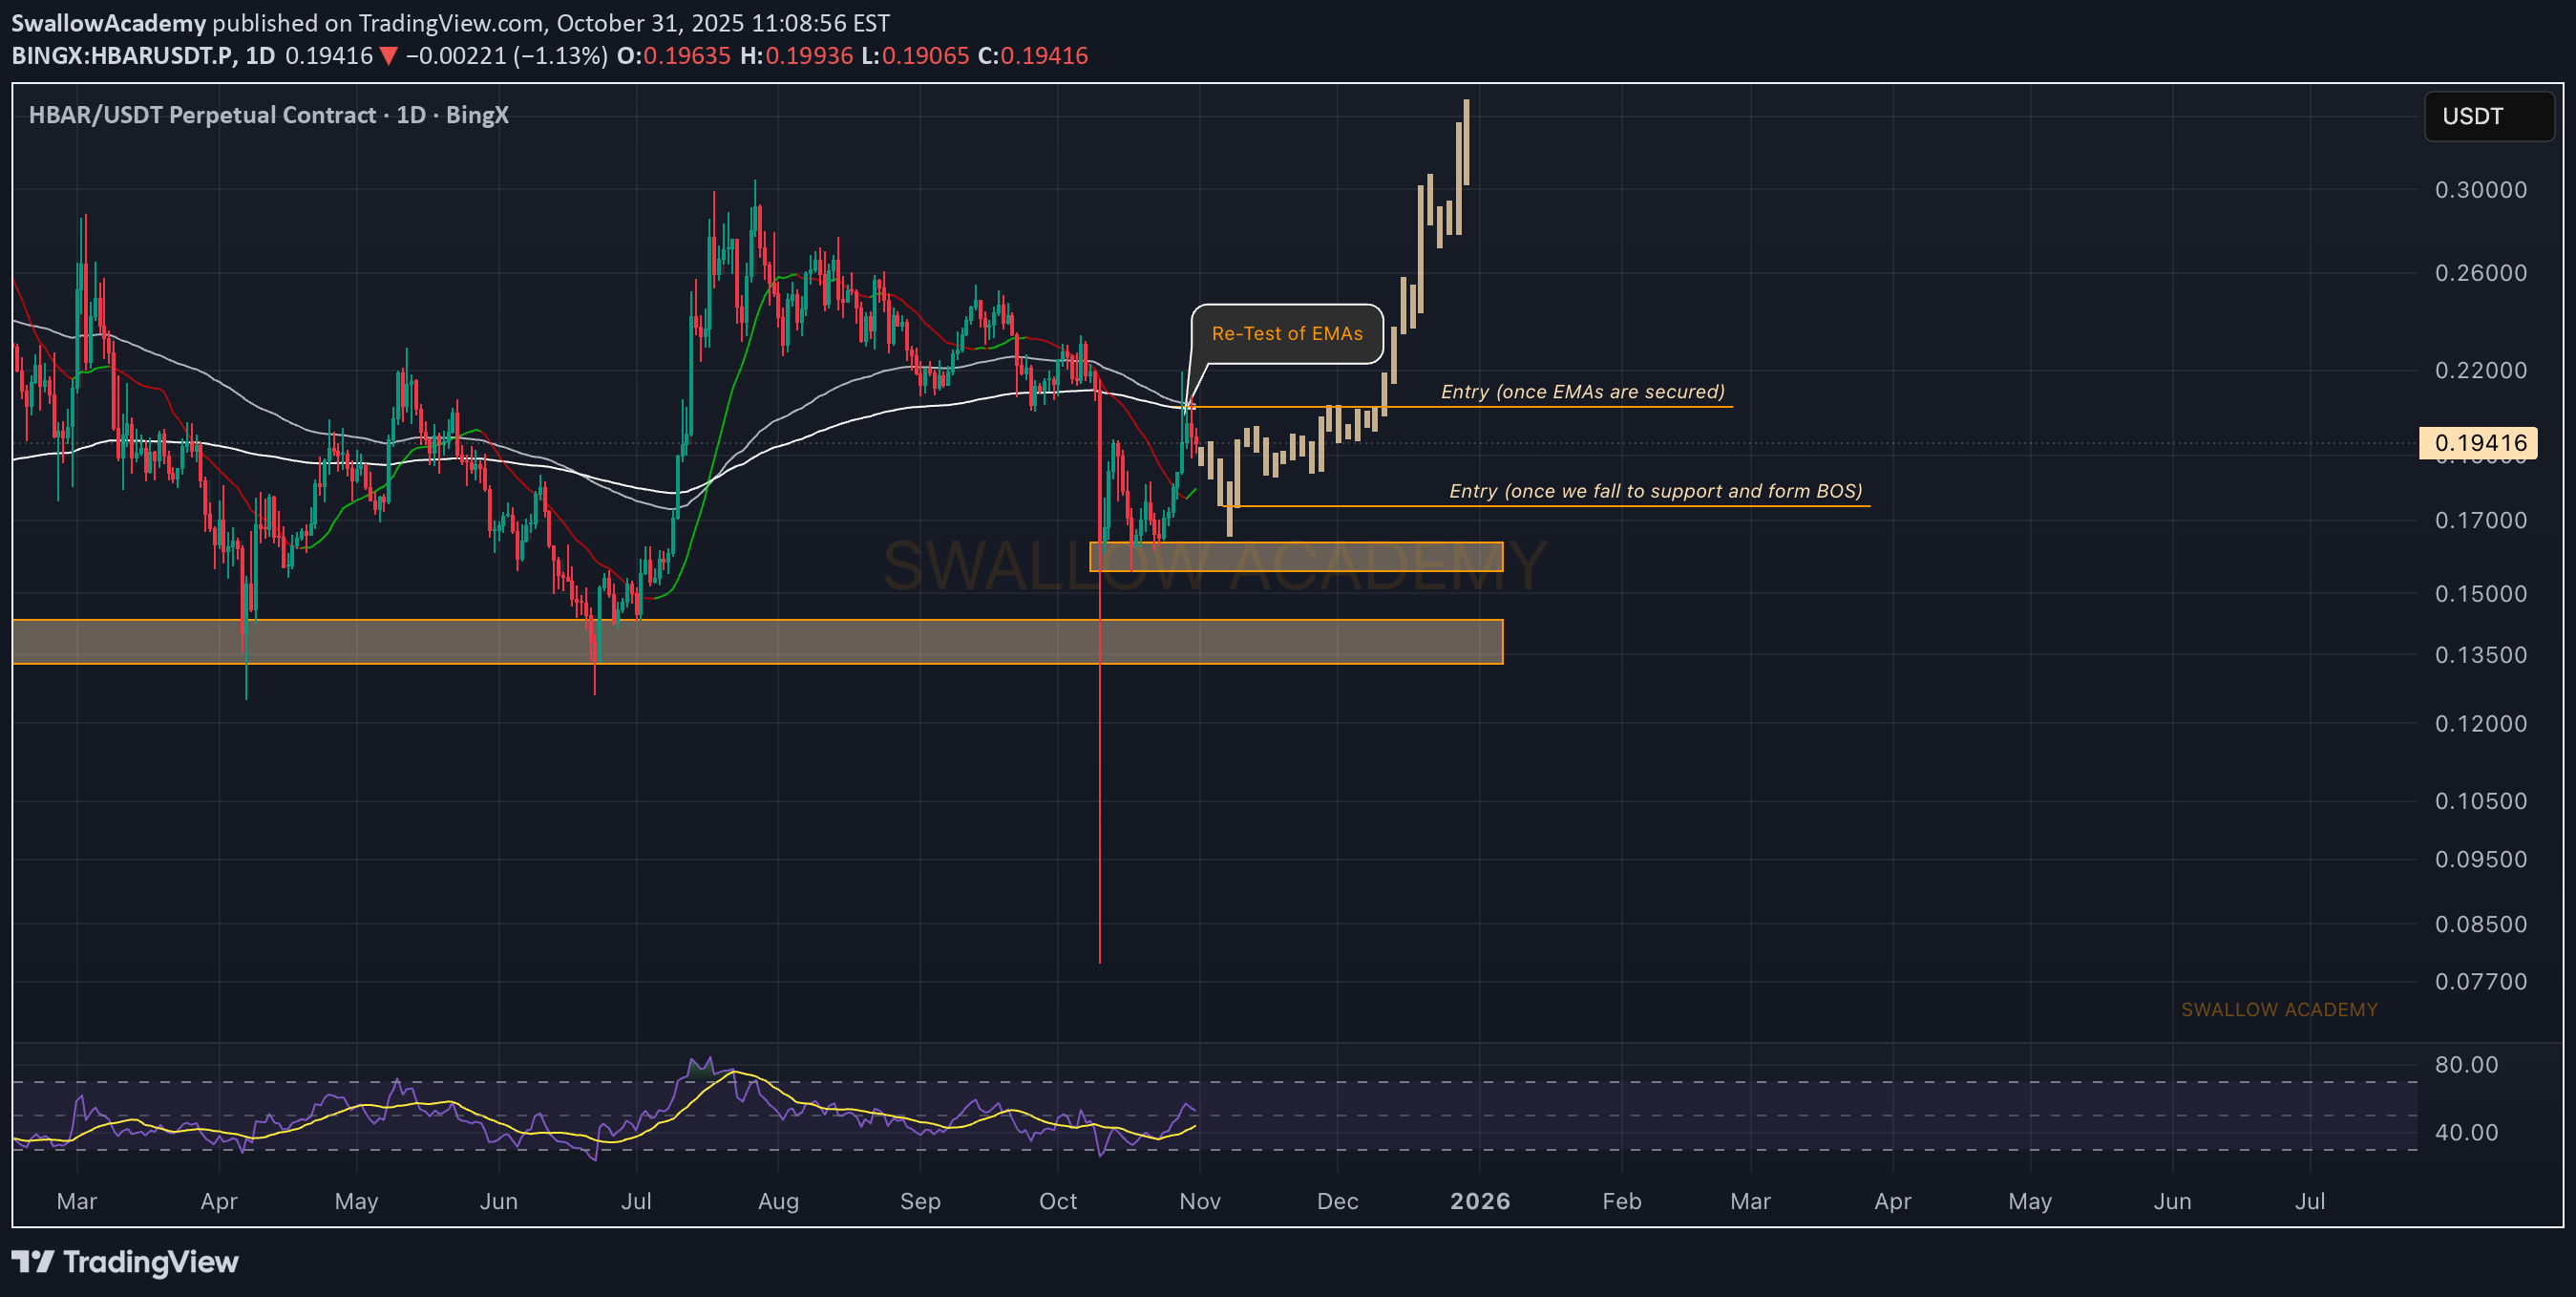
HBAR looks interesting here with two possible setups forming. The first one would be a retest and continuation after EMAs are fully secured, and the second one could come from a drop back into support followed by a proper BOS. In both cases, we’ll need to wait for clear confirmations before taking any entries—patience here will make the difference. Swallow Academy
CryptoAnalystSignal
پیشبینی صعودی بزرگ هبار (HBAR): آیا زمان خرید و ورود به معامله بلندمدت فرا رسیده است؟
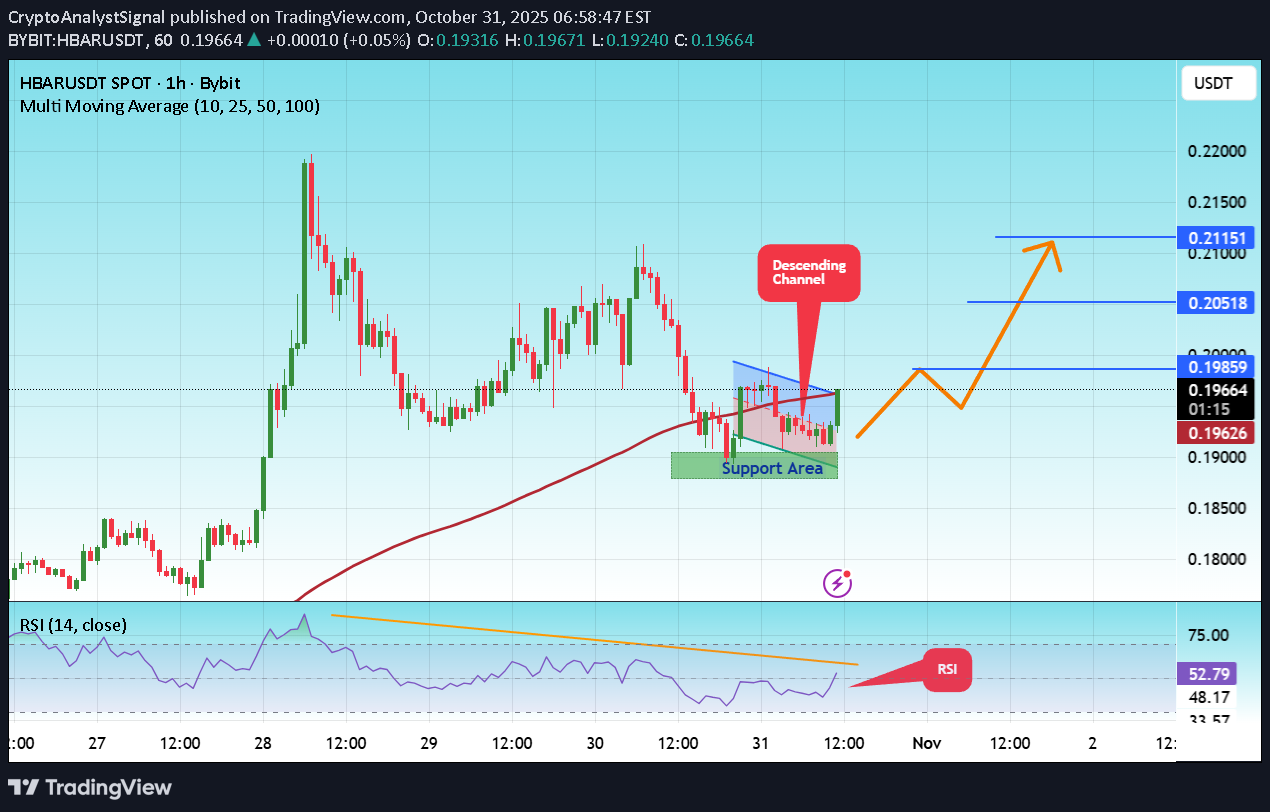
#HBAR The price is moving in a descending channel on the 1-hour timeframe and is expected to break out and continue upwards. We have a trend to stabilize above the 100-period moving average again. We have a downtrend on the RSI indicator, which supports an upward move if it breaks above it. We have a key support zone in green that pushed the price higher at 0.18800. Entry price: 0.1956 First target: 0.1985 Second target: 0.2052 Third target: 0.2115 For risk management, don't forget your stop-loss and money management. The stop-loss is below the support zone in green. Upon reaching the first target, take some profit and then change your stop-loss order to an entry order. For any questions, please comment. Thank you.
pullbacksignal
سیگنال فروش فوری HBAR/USDT: وقت کسب سود رسید!
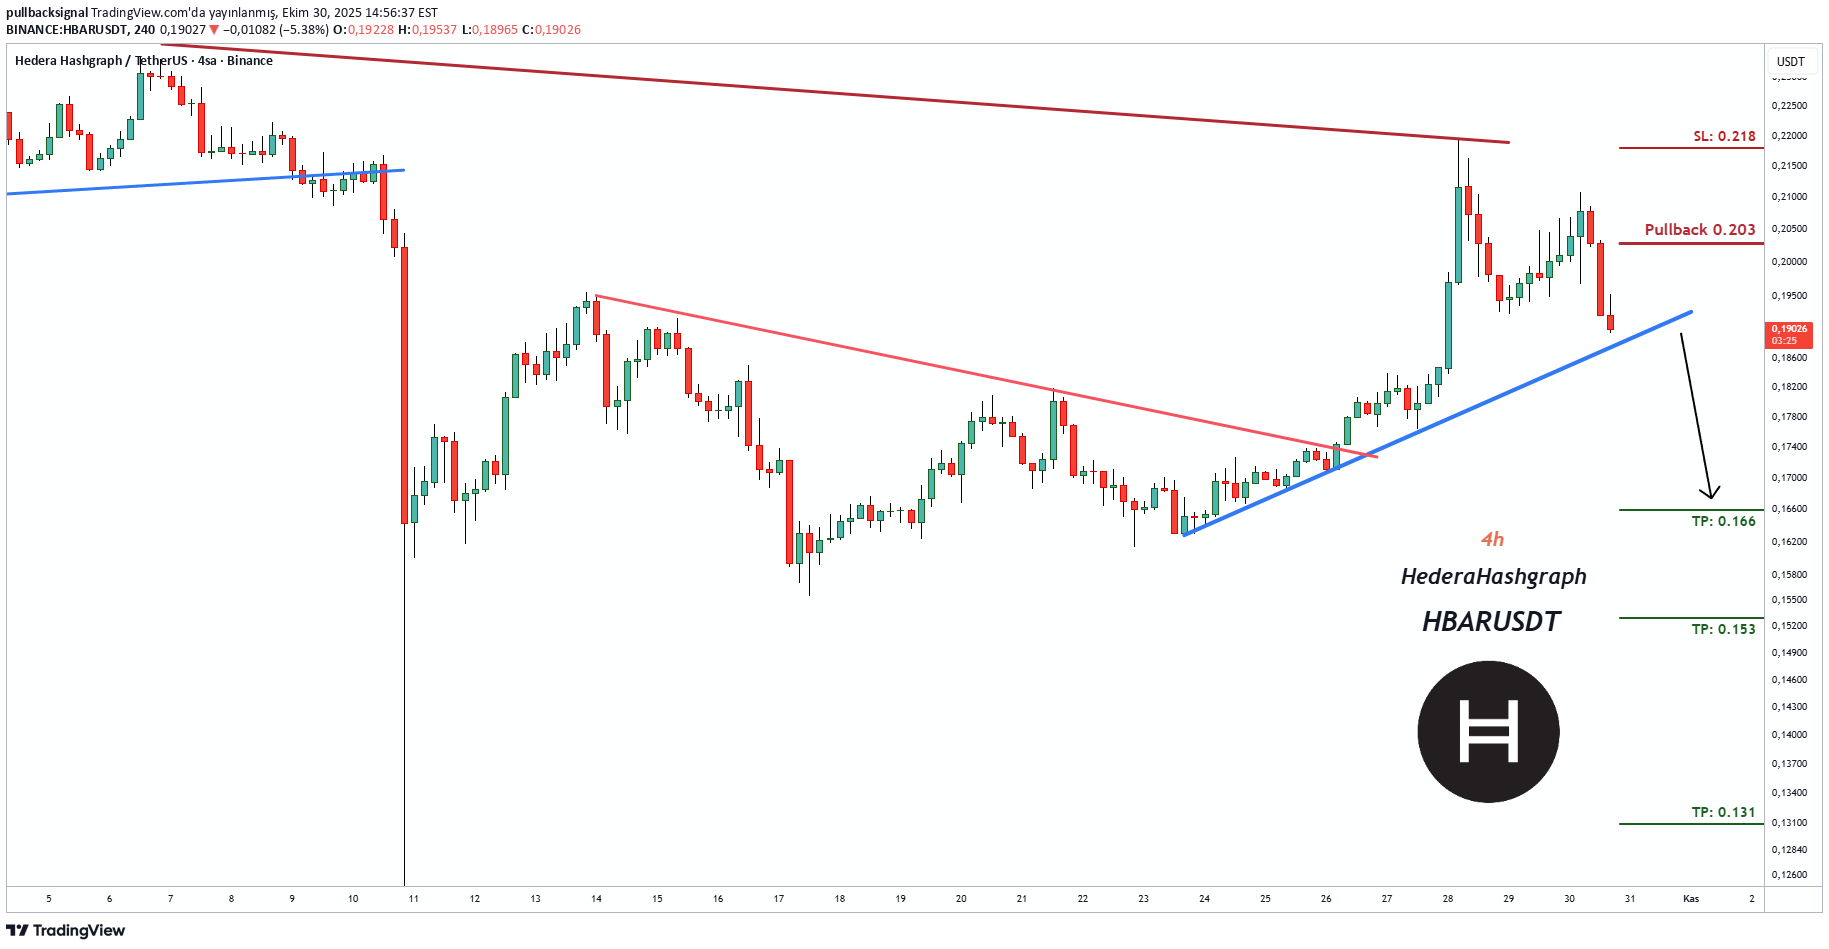
İşlem Kurulumu: HBARUSDT HederaHashgraph'ta (Vadeli İşlemler) (4s) bir İşlem Sinyali görülmektedir. İşlemciler Satış İşlemlerini ŞİMDİ açabilirler. ⬇️ Şimdi veya 0,203'ten satabilirsiniz. ⭕️SL @ 0,218 🔵TP1 @ 0,166 🔵TP2 @ 0,153 🔵TP3 @ 0,131 Bu sinyaller neye dayanmaktadır? Klasik Teknik Analiz Fiyat Hareketi Mum Grafikleri Fibonacci RSI, Hareketli Ortalama, Ichimoku, Bollinger Bantları Risk Uyarısı Forex, CFD, Kripto, Vadeli İşlemler ve Hisse Senetleri ticareti kayıp riski içerir. Bu tür bir yatırımın sizin için uygun olup olmadığını lütfen dikkatlice değerlendirin. Geçmiş performans, gelecekteki sonuçların göstergesi değildir. Fikirlerimizi beğendiyseniz, lütfen beğenileriniz 👍 ve yorumlarınızla bizi destekleyin.
pullbacksignal
سیگنال فروش داغ HBARUSDT: تریدهای فیوچرز را با این تحلیلها شروع کنید!
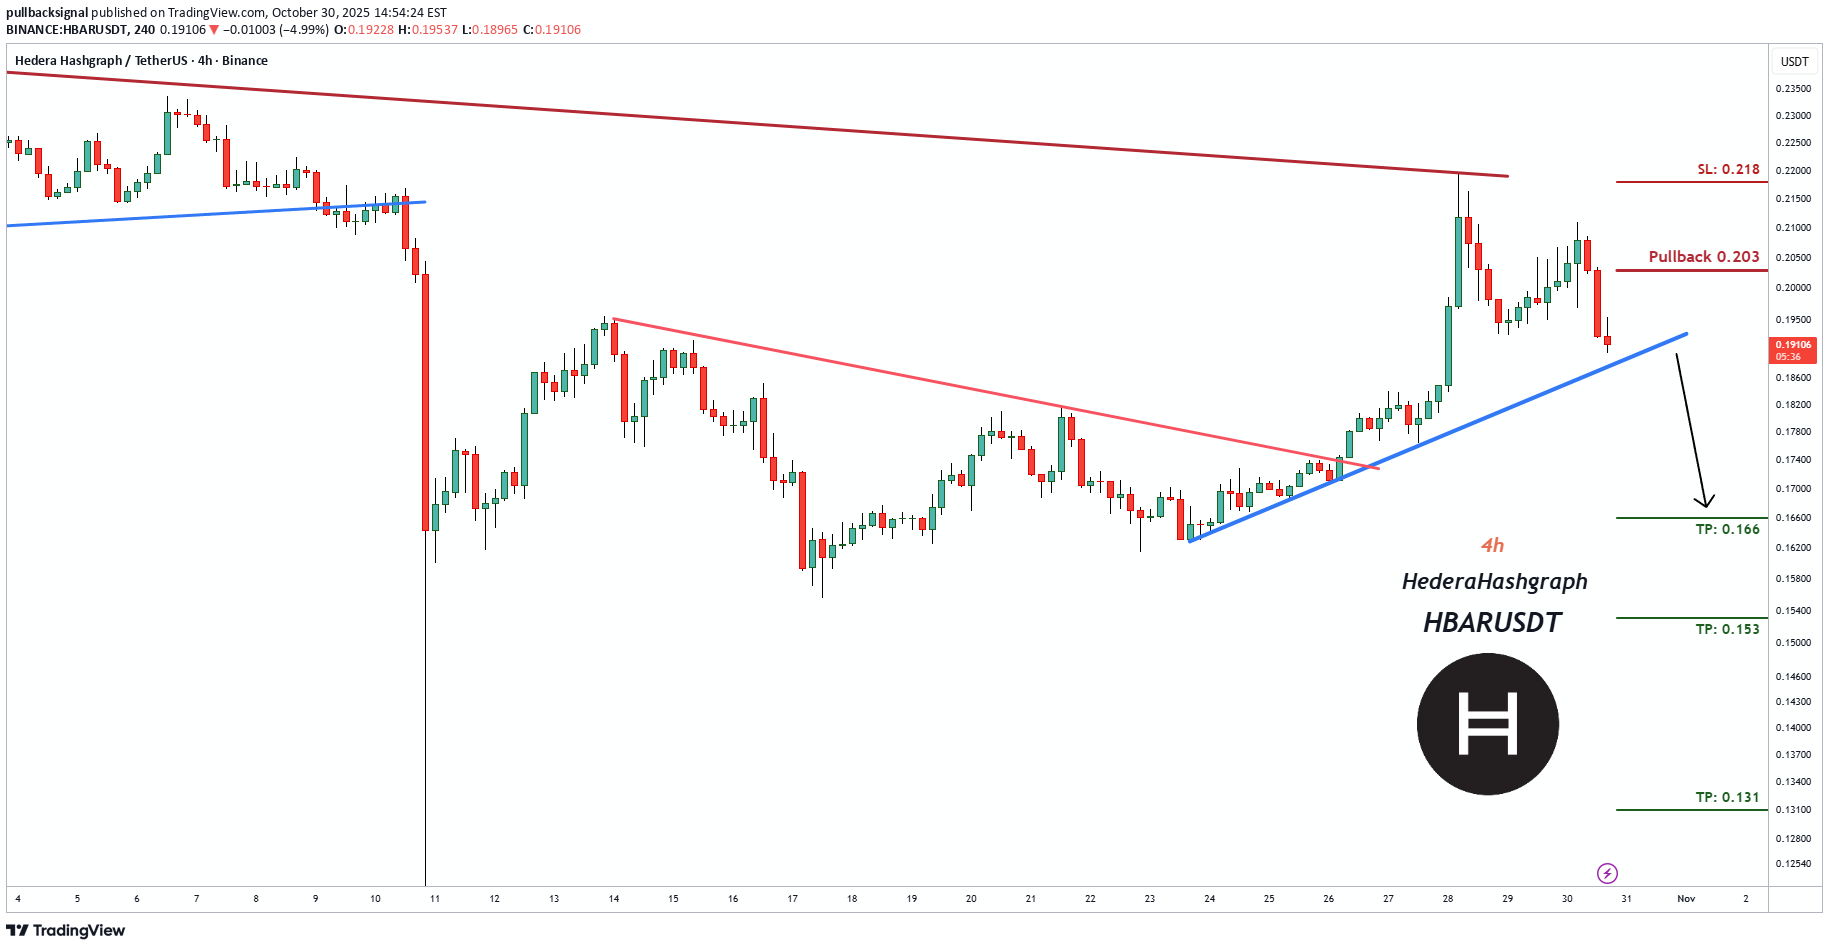
Trading Setup: A Trading Signal is seen in the HBARUSDT HederaHashgraph (Futures) (4h) Traders can open their Sell Trades NOW ⬇️ Sell now or sell on 0.203 ⭕️SL @ 0.218 🔵TP1 @ 0.166 🔵TP2 @ 0.153 🔵TP3 @ 0.131 What are these signals based on? Classical Technical Analysis Price Action Candlesticks Fibonacci RSI, Moving Average , Ichimoku , Bollinger Bands Risk Warning Trading Forex, CFDs, Crypto, Futures, and Stocks involve a risk of loss. Please consider carefully if such trading is appropriate for you. Past performance is not indicative of future results. If you liked our ideas, please support us with your likes 👍 and comments .

Bithereum_io
تحلیل تکنیکال هبار (HBAR): آماده انفجار صعودی با اهداف جذاب؟
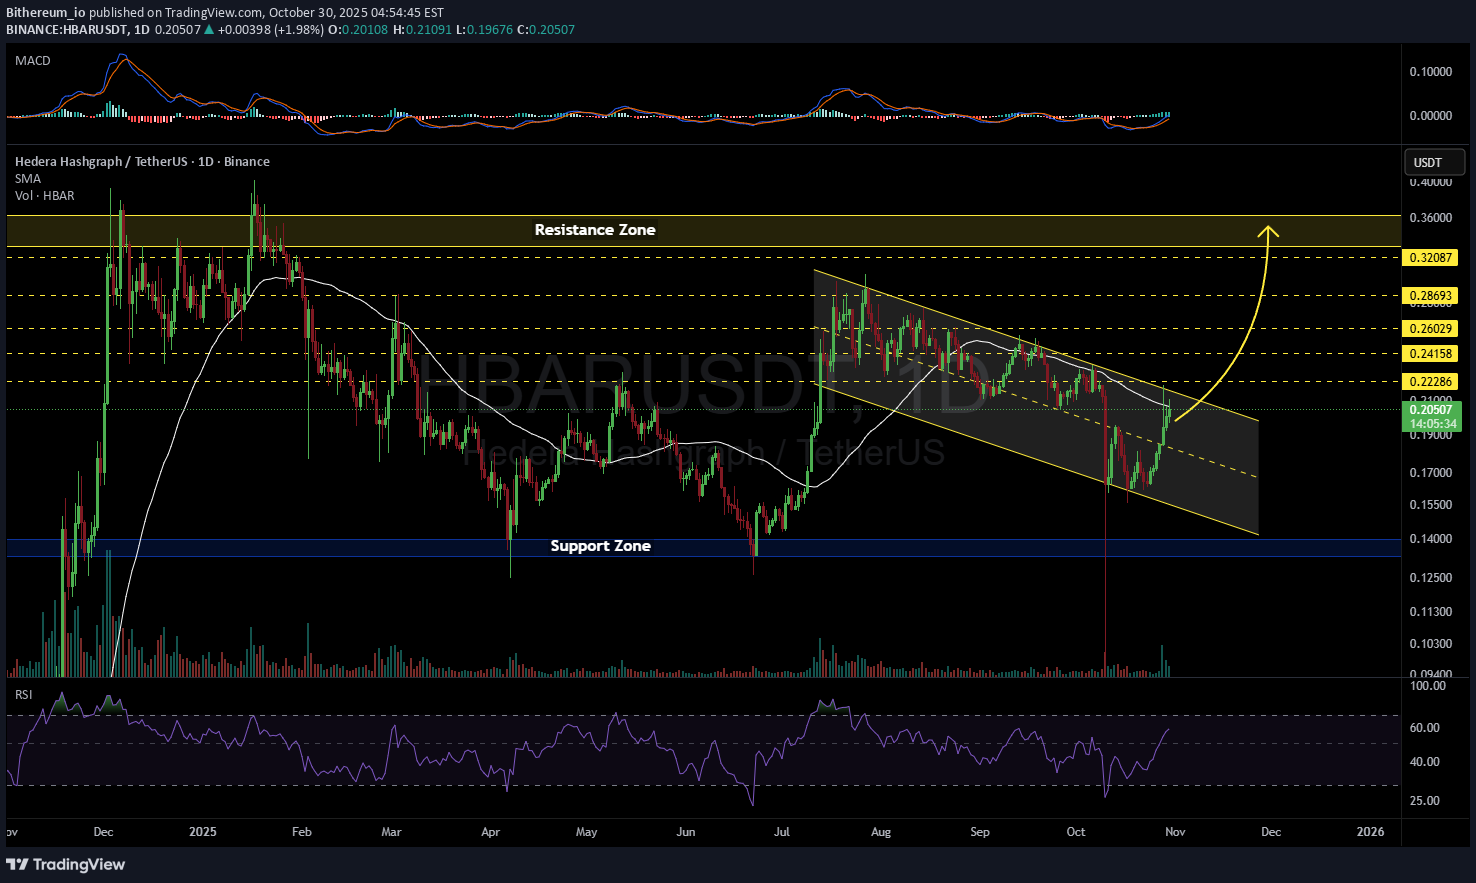
#HBAR is currently ranging between the support zone and resistance zone on the daily chart (zoomed-out view). On the zoomed-in view, it’s forming a bullish flag within the same timeframe. In case of a breakout above the flag resistance and the daily SMA50, the price is likely to move toward the resistance zone. Targets: 🎯 $0.22286 🎯 $0.24158 🎯 $0.26029 🎯 $0.28693 🎯 $0.32087 ⚠️ Always remember to use a tight stop-loss and maintain proper risk management.

keyvankho
تحلیل HBAR: حرکت انفجاری، لیکوئید شدنها و نقشه نهنگها برای صعود تا ۰.۴۳ دلار!
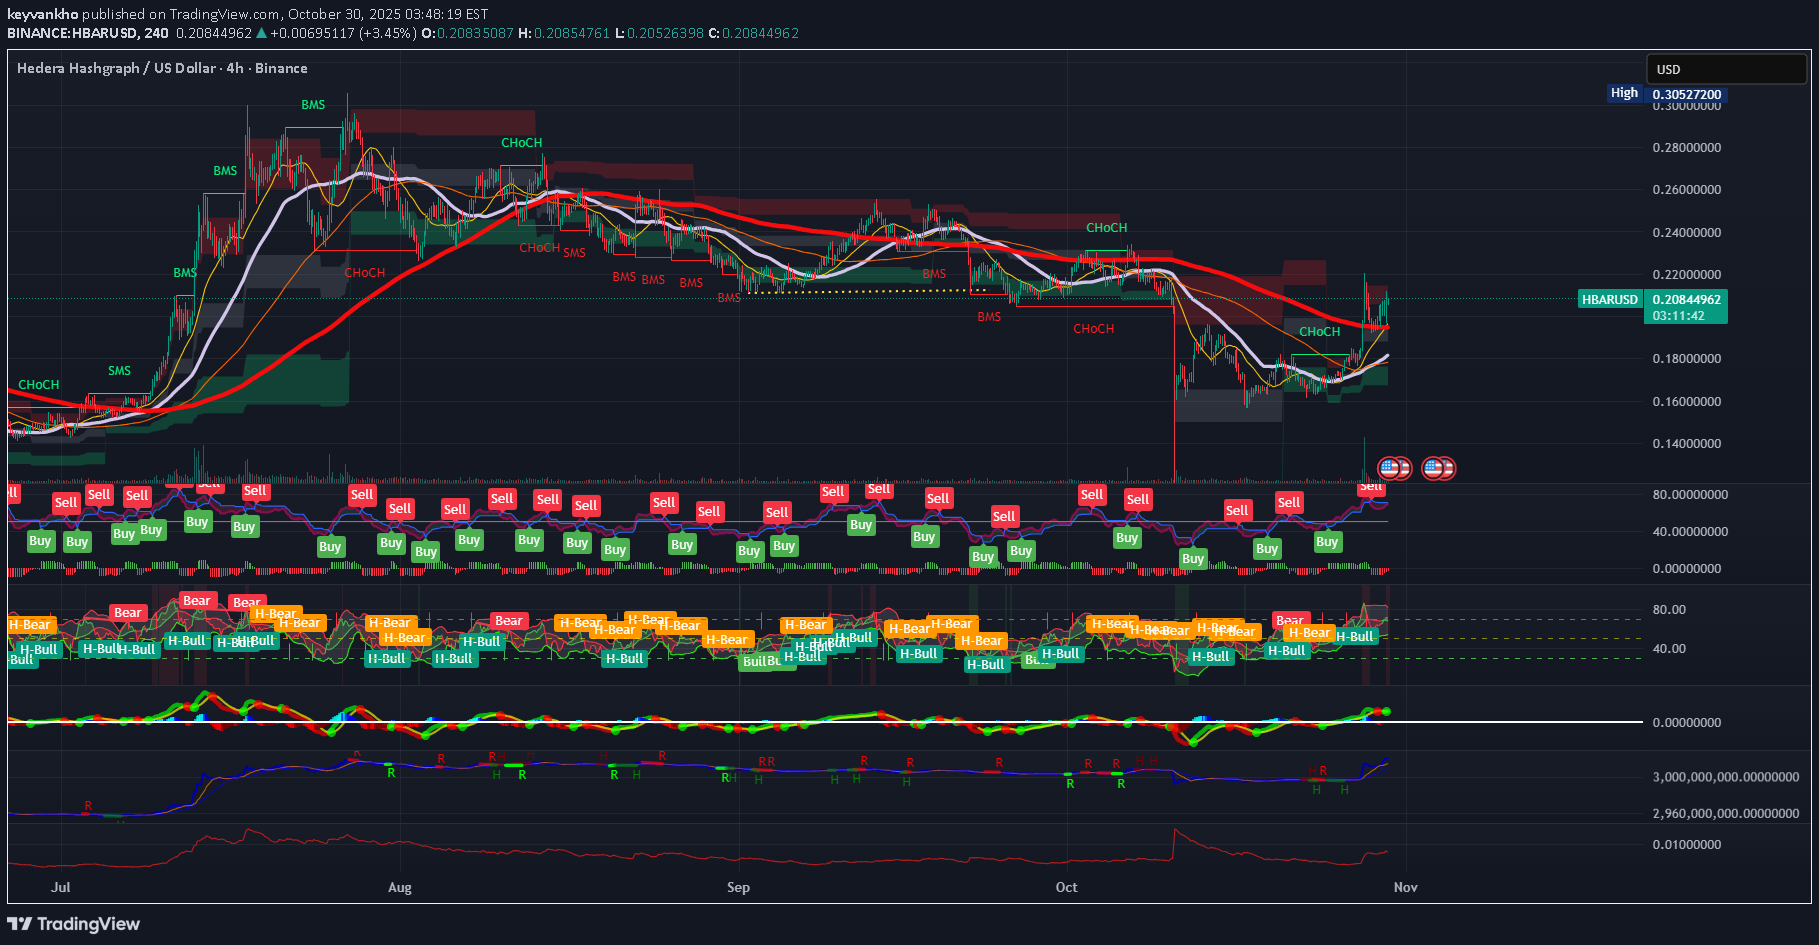
HBAR has completed a clean impulsive breakout structure from the $0.18 base and is now consolidating above the key support band at $0.203–$0.207, which is acting as the first institutional accumulation layer following the smart-money CHoCH and BOS sequence on the 4H. Price continues to print higher-lows on intraday frames, and volume data shows clear spot bid absorption on every dip into VWAP and the 0.382–0.5 retracement pockets. The next immediate move is expected to be a grind-up continuation toward the short-term liquidity cluster at $0.214, where a sweep of short positions and stop-loss liquidations could trigger a fast expansion to $0.223–$0.228, followed by a bullish extension zone targeting $0.235–$0.255 in the medium term. On the downside, liquidation pressure remains stacked below $0.203 and especially at $0.198 and $0.187, meaning if the market wicks aggressively lower, it is likely a liquidity hunt rather than a structural reversal — as long as price reclaims the zone quickly. Whale footprint is firmly bullish: accumulation has been consistent inside $0.182–$0.20 and demand has followed price upward, while distribution levels show passive profit-taking expected near $0.217–$0.223 and heavier sell walls layered into the $0.245–$0.26 range, meaning any breakout into these levels can trigger short-term volatility but should not be interpreted as a cycle top. Accordingly, the optimal execution plan remains buying dips into $0.203–$0.207 with risk defined below $0.198, targeting $0.214 → $0.223 → $0.245+ and scaling profits progressively while keeping a core long position for a potential cycle expansion toward $0.43 and beyond. This setup remains valid as long as HBAR does not close a daily candle below $0.198, and a panic invalidation trigger only activates on a structural failure beneath $0.182, which would temporarily shift structure into a corrective ABC pullback rather than a trend continuation. Until then, market structure, liquidity behavior, momentum indicators, and institutional flow remain aligned to the upside.HBAR Updated Institutional Price Narrative HBAR completed a textbook liquidity-driven correction after the impulsive breakout from the $0.18 zone, dipping below the previously defended $0.203–$0.207 support to sweep liquidity into the deeper demand pocket at $0.192–$0.187, exactly where large delta absorption and spot accumulation re-engaged. This move confirms that the earlier base was not a failure but a controlled liquidity harvest engineered to flush late longs and force inefficient liquidations before the next leg higher. The reaction from the $0.19 handle has been technically clean: order-flow charts show clear bullish CVD divergence, footprint data reveals aggressive passive absorption on red prints, and OBV stabilized instead of breaking trend — classic signs that smart money bought into forced selling. Momentum reset on lower timeframes without breaking HTF structure, which is exactly what healthy mid-trend pullbacks look like during expansion phases. More importantly, structural integrity was never violated: the higher-low sequence remains valid, the 4H cloud held, and price continues to trade inside the corrective box of Wave (4), preparing for a fresh Wave (5) extension leg. This pullback also aligns perfectly with Fibonacci symmetry, tagging the 0.5–0.618 retracement zone of the prior leg, which institutions frequently program bids into during trend continuation phases. Liquidity behavior confirms the next targets: short liquidations remain stacked at $0.204 → $0.214 → $0.223, meaning every micro reclaim is likely to accelerate price via stop-cascade mechanics. Above $0.223, a low-liquidity pocket runs into $0.235–$0.255, where the real breakout battle will happen. Whale maps still show no meaningful distribution at current levels — accumulation clusters remain concentrated between $0.182–$0.20, with supply signals only beginning above $0.245 and more aggressively near $0.26–$0.28**, indicating this pullback was engineered liquidity intake, not a top. From an execution standpoint, the correct play remains buying controlled dips into demand, not chasing green candles. Traders who bought the sweep into $0.19 executed optimally, but opportunity still exists as long as price remains above $0.188–$0.19 and especially above $0.183, the structural line defending the macro bullish bias. Any fast wick below $0.19 again would likely be another liquidity hunt rather than a reversal, provided the reclaim is immediate and accompanied by renewed CVD strength. As long as price holds above $0.183, this remains a continuation cycle.

DakuNit
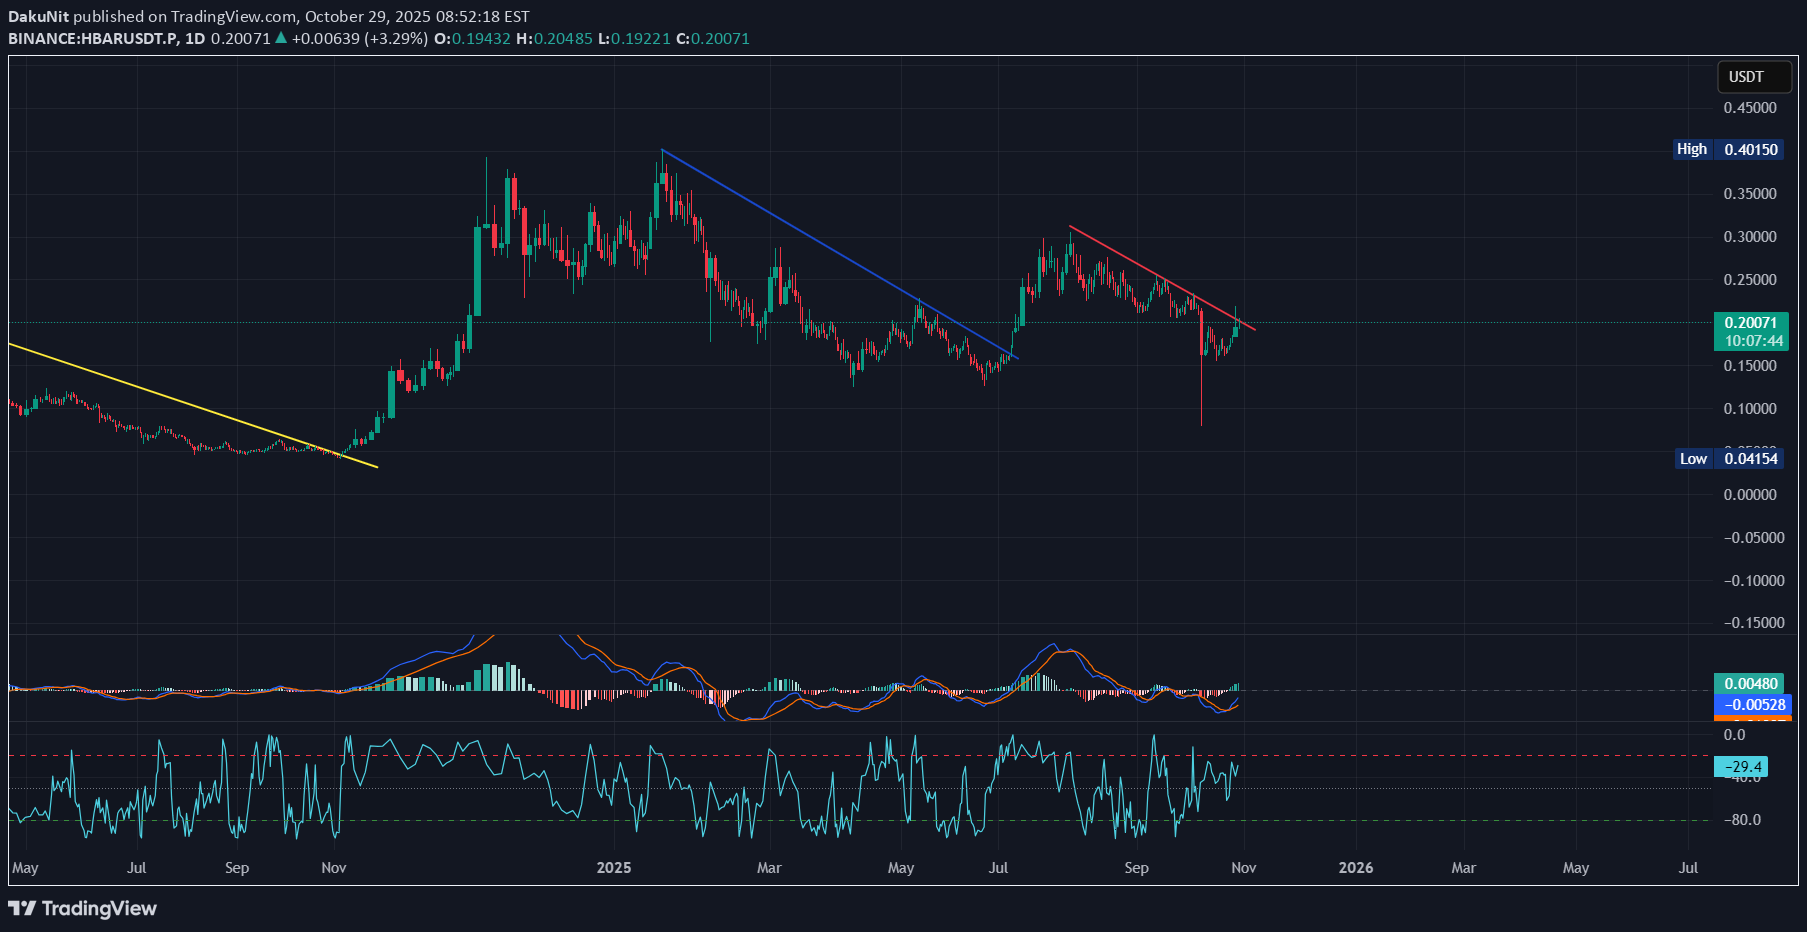
HBAR نیوز: چرا این آلتکوین با وجود نوسانات بیت کوین قوی است و زمان ورود فرا رسیده؟

CryptoYodaX
تحلیل تکنیکال HBAR: آیا کف دوقلو، هابار را به مرز 0.255 میرساند؟
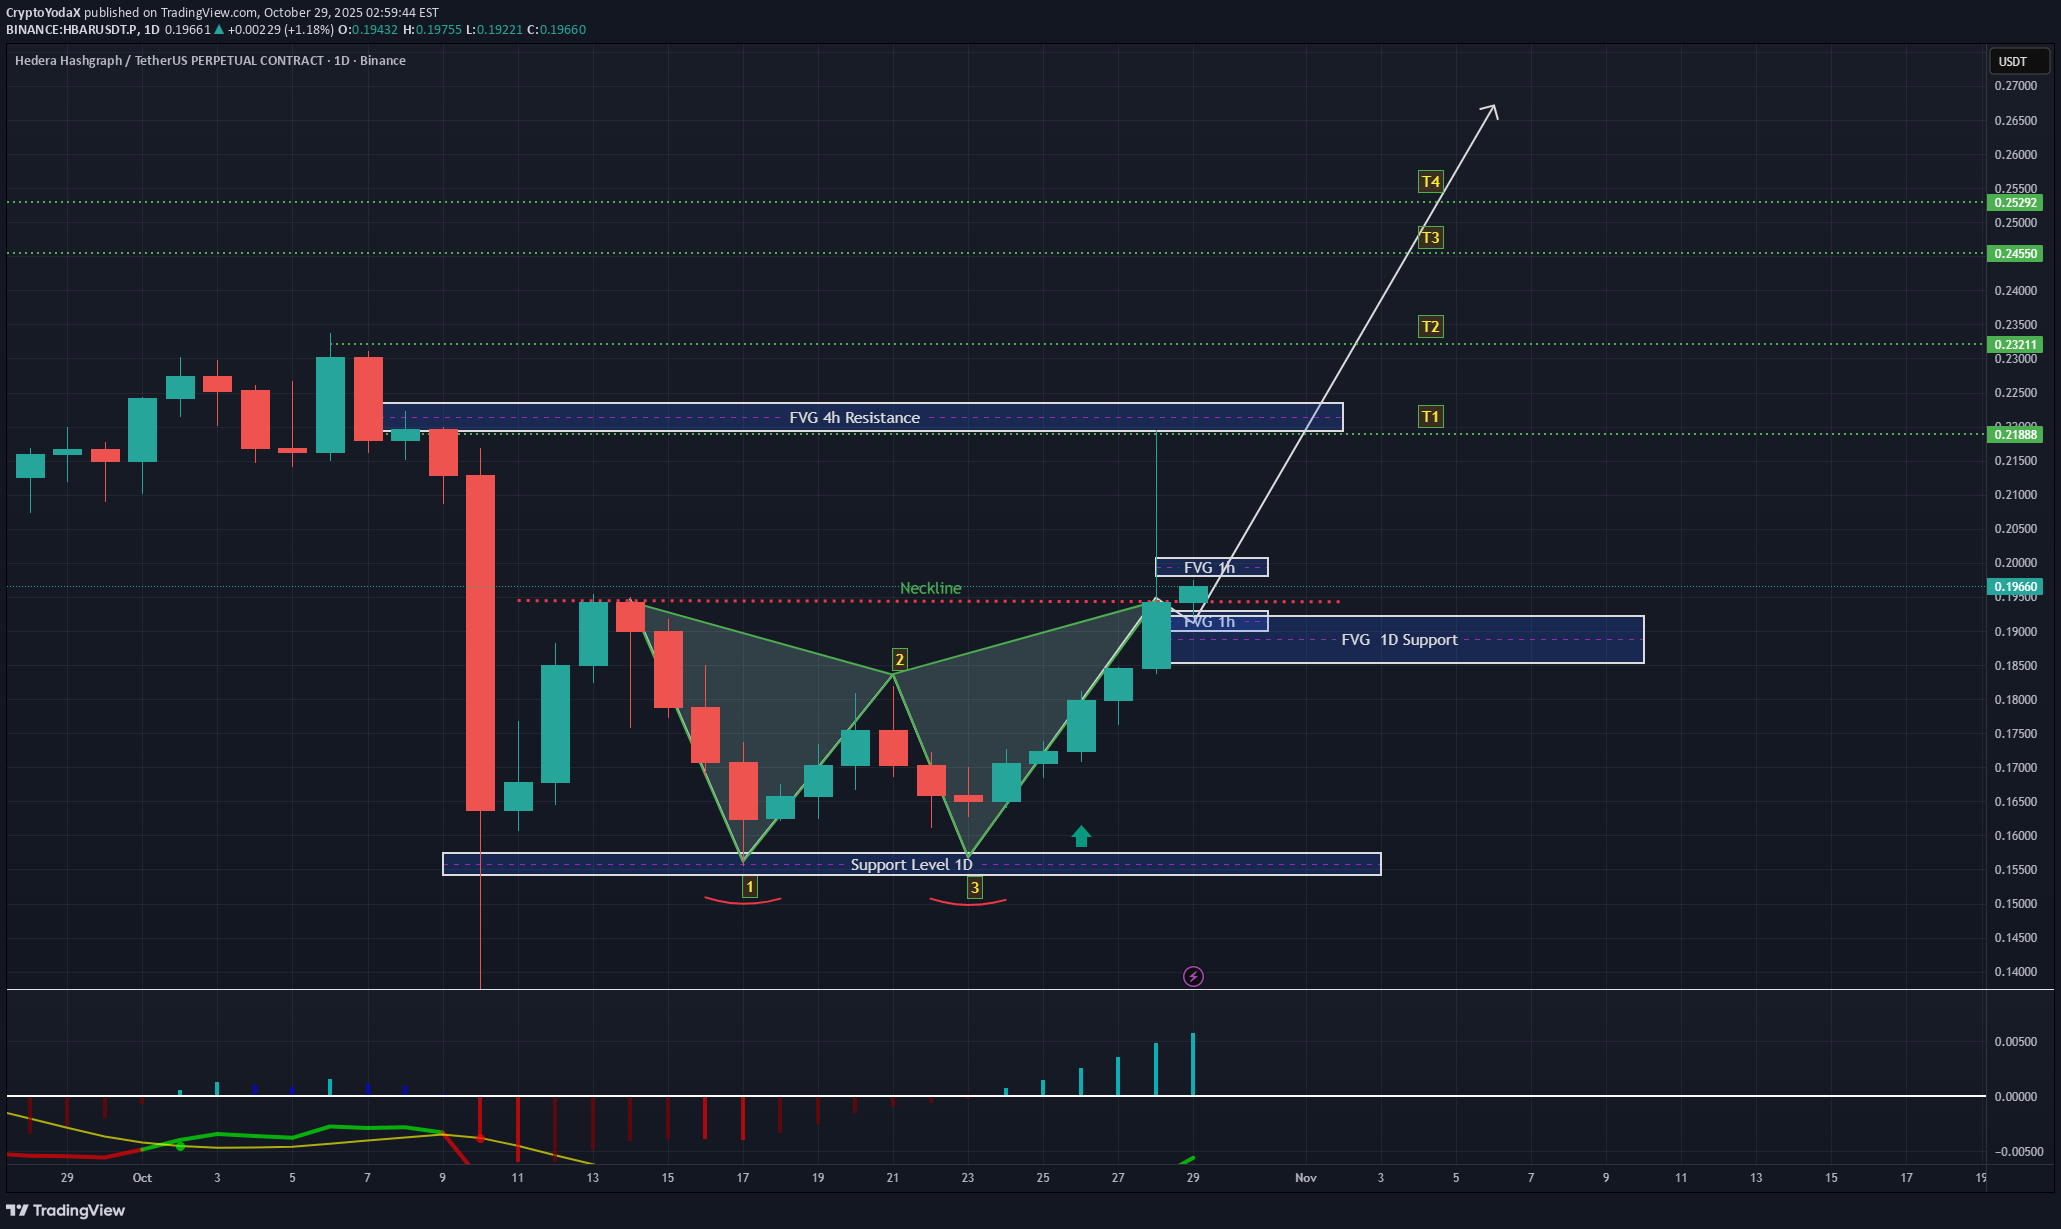
HBAR Technical Outlook (1H & 1D) On both the 1H and 1D charts, HBAR has confirmed a Double Bottom pattern around the 0.155–0.16 support level, followed by a strong breakout above the neckline. Price is now retesting the FVG 1H / 1D support zone ($0.19) — a healthy retracement that could serve as a base for continuation. As long as price holds above this support, the structure remains bullish, with potential targets at T1: $0.218, T2: $0.23, T3: $0.245, and T4: $0.255. Momentum indicators show a brief cooldown after the breakout, which often signals a re-accumulation phase before the next leg up. Invalidation would occur if price closes below the $0.185 area.
Alpha-GoldFX
هشدار صعودی بزرگ: آیا هِدرا (HBAR) آماده جهش 80 درصدی است؟ (الگوی گوه در حال تکمیل)
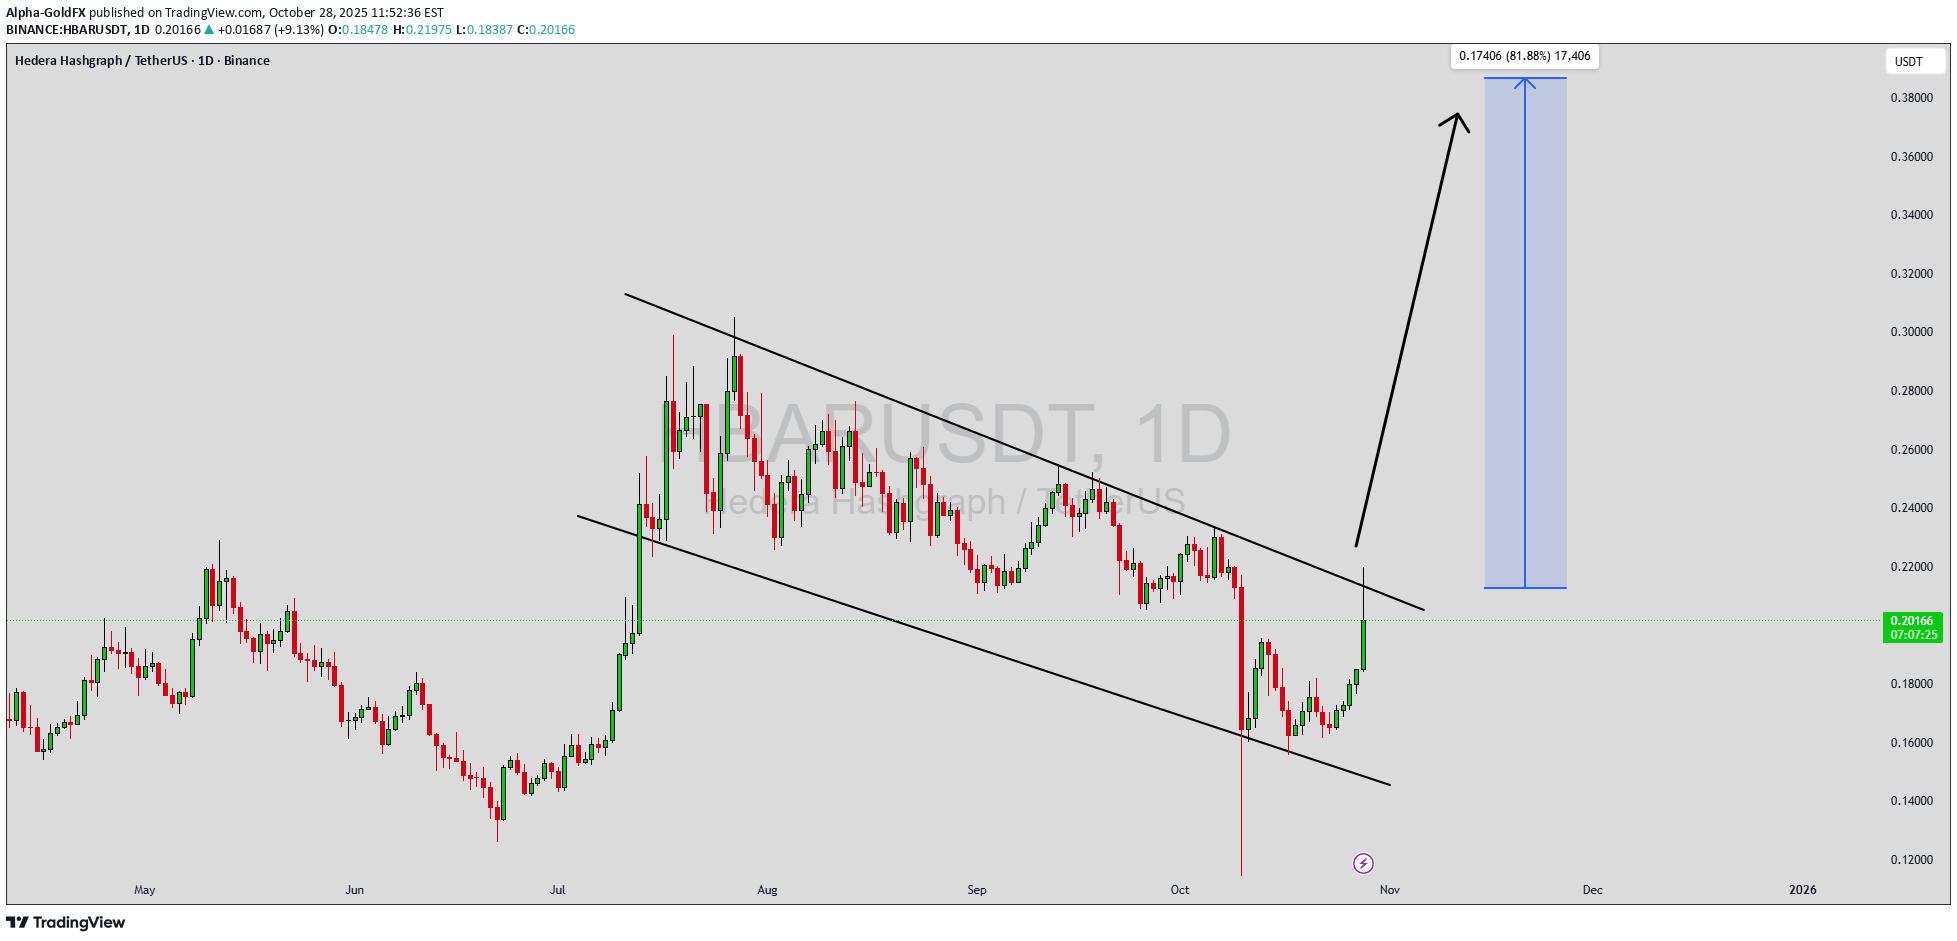
HBARUSDT is showing a strong technical setup as it forms a falling wedge pattern, a bullish reversal signal that often precedes a major upward breakout. After a period of price compression, the pair appears to be gaining strength as buyers begin to re-enter the market. This structure suggests that downward momentum is weakening, and the coin could be preparing for a sharp reversal to the upside. A confirmed breakout above the wedge resistance could open the door for a potential rally of 70% to 80% in the coming sessions. Trading volume for HBARUSDT remains steady and healthy, reinforcing the likelihood of a bullish breakout. This consistency in volume often indicates accumulation by smart investors during the consolidation phase. Once momentum picks up, the combination of increased demand and decreasing supply could drive prices higher rapidly. Traders are keeping a close eye on key resistance levels as the breakout zone approaches. Investor confidence in Hedera (HBAR) continues to grow due to its strong fundamentals, enterprise partnerships, and expanding ecosystem. The current technical pattern aligns perfectly with this sentiment, suggesting the potential for a new bullish cycle to begin soon. If the breakout is confirmed with strong volume, it could trigger a wave of renewed optimism across the HBAR community and the broader crypto market. ✅ Show your support by hitting the like button and ✅ Leaving a comment below! (What is You opinion about this Coin) Your feedback and engagement keep me inspired to share more insightful market analysis with you!

behdark
تحلیل تکنیکال HBAR: پایان اصلاح و آماده شدن برای ریزش؟ (سیگنال فروش کمریسک)
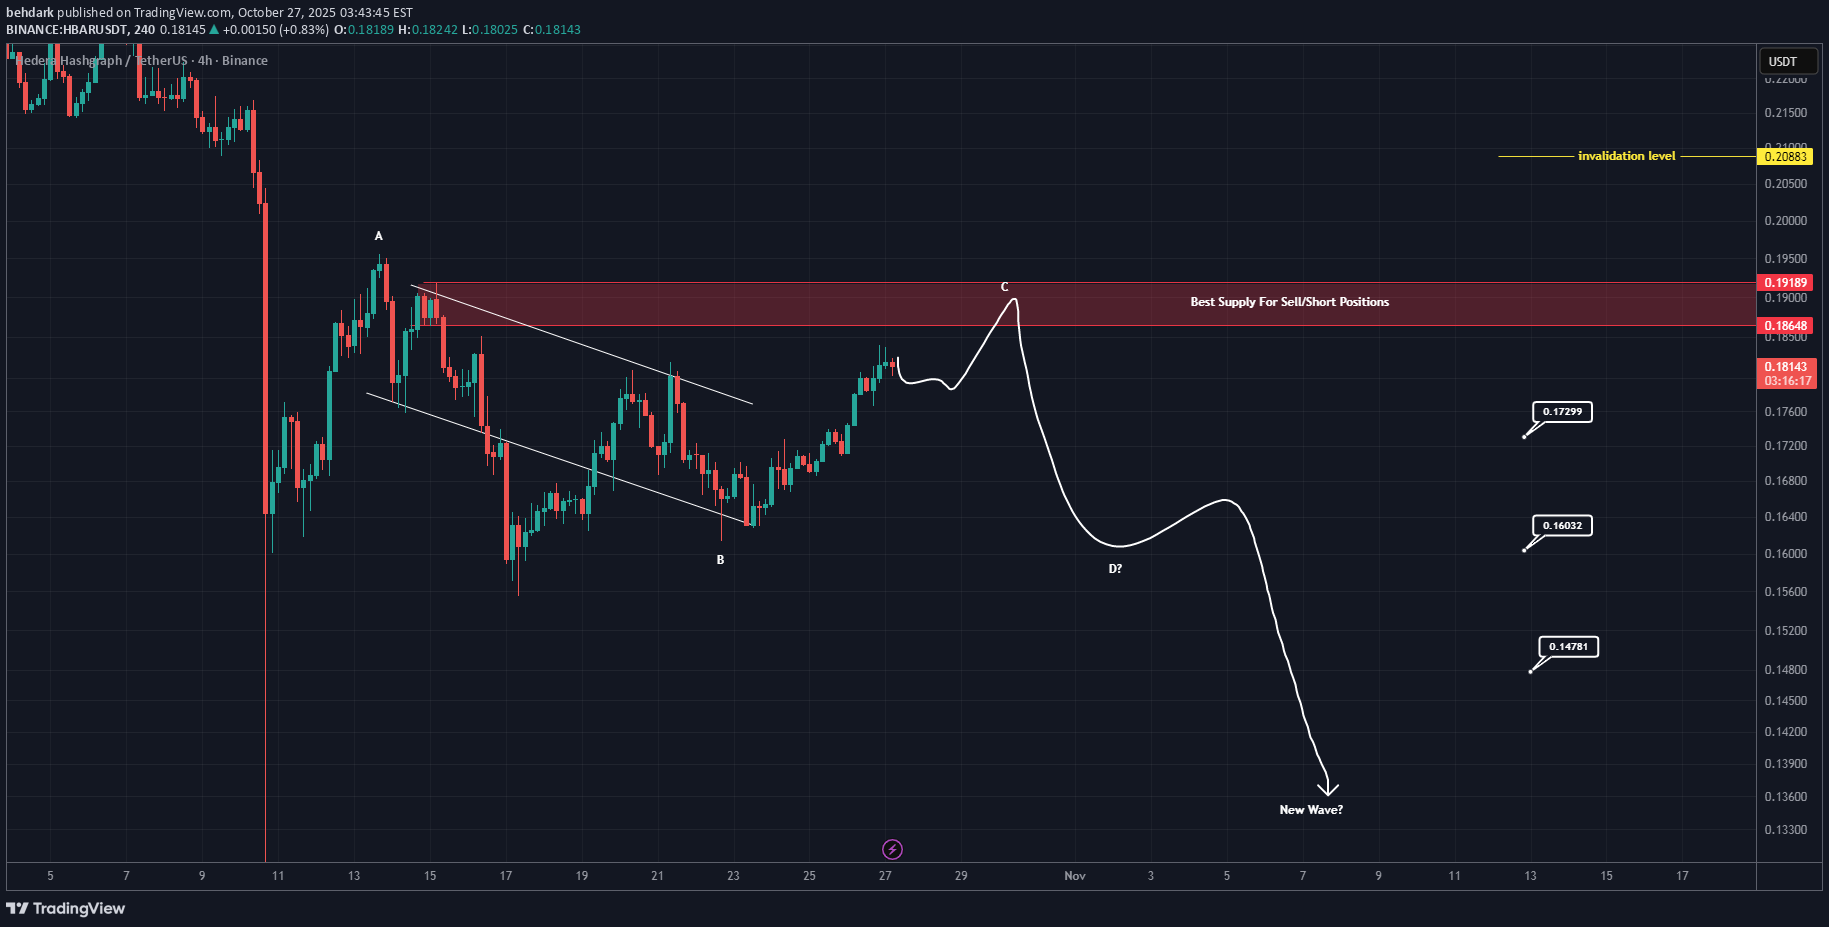
From the bottom, it seems the price is forming a corrective pattern, and we are now at the end of wave C. The price is expected to soon enter a correction for wave D or a new bearish wave. The low-risk area for sell/short positions is the red zone. Targets are marked on the chart. A daily candle close below the invalidation level will invalidate this analysis. For risk management, please don't forget stop loss and capital management When we reach the first target, save some profit and then change the stop to entry Comment if you have any questions Thank You
Disclaimer
Any content and materials included in Sahmeto's website and official communication channels are a compilation of personal opinions and analyses and are not binding. They do not constitute any recommendation for buying, selling, entering or exiting the stock market and cryptocurrency market. Also, all news and analyses included in the website and channels are merely republished information from official and unofficial domestic and foreign sources, and it is obvious that users of the said content are responsible for following up and ensuring the authenticity and accuracy of the materials. Therefore, while disclaiming responsibility, it is declared that the responsibility for any decision-making, action, and potential profit and loss in the capital market and cryptocurrency market lies with the trader.