
GRASS
Grass
| تریدر | نوع سیگنال | حد سود/ضرر | زمان انتشار | مشاهده پیام |
|---|---|---|---|---|
No results found. | ||||
Price Chart of Grass
سود 3 Months :
سیگنالهای Grass
Filter
Sort messages by
Trader Type
Time Frame

Malthus-JR

GRASS: I anticipate a rebound from the liquidity accumulation zo
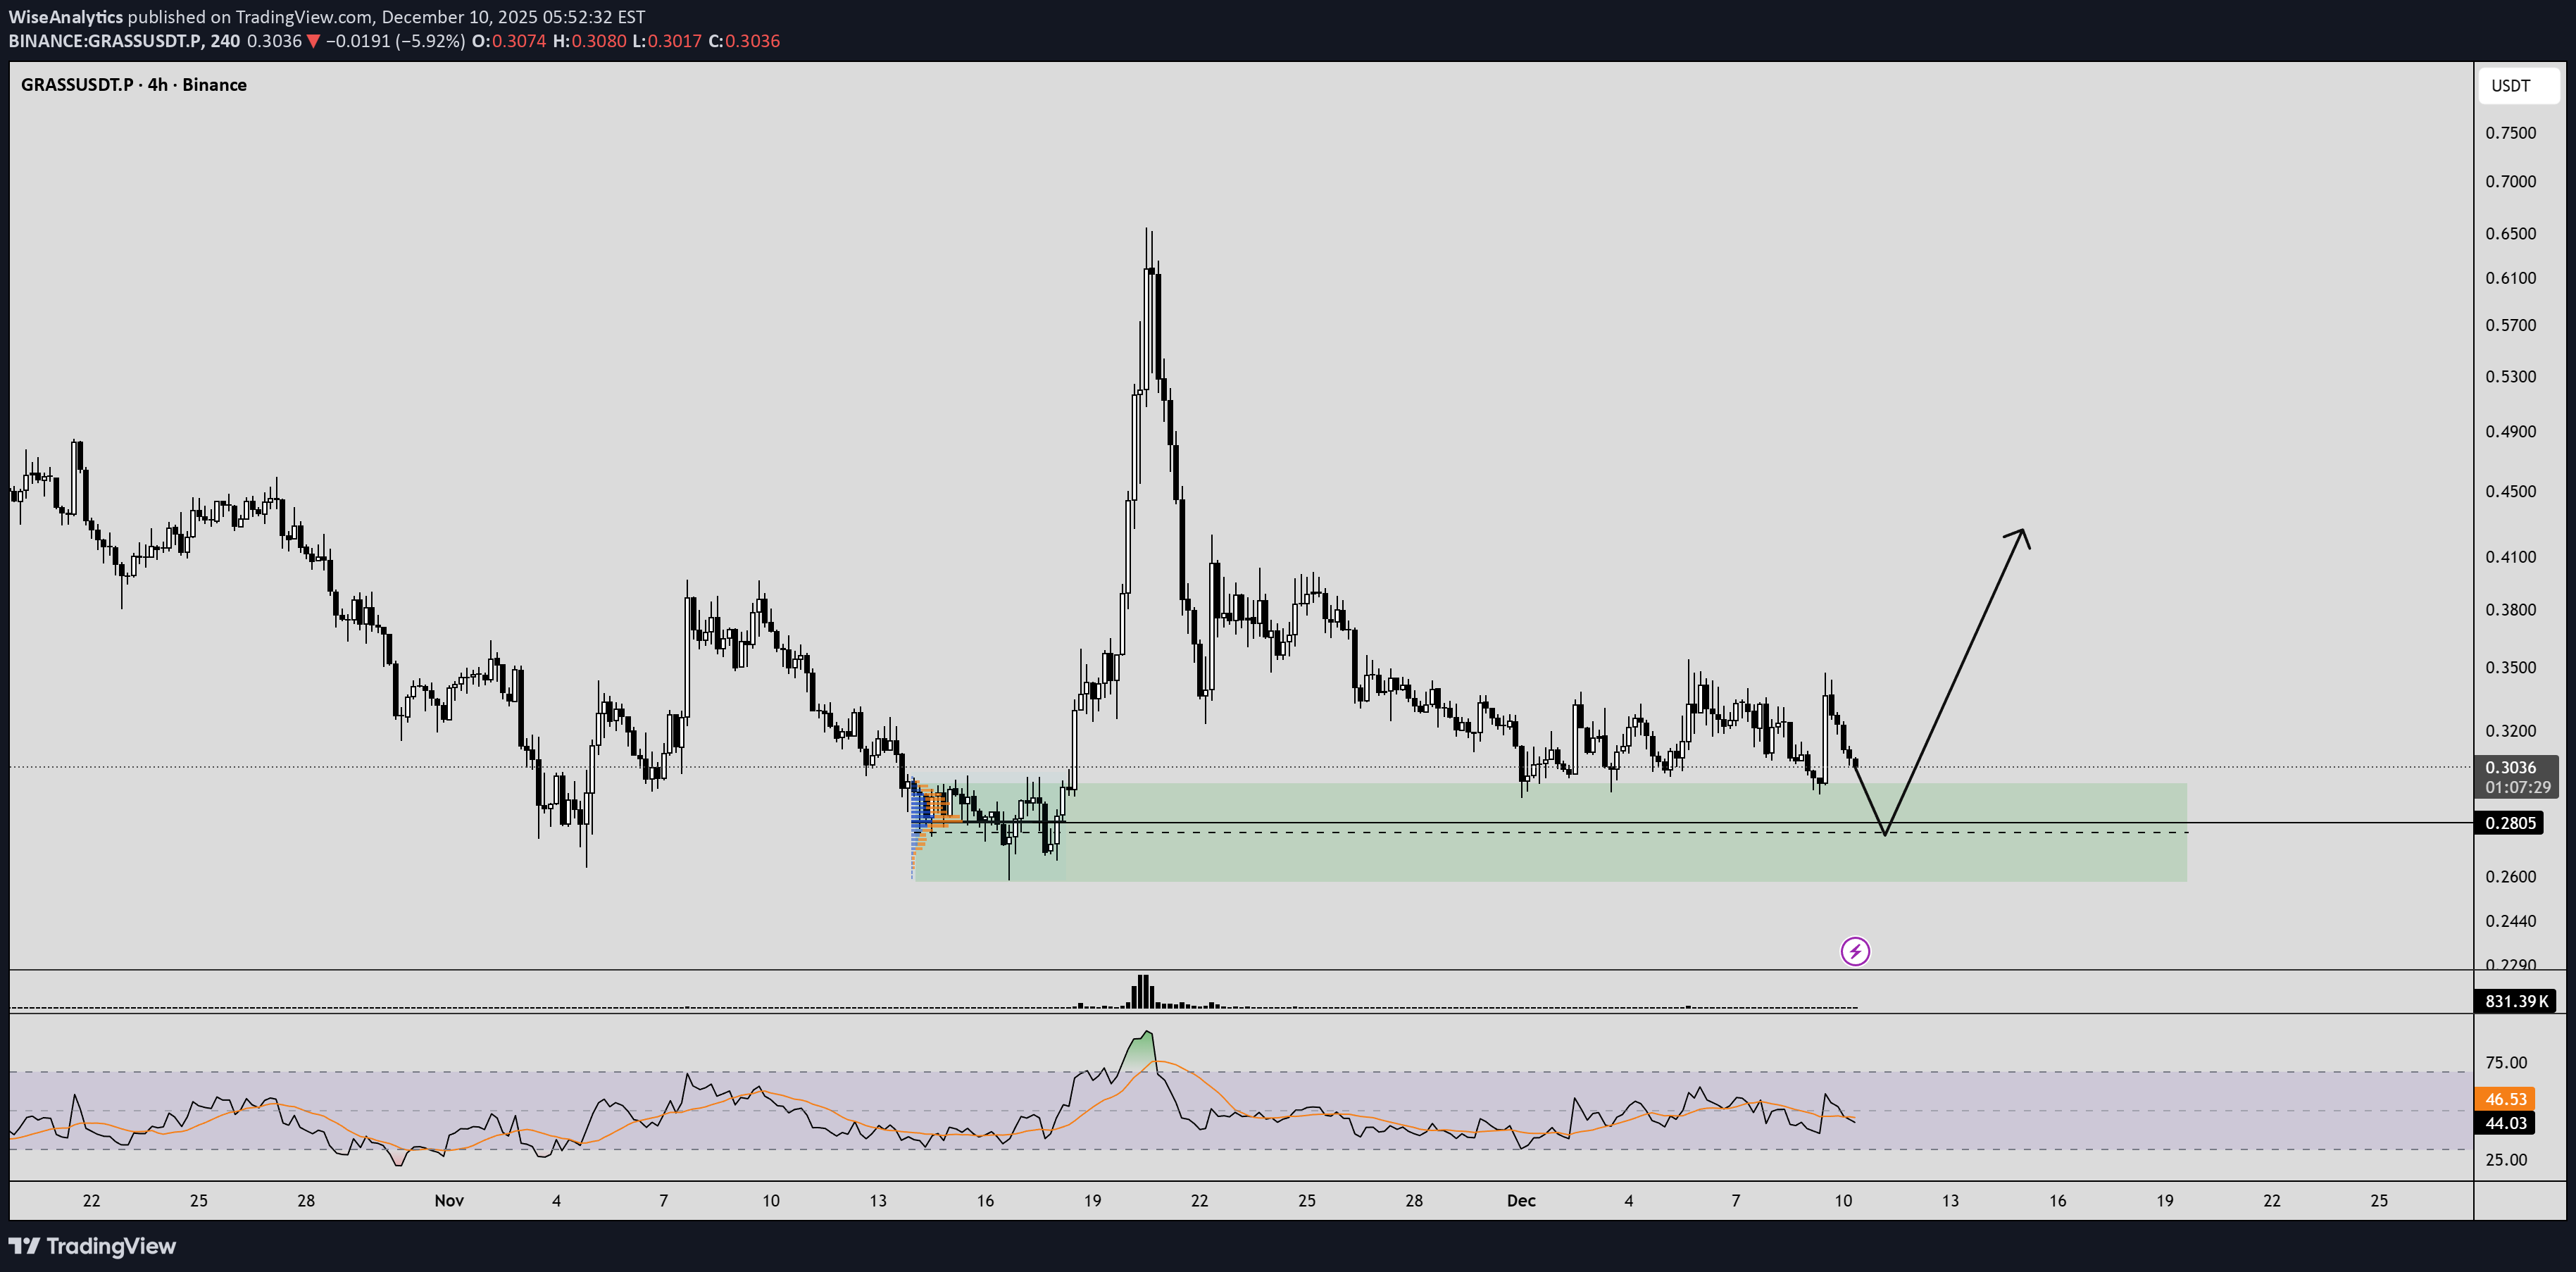
The picture and logic are simple. I expect a rebound from the liquidity zone. The plan is shown on the chart. Make your own decision. Use competent risk management.I'm fixing part of it and setting a stop at break-even. The market is still uncertain.

FittySh
تحلیل تکنیکال GRASSUSDT: فرصت خرید با پتانسیل سود 13 برابری!
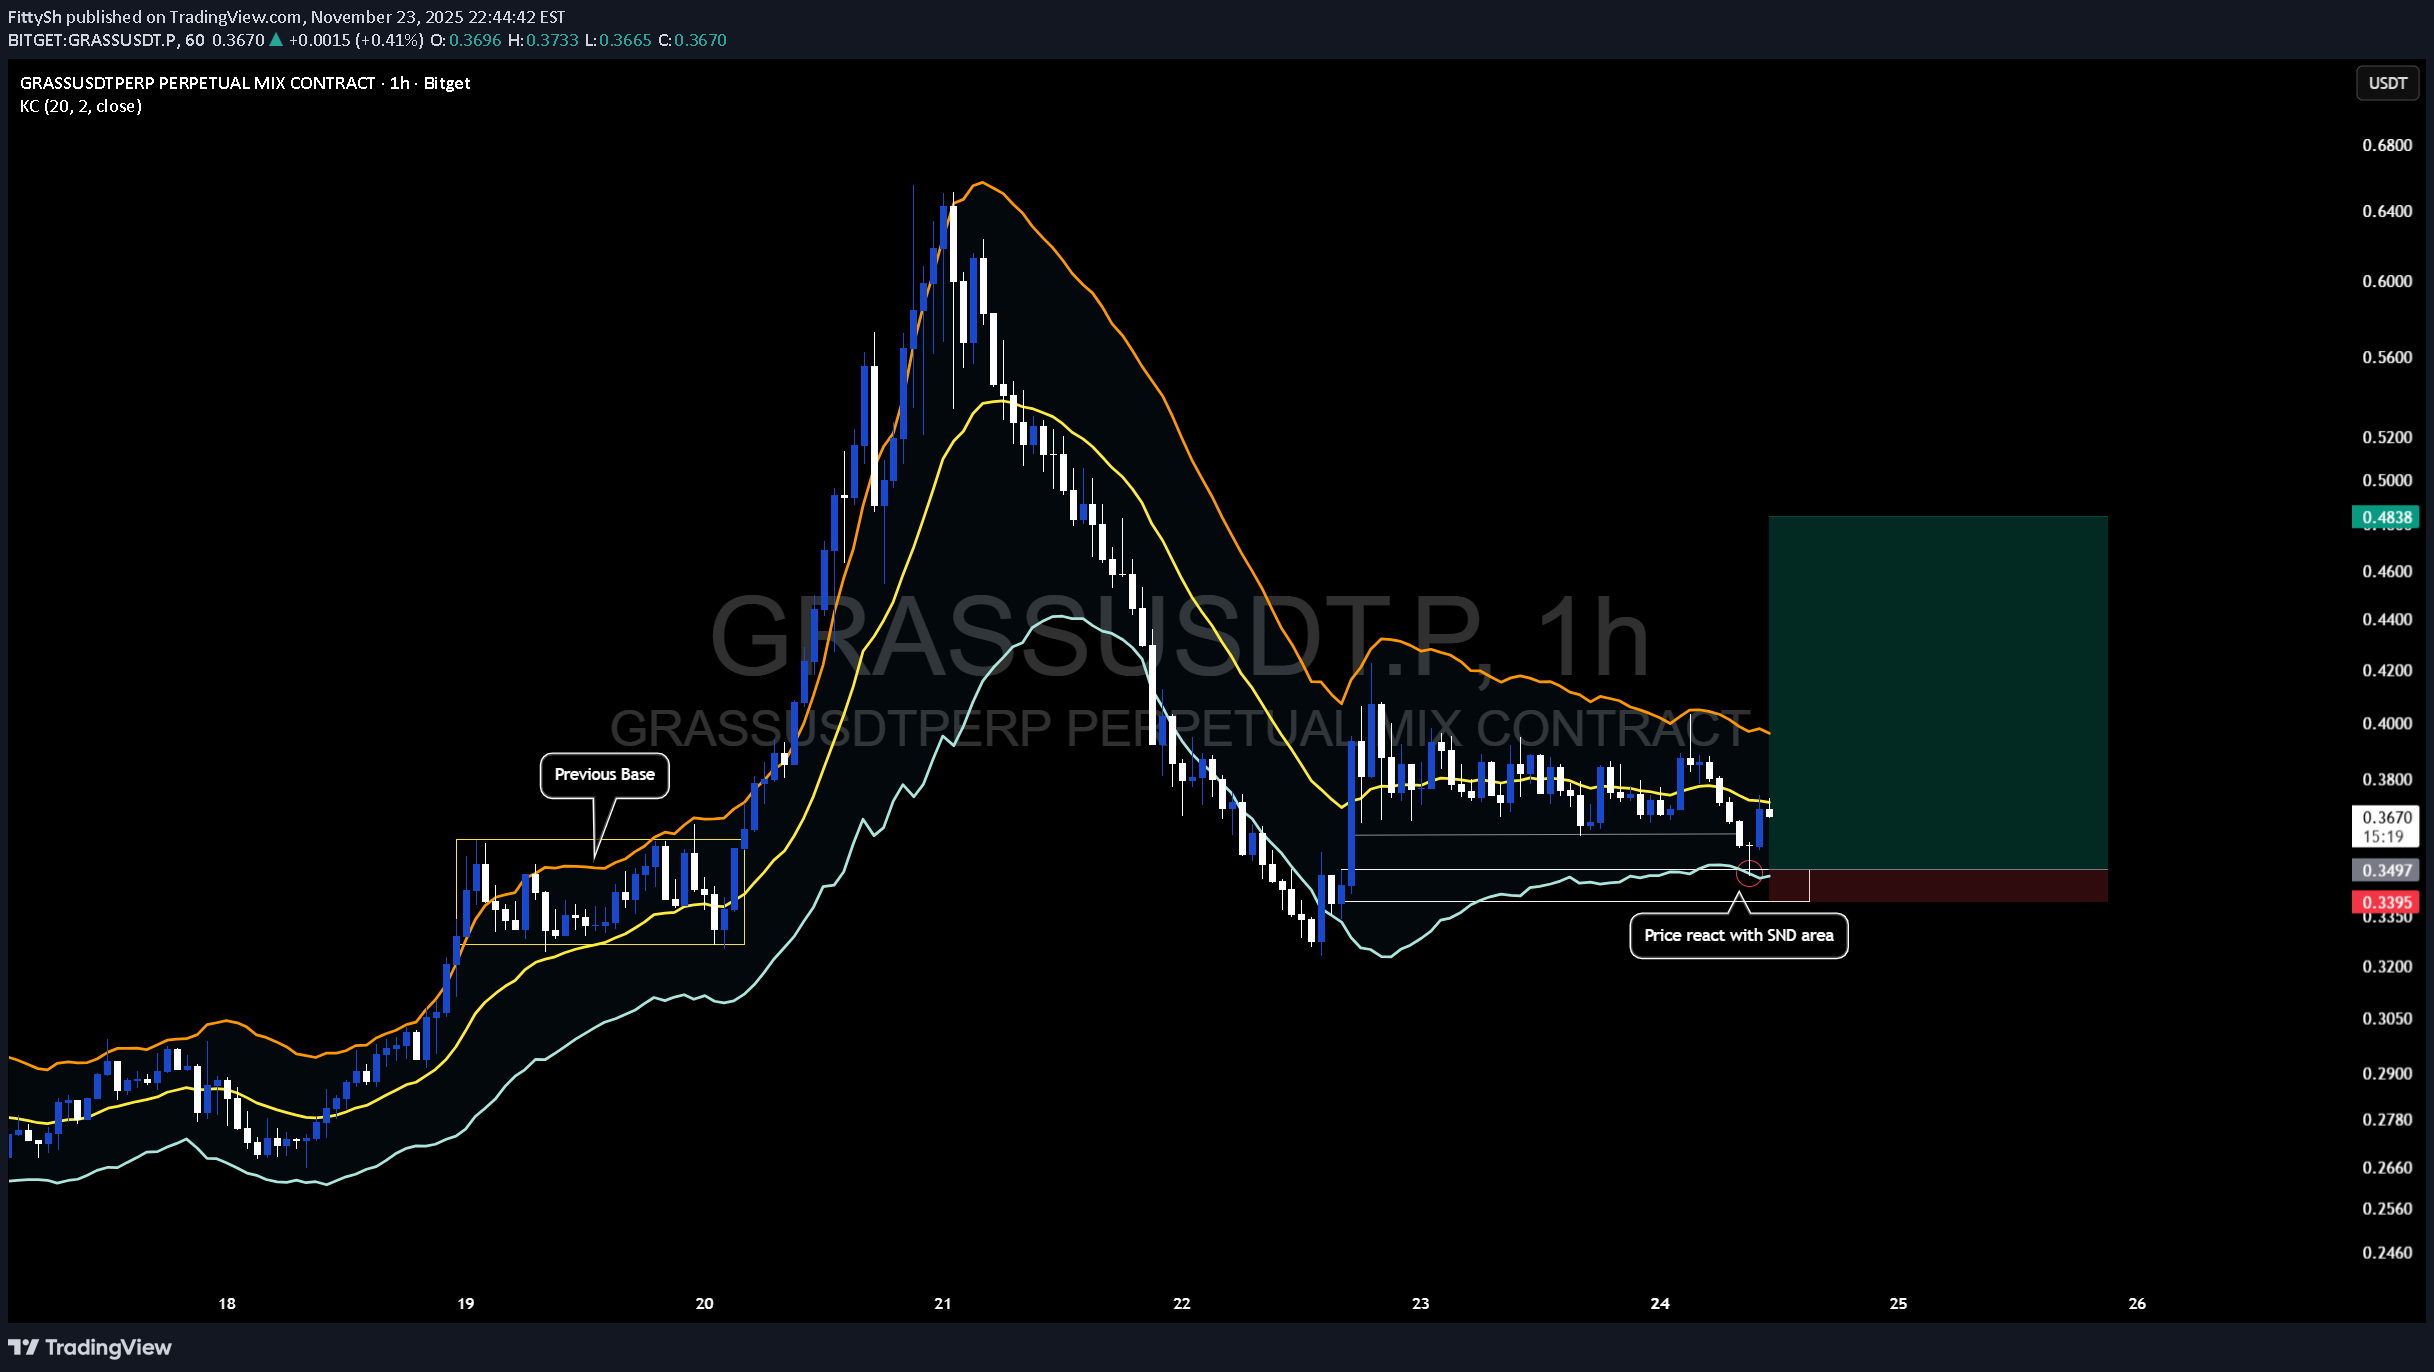
GRASSUSDT Trading Idea Price react with SND Area Zone(Supply Demand) and create rejection candle with supporting volume. Will see price goes to 0.44 ~ 0.45 if clear breakout. KC indicator also gives the positive reaction with price play through median zone. R:R Ratio: 13 DYOR!!

Cryptojobs
شوک صعود ۴۰ درصدی $GRASS: هدف نهایی محقق شد؛ حالا منتظر سقوط آزاد باشید؟
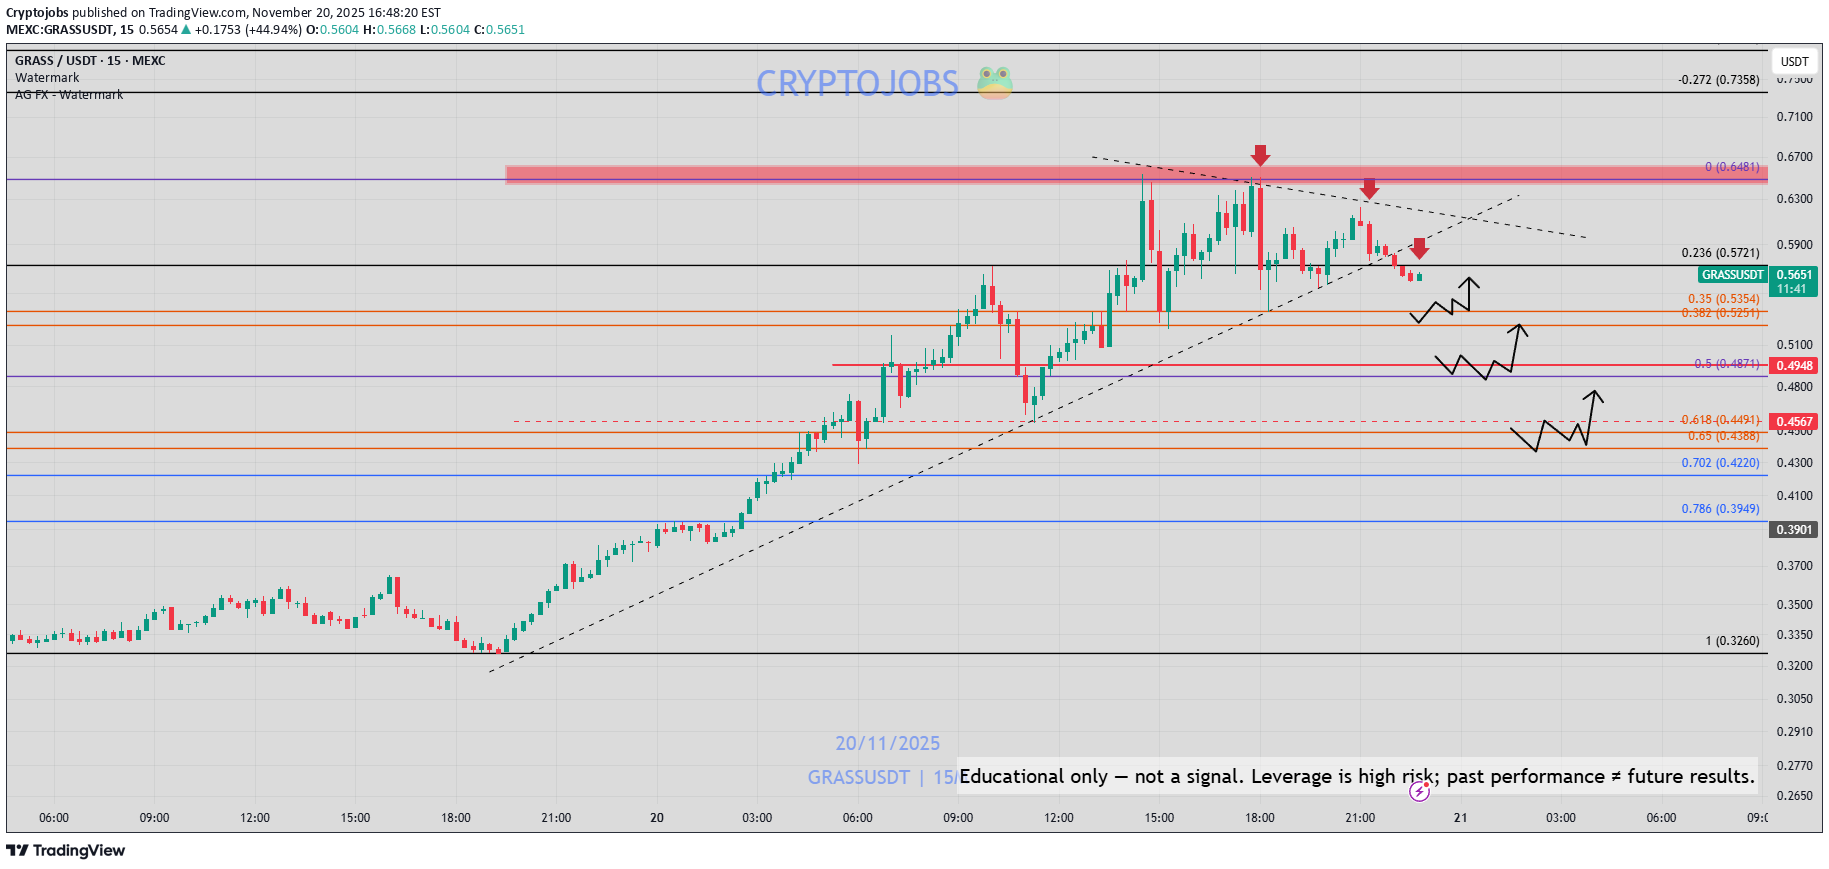
$GRASS - morning view was 🔥🔥🔥 +40% up from 0.470 to 0.660$ ✅ Key (final resistance) I shared has been hit nicely. 🎯 Solid rejection there,🔴 Meaning that we may see a sharp retracement/pull back toward the 0.480 - 0.500$ level next. Congrats

P_S_trade
افزایش عجیب قیمت گراس (GRASS): آیا آغاز یک روند صعودی بزرگ است یا فقط یک نوسان زودگذر؟
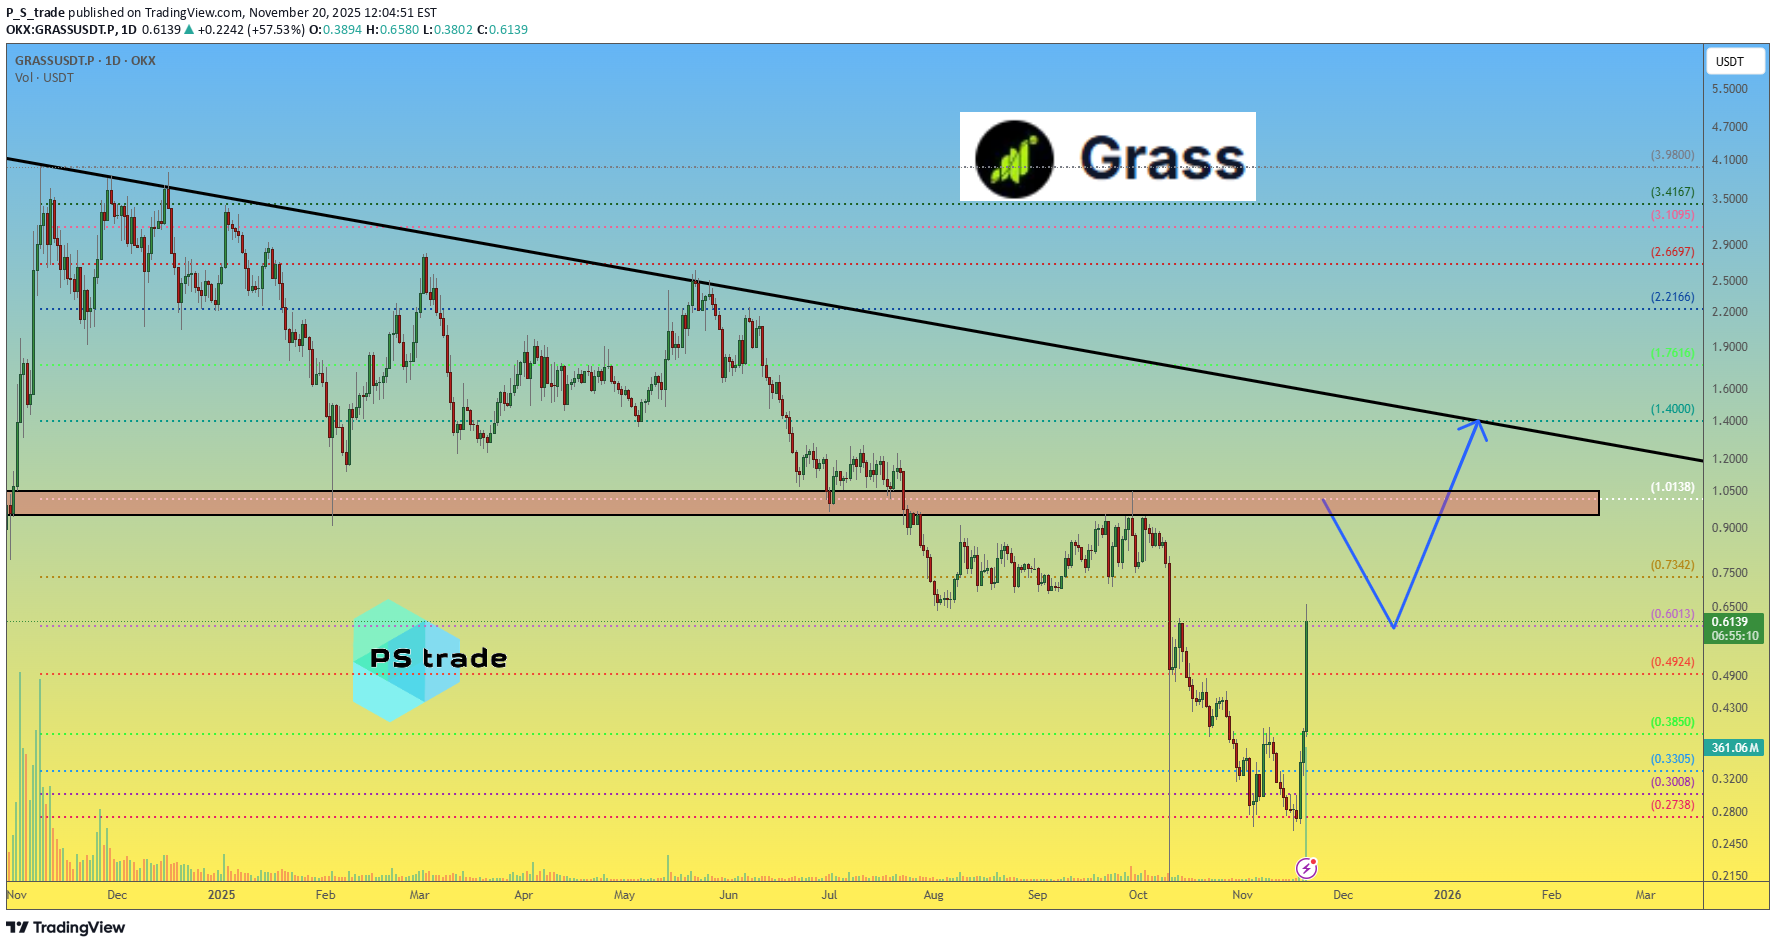
The market continues its broad consolidation decline, yet $GRASS suddenly shows an abnormal move: +130% in 3 days. Such behavior rarely occurs without a catalyst — most likely news, liquidity injections, or targeted market activity. From the current structure, GRASSUSDT.P may attempt an extension toward $1, although the resistance zone above $0.90 is unlikely to break on the first test. A corrective pullback could provide another accumulation opportunity near $0.60, with a mid-term target around $1.40. Key question for traders: Is this a short-term volatility spike, or the beginning of a structural trend reversal? ______________ ◆ Follow us ❤️ for daily crypto insights & updates! 🚀 Don’t miss out on important market moves 🧠 DYOR | This is not financial advice, just thinking out loud

Tealstreet
آیا $GRASS به ۰.۵۰ دلار میرسد؟ تحلیل صعودی و اهداف قیمتی جدید
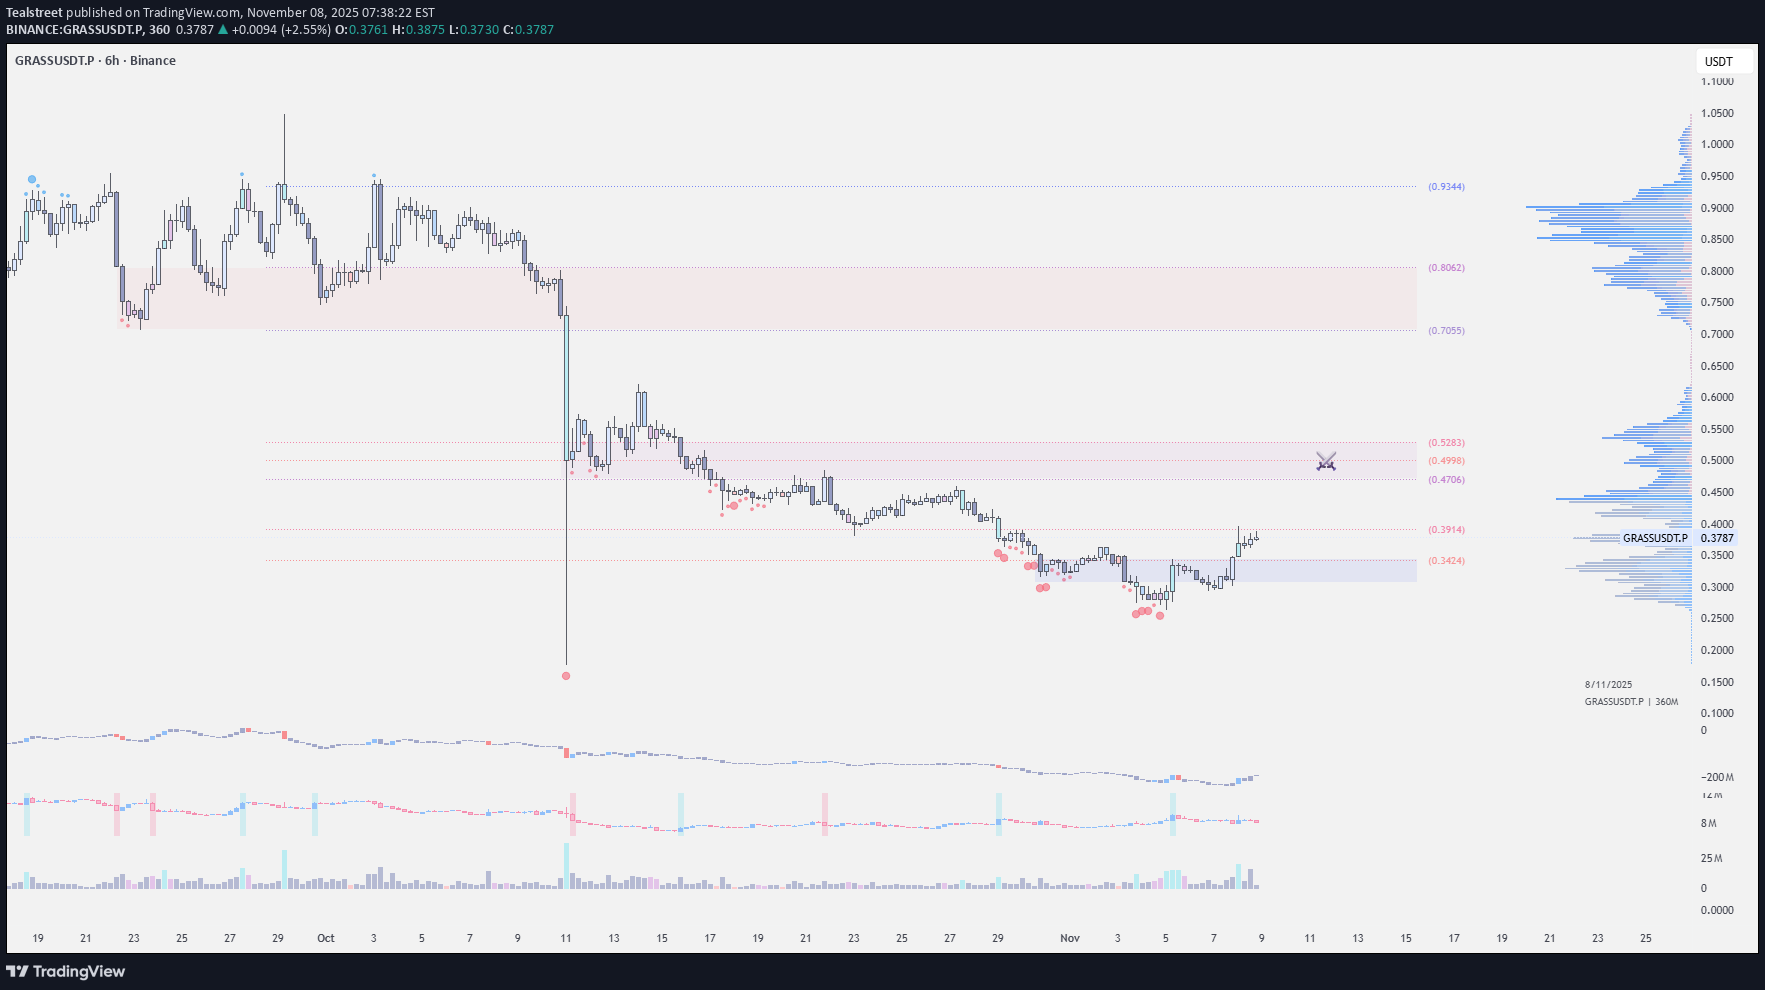
Over 100M $GRASS is now staked, with many of the tokens released to early investors this month being restaked and locked again. GRASS is redefining the DePIN landscape — turning idle internet bandwidth into an on-chain data asset. Recent interest stems from rising investor focus on the DePIN sector, with backers such as Polychain Capital, Delphi Ventures, and Hack VC supporting Grass’s mission to decentralize data access. Technical View: Currently trading at $0.3846, the token has gained momentum alongside growing demand for decentralized data networks. $GRASS is showing a healthy rebound from the $0.30 support zone. On the 6-hour timeframe, price is consolidating above $0.34 with rising volume, indicating renewed buying momentum and potential for another leg up. If price holds the 0.36–0.34 zone, we could see a move toward 0.45–0.47, with the next leg aiming for 0.50–0.52
Cryptojobs
پیشبینی دقیق معاملهگر: هدف چهارم (TP4) ارز **GRASS** محقق شد!
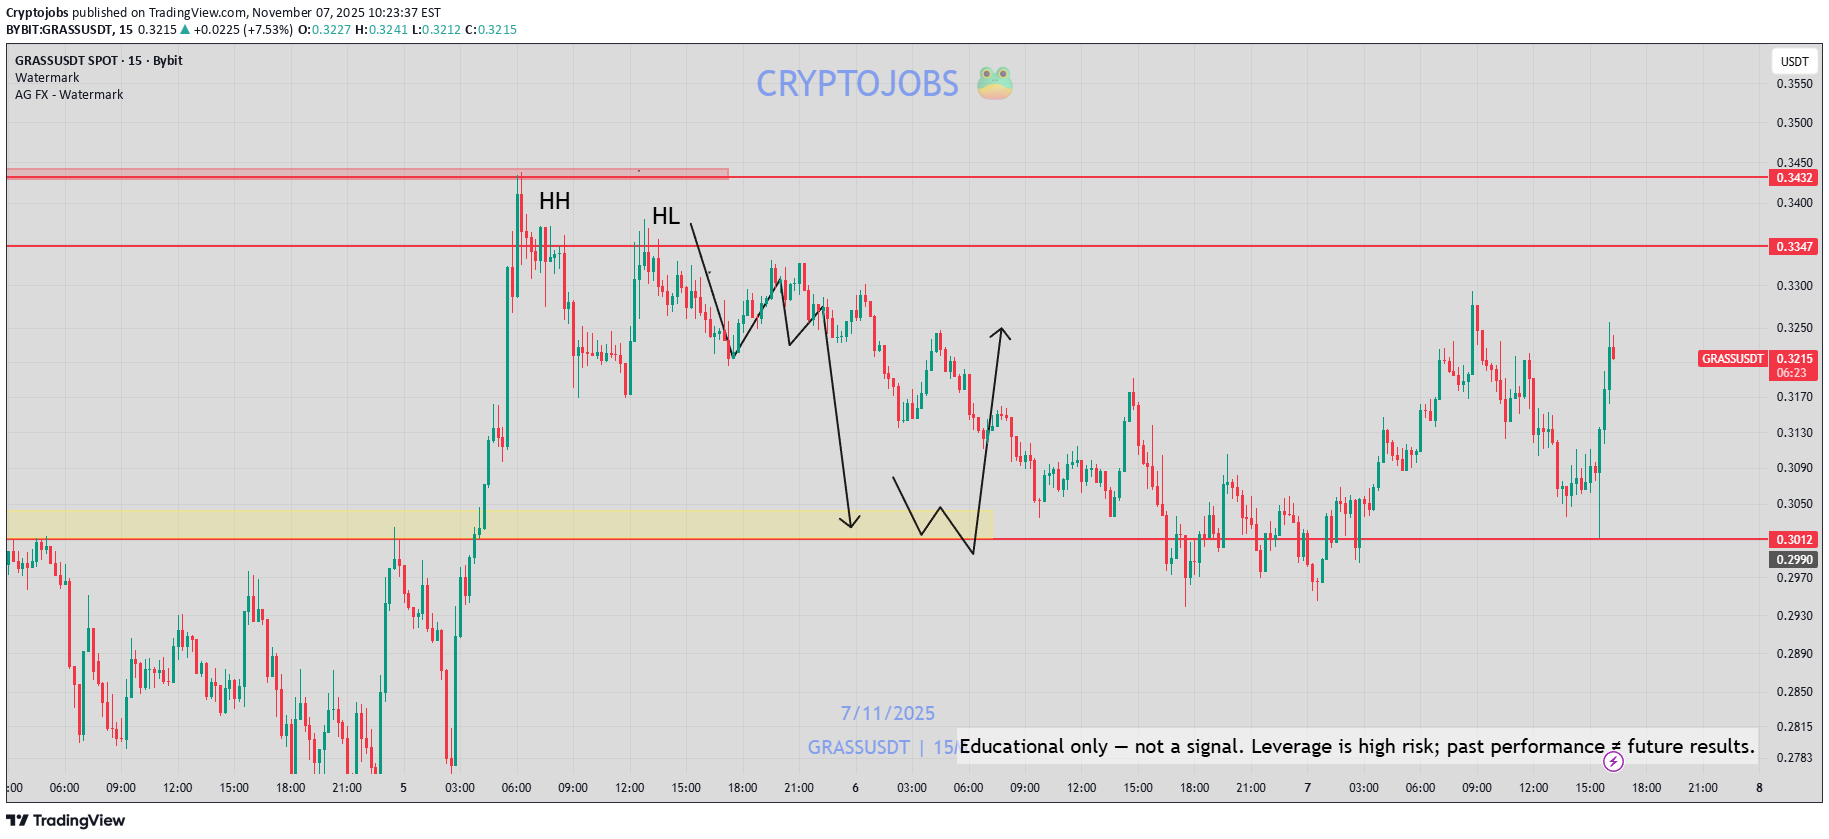
In long or in short? I don't care, my Froggy Guru technical outlook skills is pure experience 🐸🔥 Yesterday's setup: #GRASS -->my TP4 HIT ✅🔥 -12% ✅

DAY11
معامله بلندمدت $GRASS: تحلیل تکنیکال و نقاط ورود/خروج دقیق

$grass Grass is forming symmetrical triangle pattern in the daily chart . Long- $0.53 Stop Loss- $0.1477 Take Profit 1- $1.5 Take Profit 2- $2.51 Take Profit 3- $3.47 Take profit 4- $4.77


GLANZZ
Grass takip edilmeli YTD
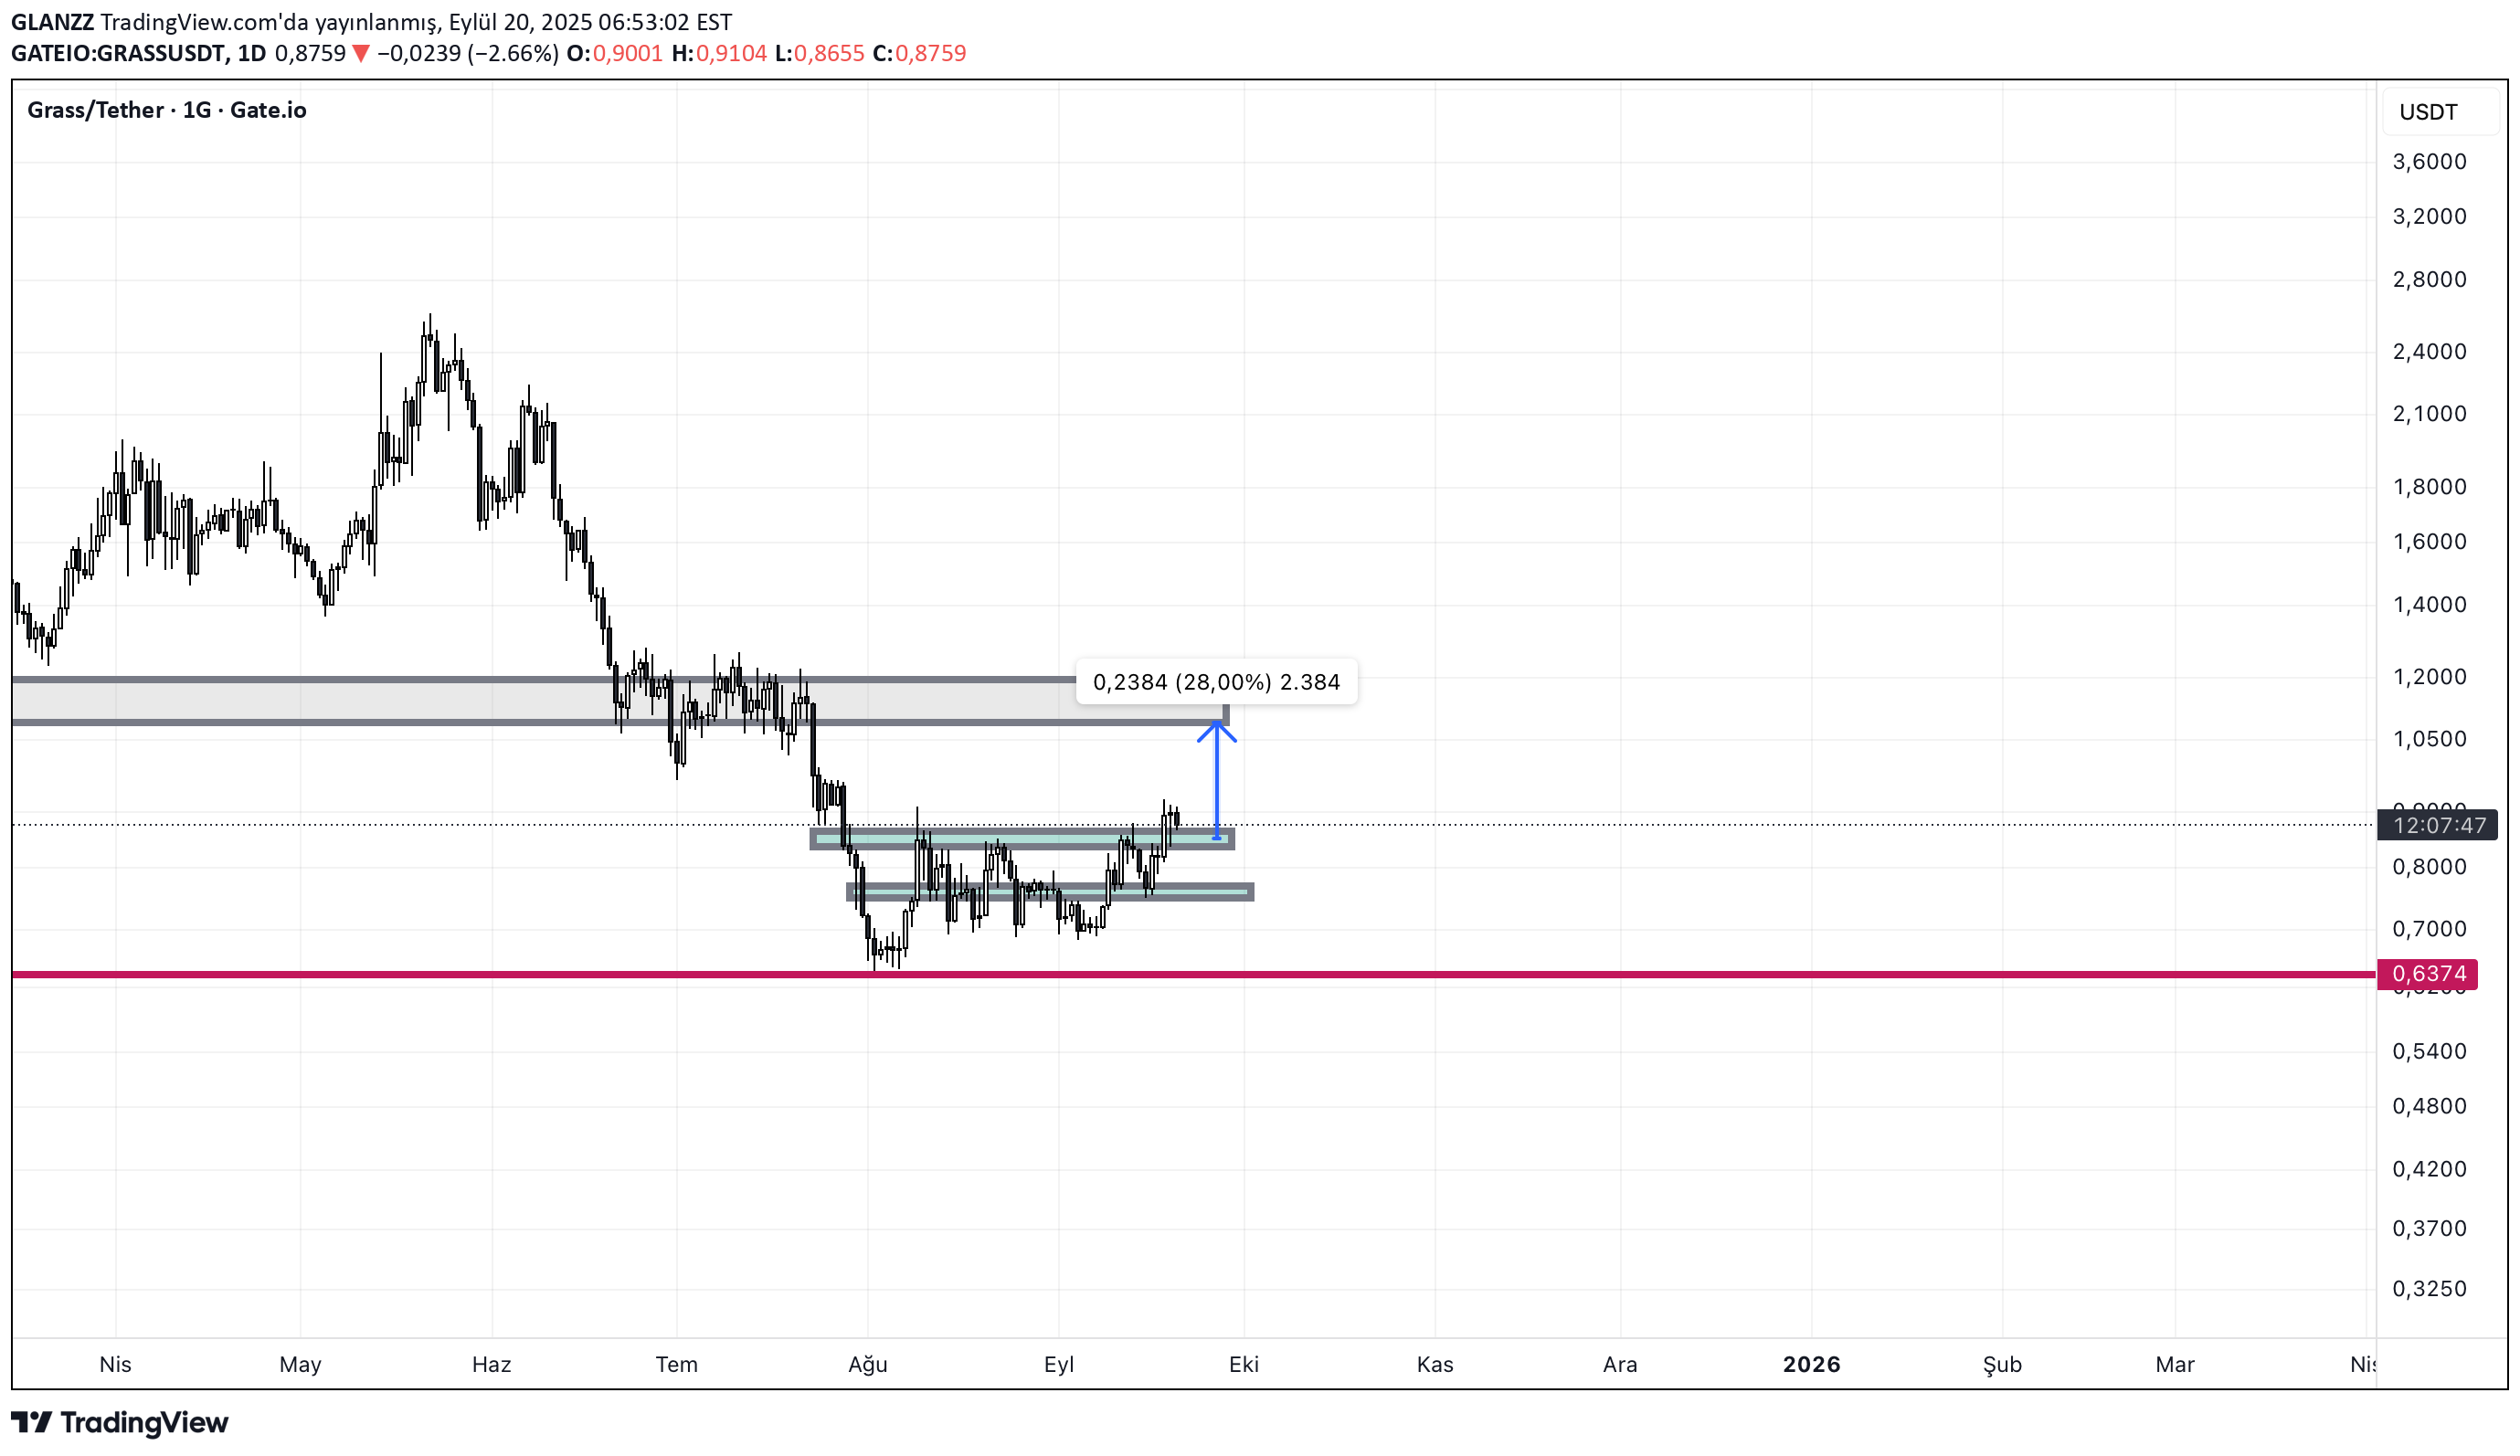
The graphic that uses the Solana system looks nice and has won the resistance in the diary and has turned it into support and now I think that a little more liquidity is cleaned and I think it will turn its direction again ...
Disclaimer
Any content and materials included in Sahmeto's website and official communication channels are a compilation of personal opinions and analyses and are not binding. They do not constitute any recommendation for buying, selling, entering or exiting the stock market and cryptocurrency market. Also, all news and analyses included in the website and channels are merely republished information from official and unofficial domestic and foreign sources, and it is obvious that users of the said content are responsible for following up and ensuring the authenticity and accuracy of the materials. Therefore, while disclaiming responsibility, it is declared that the responsibility for any decision-making, action, and potential profit and loss in the capital market and cryptocurrency market lies with the trader.