
GALA
Gala
| تریدر | نوع سیگنال | حد سود/ضرر | زمان انتشار | مشاهده پیام |
|---|---|---|---|---|
خرید | حد سود: تعیین نشده حد ضرر: تعیین نشده | 12/31/2025 | ||
خرید | حد سود: تعیین نشده حد ضرر: تعیین نشده | 12/13/2025 |


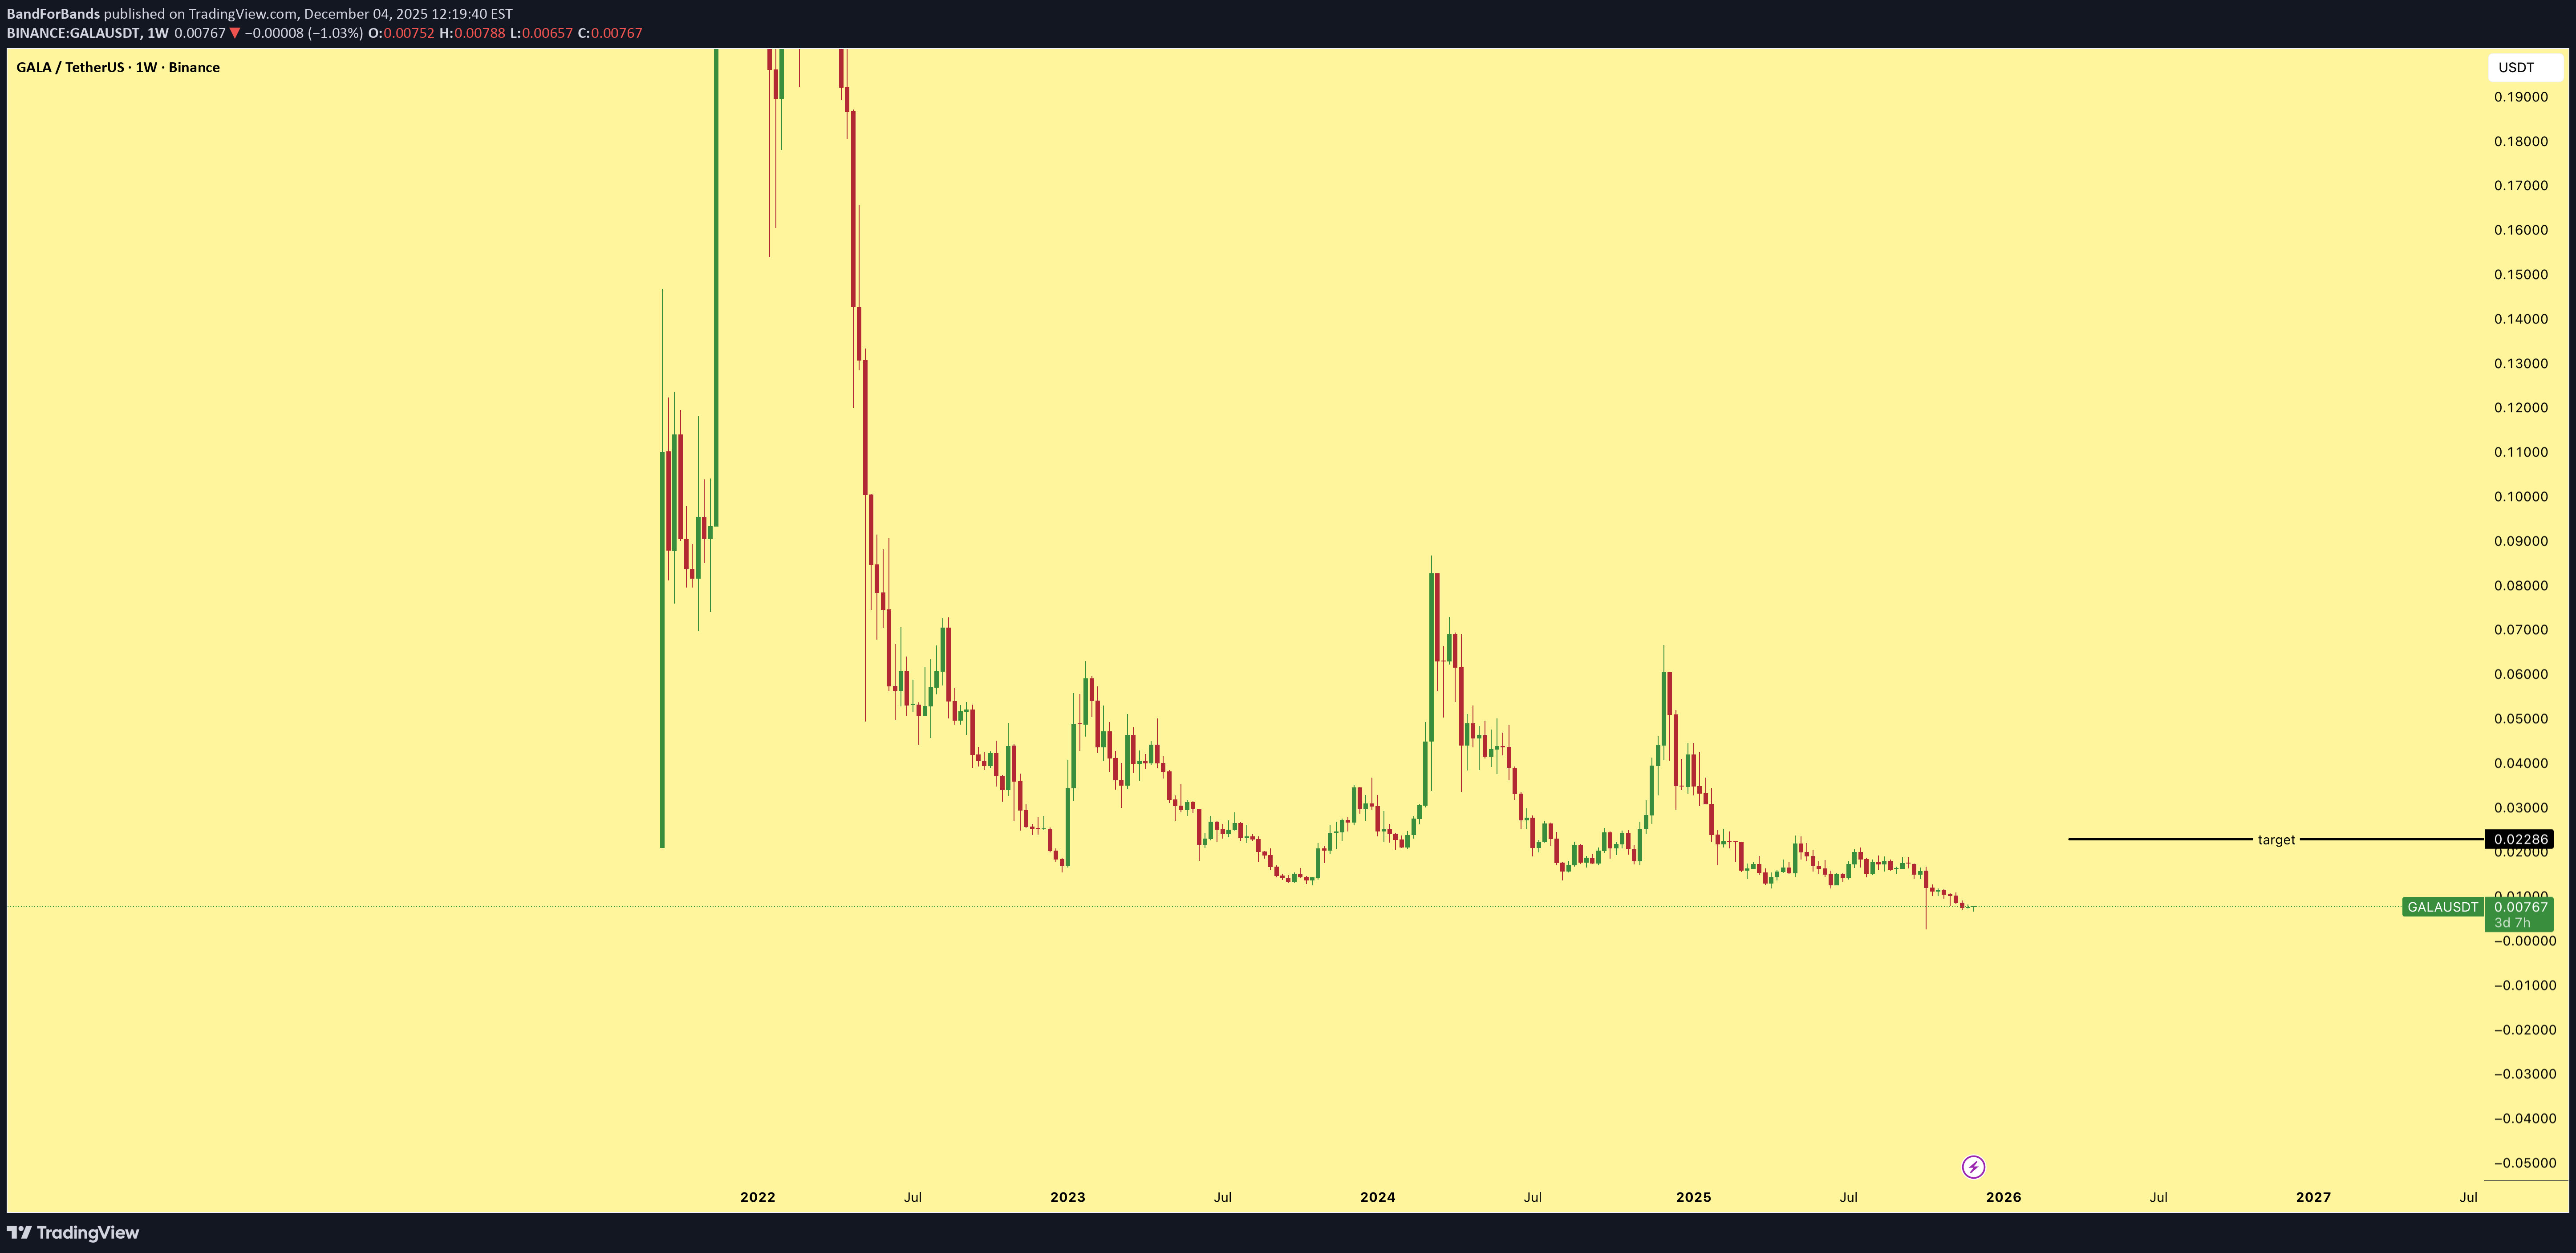
Price Chart of Gala
سود 3 Months :
خلاصه سیگنالهای Gala
سیگنالهای Gala
Filter
Sort messages by
Trader Type
Time Frame
#GALA/USDT — Holding the Last Fortres, Recovery or Final Break
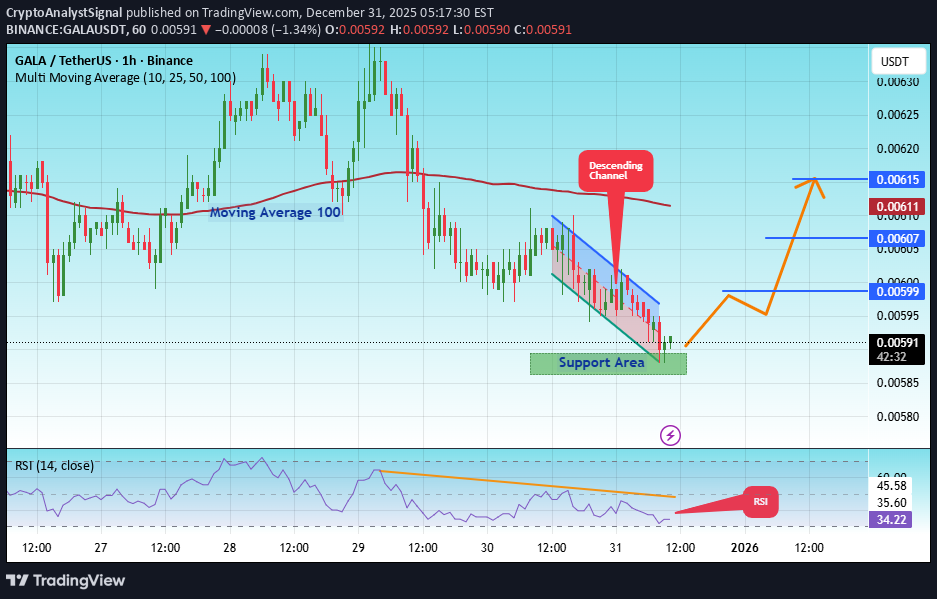
#GALA The price is moving in a descending channel on the 1-hour timeframe. It has reached the lower boundary and is heading towards breaking above it, with a retest of the upper boundary expected. We have a downtrend on the RSI indicator, which has reached near the lower boundary, and an upward rebound is expected. There is a key support zone in green at 0.00588. The price has bounced from this level multiple times and is expected to bounce again. We have a trend towards consolidation above the 100-period moving average, as we are moving close to it, which supports the upward movement. Entry price: 0.00591 First target: 0.00600 Second target: 0.00607 Third target: 0.00615 Stop loss: Below the support zone in green. Don't forget a simple thing: capital management. For inquiries, please leave a comment. Thank you.
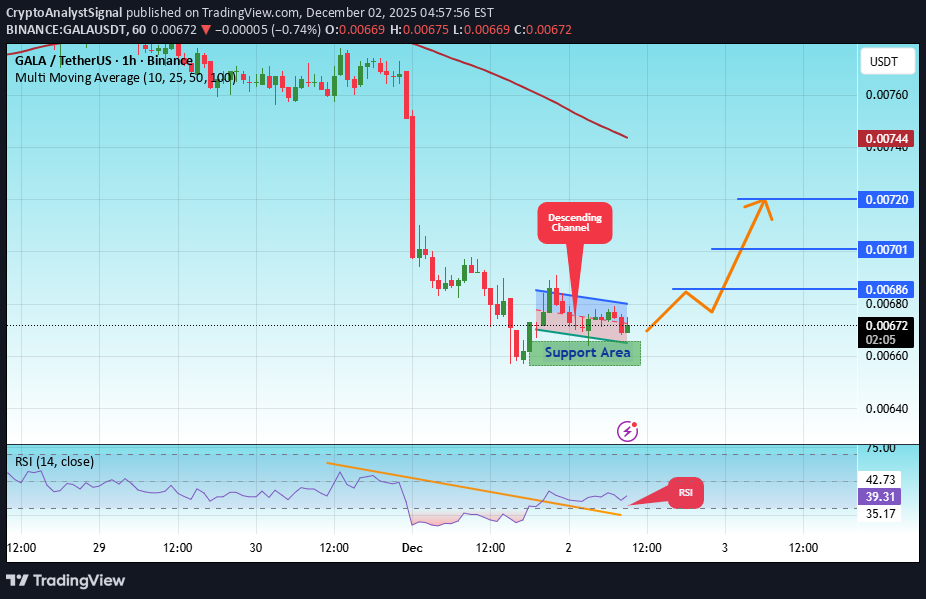
#GALA/USDT — Holding the Last Fortres, Recovery or Final Break
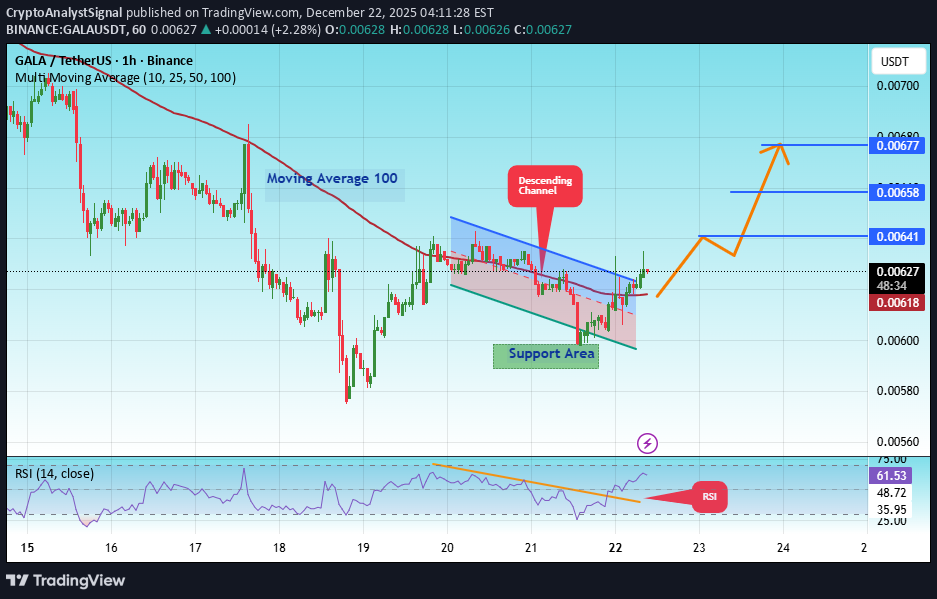
#GALA The price is moving in a descending channel on the 1-hour timeframe. It has reached the lower boundary and is heading towards breaking above it, with a retest of the upper boundary expected. We have a downtrend on the RSI indicator, which has reached near the lower boundary, and an upward rebound is expected. There is a key support zone in green at 0.00595. The price has bounced from this level multiple times and is expected to bounce again. We have a trend towards consolidation above the 100-period moving average, as we are moving close to it, which supports the upward movement. Entry price: 0.00627 First target: 0.00641 Second target: 0.00658 Third target: 0.00677 Don't forget a simple principle: money management. Place your stop-loss below the support zone in green. For any questions, please leave a comment. Thank you.
تحلیل سرنوشتساز گالا (GALA): آیا وقت خرید است یا سقوط نهایی؟
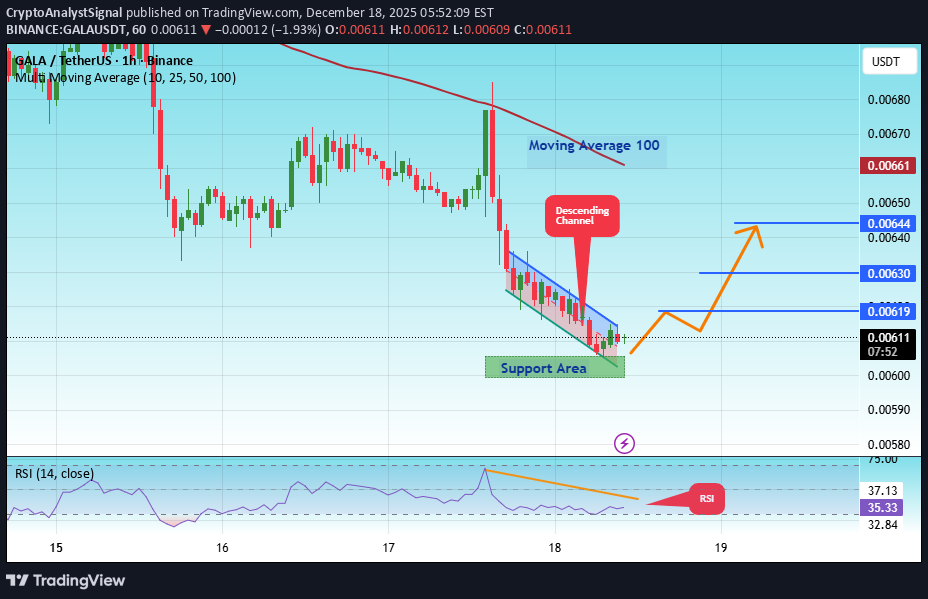
#GALA The price is moving in a descending channel on the 1-hour timeframe. It has reached the lower boundary and is heading towards breaking above it, with a retest of the upper boundary expected. We have a downtrend on the RSI indicator, which has reached near the lower boundary, and an upward rebound is expected. There is a key support zone in green at 0.00603. The price has bounced from this zone multiple times and is expected to bounce again. We have a trend towards consolidation above the 100-period moving average, as we are moving close to it, which supports the upward movement. Entry price: 0.00612 First target: 0.00619 Second target: 0.00630 Third target: 0.00644 Don't forget a simple principle: money management. Place your stop-loss below the support zone in green. For any questions, please leave a comment. Thank you.#GALA First target: 0.00619 Reached Second target: 0.00630 Reached Third target: 0.00644 Reached
GALAUSDT

The overall structure remains bearish as the price continues to form lower highs and lower lows below the descending trendline. However, compression near the 0.00670 dollar support suggests selling momentum is weakening and a short-term corrective bounce is possible if this level holds. GALAUSDT
پیشبینی صعودی گالا (GALA): نقطه حساس حمایت و اهداف جدید قیمت!
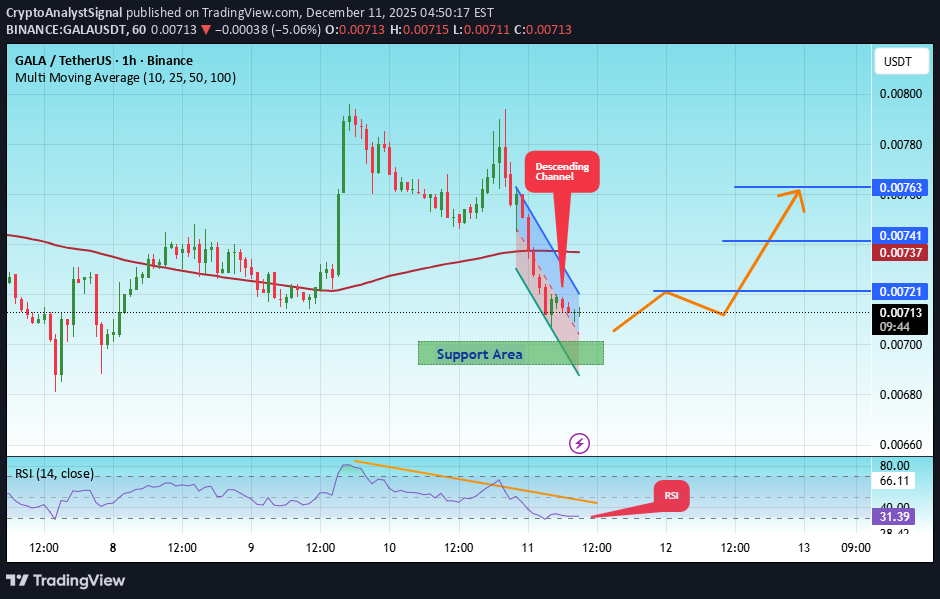
#GALA The price is moving in a descending channel on the 1-hour timeframe. It has reached the lower boundary and is heading towards breaking above it, with a retest of the upper boundary expected. We have a downtrend on the RSI indicator, which has reached near the lower boundary, and an upward rebound is expected. There is a key support zone in green at 0.00700. The price has bounced from this zone multiple times and is expected to bounce again. We have a trend towards stability above the 100-period moving average, as we are moving close to it, which supports the upward movement. Entry price: 0.00714 First target: 0.00721 Second target: 0.00741 Third target: 0.00763 Don't forget a simple principle: money management. Place your stop-loss below the support zone in green. For any questions, please leave a comment. Thank you.#GALA First target: 0.00721 Reached Second target: 0.00741 Reached

آلت کوین GALA آماده انفجار است: پیشبینی رشد 200 درصدی در کوتاهمدت!

چرا گالا (GALA) صعودی است؟ پیشبینی جسورانه و نکات ضروری قبل از ورود!

Gala looking bullish this is a risk trade do your own research before entry
گالا در مسیر صعودی؛ آیا اکنون زمان ورود به این ریسک جذاب است؟
gala looking bullish this is a risk trade do your own research before entry
تحلیل و پیشبینی قیمت گالا (GALA/USDT): آیا زمان صعود فرا رسیده است؟
#GALA The price is moving in a descending channel on the 1-hour timeframe. It has reached the lower boundary and is heading towards breaking above it, with a retest of the upper boundary expected. We have a downtrend on the RSI indicator, which has reached near the lower boundary, and an upward rebound is expected. There is a key support zone in green at 0.00916. The price has bounced from this level multiple times and is expected to bounce again. We have a trend towards consolidation above the 100-period moving average, as we are moving close to it, which supports the upward movement. Entry price: 0.00933 First target: 0.00947 Second target: 0.00971 Third target: 0.01005 Don't forget a simple principle: money management. Place your stop-loss below the support zone in green. For any questions, please leave a comment. Thank you.#GALA First target: 0.00947 Reached Second target: 0.00971 Reached Third target: 0.01005 Reached
تحلیل تکنیکال گالا (GALA/USDT): سیگنال صعودی قوی از کف کانال نزولی!
#GALA The price is moving in a descending channel on the 1-hour timeframe. It has reached the lower boundary and is heading towards breaking above it, with a retest of the upper boundary expected. We have a downtrend on the RSI indicator, which has reached near the lower boundary, and an upward rebound is expected. There is a key support zone in green at 0.00916. The price has bounced from this level multiple times and is expected to bounce again. We have a trend towards consolidation above the 100-period moving average, as we are moving close to it, which supports the upward movement. Entry price: 0.00933 First target: 0.00947 Second target: 0.00971 Third target: 0.01005 Don't forget a simple principle: money management. Place your stop-loss below the support zone in green. For any questions, please leave a comment. Thank you.
Disclaimer
Any content and materials included in Sahmeto's website and official communication channels are a compilation of personal opinions and analyses and are not binding. They do not constitute any recommendation for buying, selling, entering or exiting the stock market and cryptocurrency market. Also, all news and analyses included in the website and channels are merely republished information from official and unofficial domestic and foreign sources, and it is obvious that users of the said content are responsible for following up and ensuring the authenticity and accuracy of the materials. Therefore, while disclaiming responsibility, it is declared that the responsibility for any decision-making, action, and potential profit and loss in the capital market and cryptocurrency market lies with the trader.