
FLM
Flamingo
| تریدر | نوع سیگنال | حد سود/ضرر | زمان انتشار | مشاهده پیام |
|---|---|---|---|---|
No results found. | ||||
Price Chart of Flamingo
سود 3 Months :
سیگنالهای Flamingo
Filter
Sort messages by
Trader Type
Time Frame

FortuneAI
منطقه تقاضای قوی FLM: آیا غول غیرمنتظره بیدار میشود؟ (آماده برای صعود بزرگ!)
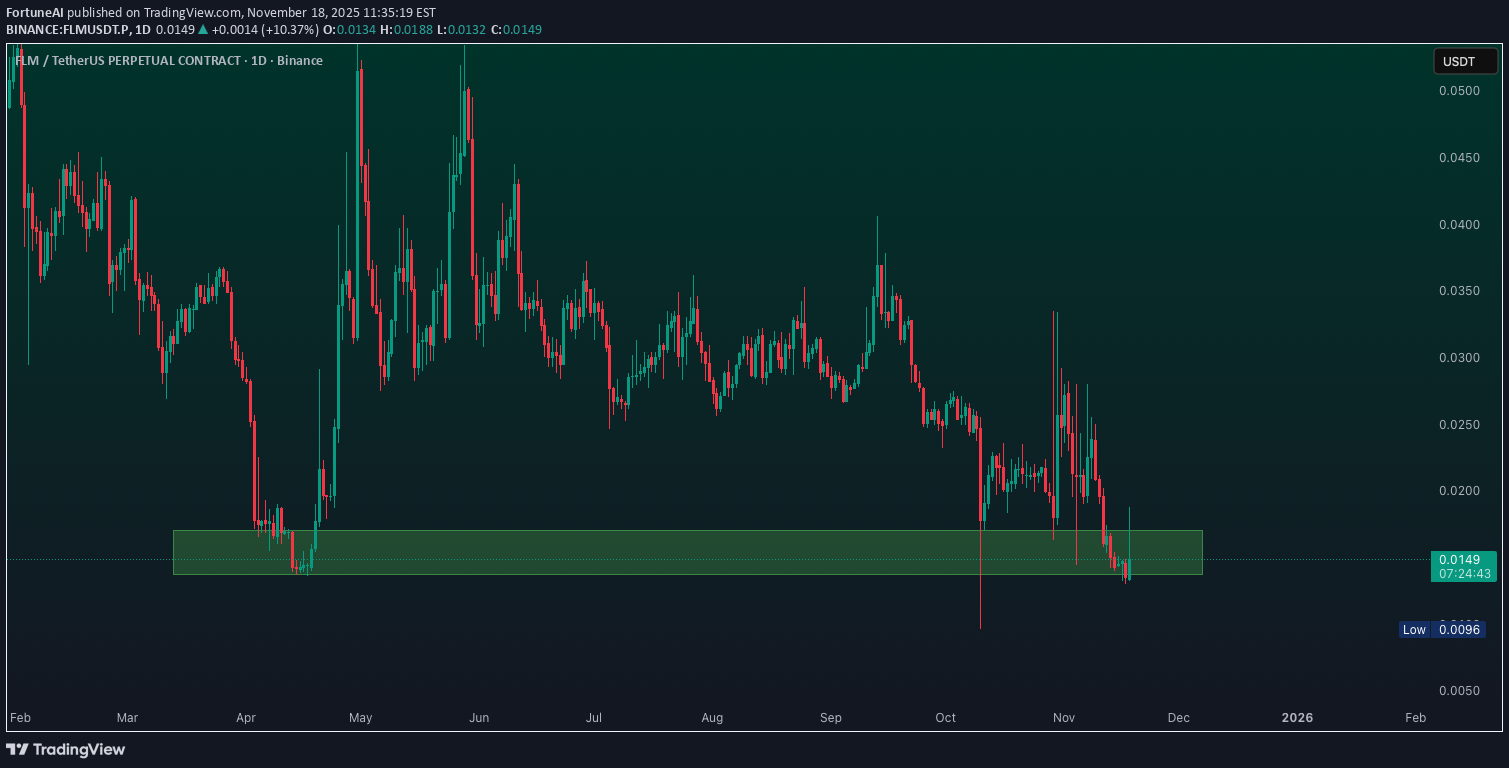
FLM Currently sitting in strong liquidity demand zone on daily timeframe and its technicals also look bullish for massive reversal. keep an eye on it and use proper risk management

BandForBands
رشد انفجاری FLM: شکست خط مقاومت، پتانسیل سود ۱۵۰ درصدی!
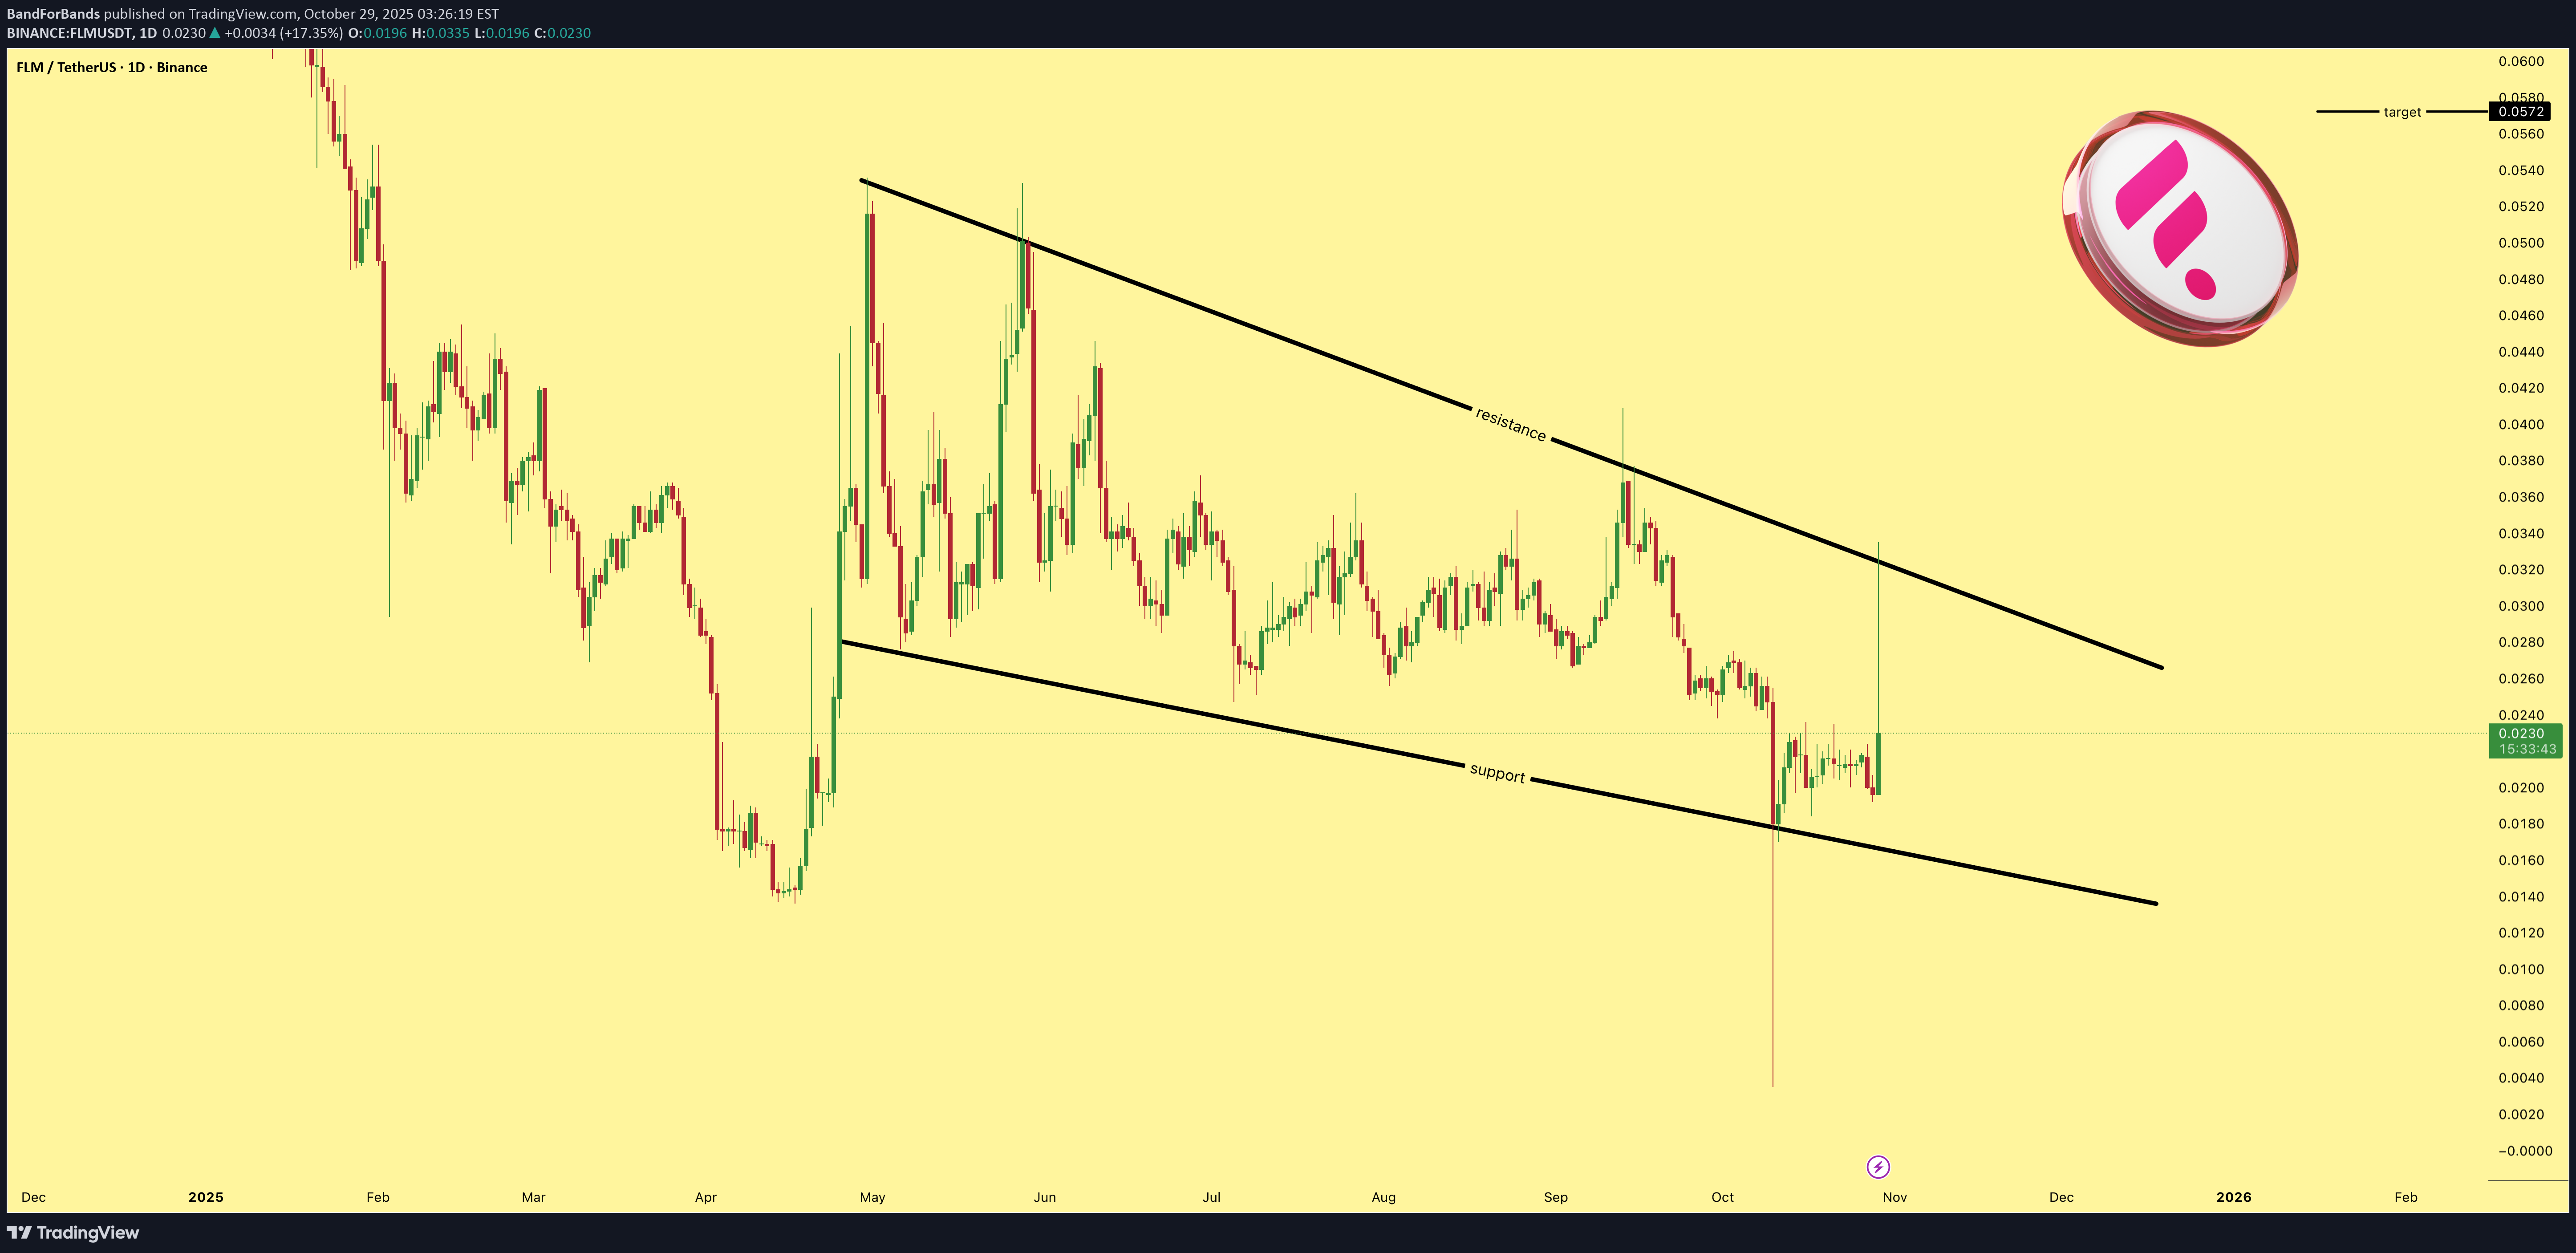
FLM is showing increasing volume and testing the upper boundary of its descending wedge pattern. A confirmed breakout could trigger a strong move, with potential gains of up to 150% from current levels if momentum and market conditions remain supportive.

SevenStarBuySell
تحلیل فوری: فرصت کوتاه و پرنوسان در بازار (با اهرم کم!)
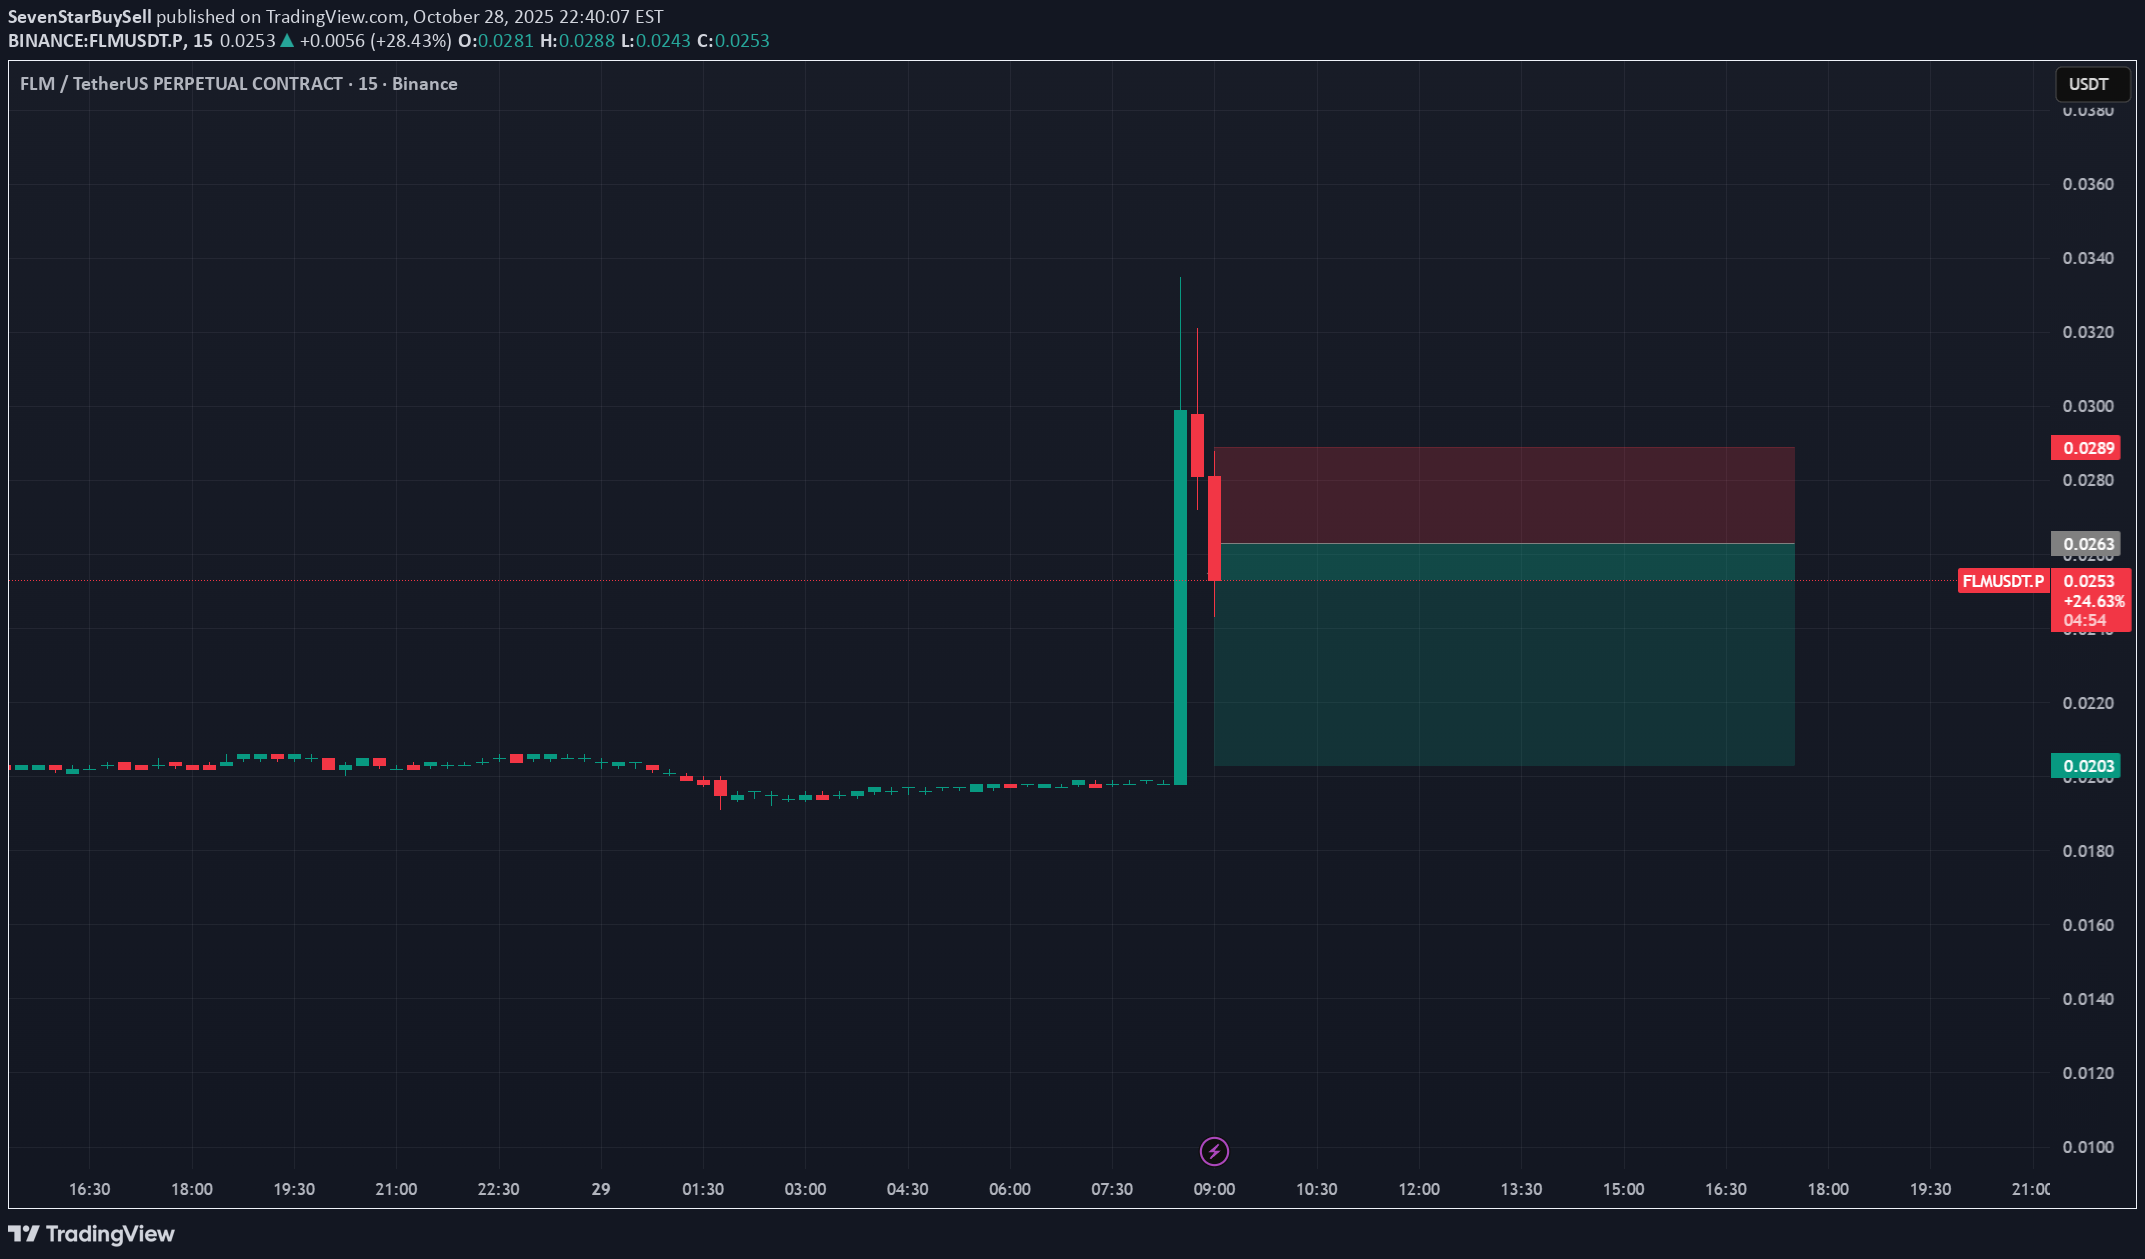
We have a short print in FLM let's see how it plays out. As the asset is highly volatile. use small leverage. Targets on charts For indicator access you can contact me.Came down like water. That's 7-star. For indicator access you can contact me.That's 7-star

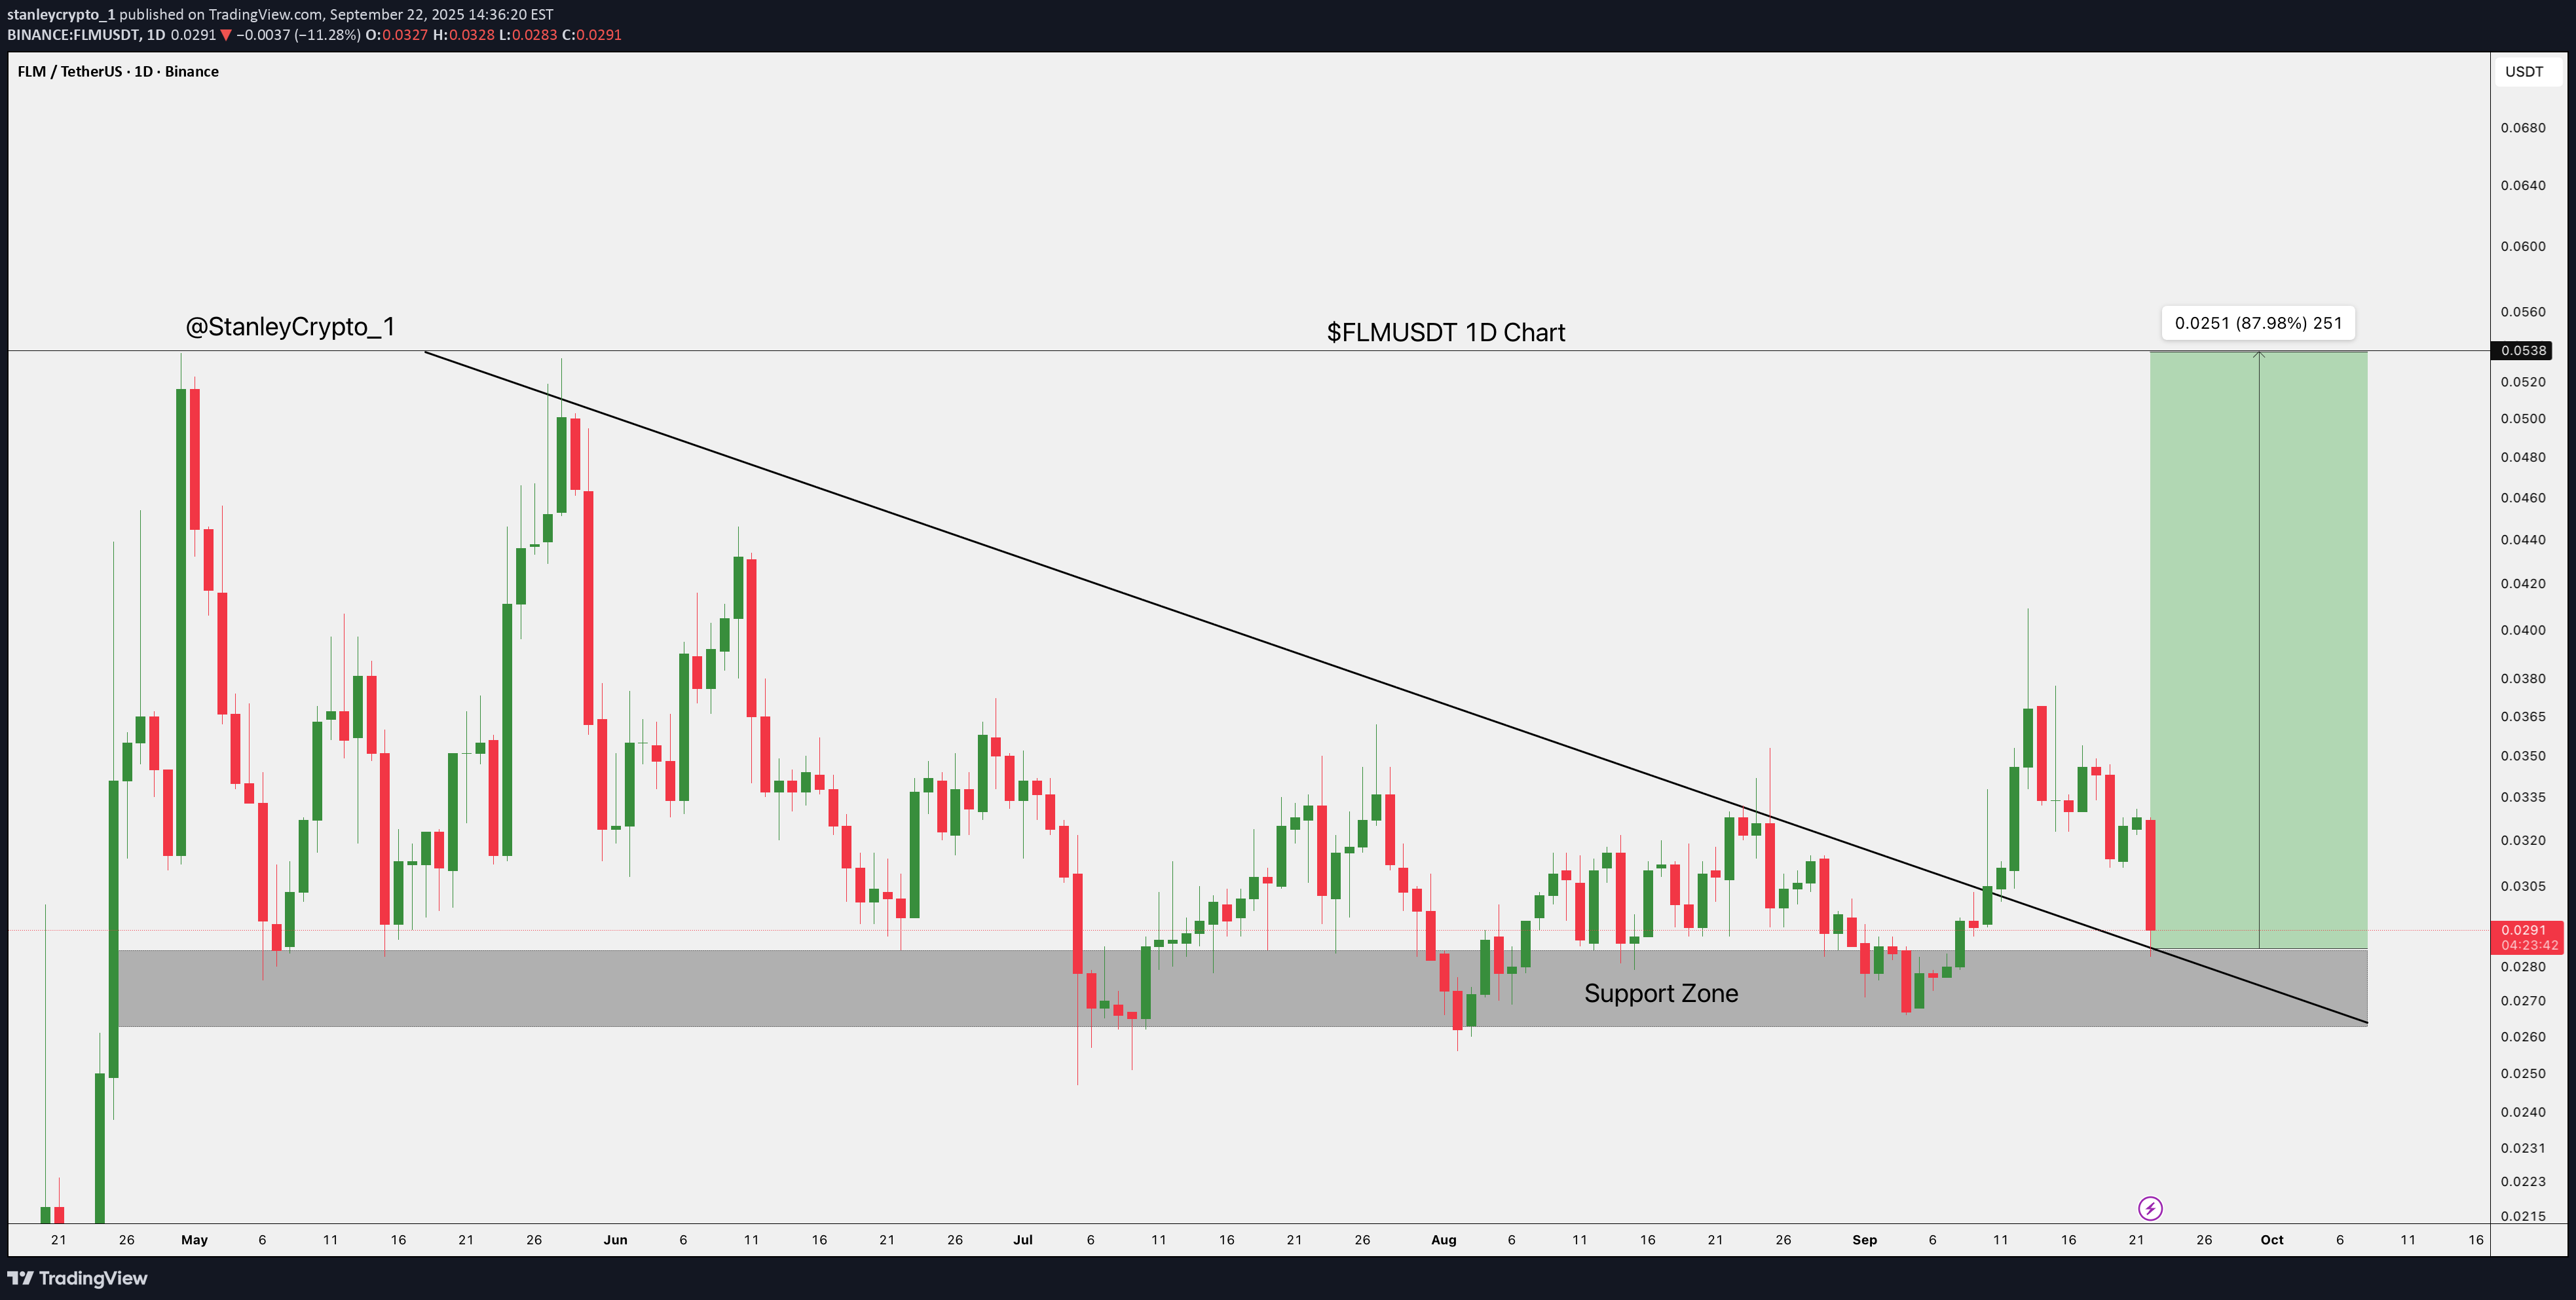
stanleycrypto_1

Ren_MomentumTrader
FLM/USDT
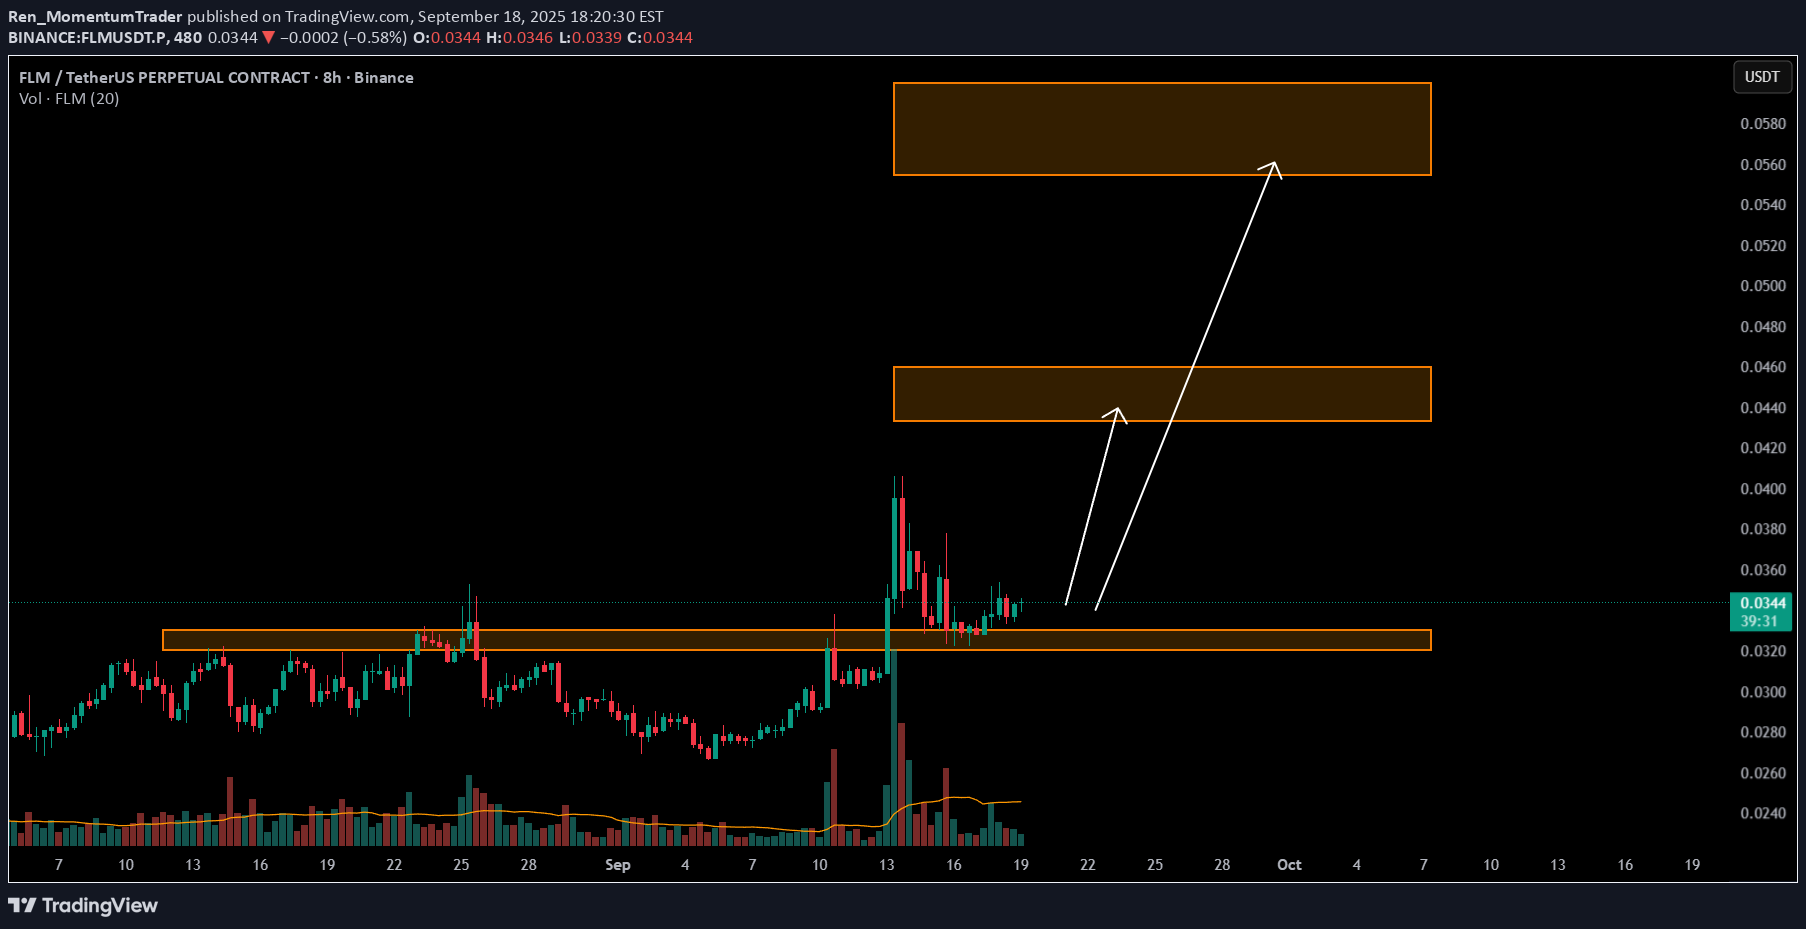
Key Level Zone: 0.0320 - 0.0330 LMT v2.0 detected. The setup looks promising—price previously trended upward with rising volume and momentum, then retested this zone cleanly. This presents an excellent reward-to-risk opportunity if momentum continues to align. Introducing LMT (Levels & Momentum Trading) - Over the past 3 years, I’ve refined my approach to focus more sharply on the single most important element in any trade: the KEY LEVEL. - While HMT (High Momentum Trading) served me well—combining trend, momentum, volume, and structure across multiple timeframes—I realized that consistently identifying and respecting these critical price zones is what truly separates good trades from great ones. - That insight led to the evolution of HMT into LMT – Levels & Momentum Trading. Why the Change? (From HMT to LMT) Switching from High Momentum Trading (HMT) to Levels & Momentum Trading (LMT) improves precision, risk control, and confidence by: - Clearer Entries & Stops: Defined key levels make it easier to plan entries, stop-losses, and position sizing—no more guesswork. - Better Signal Quality: Momentum is now always checked against a support or resistance zone—if it aligns, it's a stronger setup. - Improved Reward-to-Risk: All trades are anchored to key levels, making it easier to calculate and manage risk effectively. - Stronger Confidence: With clear invalidation points beyond key levels, it's easier to trust the plan and stay disciplined—even in tough markets. Whenever I share a signal, it’s because: - A high‐probability key level has been identified on a higher timeframe. - Lower‐timeframe momentum, market structure and volume suggest continuation or reversal is imminent. - The reward‐to‐risk (based on that key level) meets my criteria for a disciplined entry. ***Please note that conducting a comprehensive analysis on a single timeframe chart can be quite challenging and sometimes confusing. I appreciate your understanding of the effort involved. Important Note: The Role of Key Levels - Holding a key level zone: If price respects the key level zone, momentum often carries the trend in the expected direction. That’s when we look to enter, with stop-loss placed just beyond the zone with some buffer. - Breaking a key level zone: A definitive break signals a potential stop‐out for trend traders. For reversal traders, it’s a cue to consider switching direction—price often retests broken zones as new support or resistance. My Trading Rules (Unchanged) Risk Management - Maximum risk per trade: 2.5% - Leverage: 5x Exit Strategy / Profit Taking - Sell at least 70% on the 3rd wave up (LTF Wave 5). - Typically sell 50% during a high‐volume spike. - Move stop‐loss to breakeven once the trade achieves a 1.5:1 R:R. - Exit at breakeven if momentum fades or divergence appears. The market is highly dynamic and constantly changing. LMT signals and target profit (TP) levels are based on the current price and movement, but market conditions can shift instantly, so it is crucial to remain adaptable and follow the market's movement. If you find this signal/analysis meaningful, kindly like and share it. Thank you for your support~ Sharing this with love! From HMT to LMT: A Brief Version History HM Signal : Date: 17/08/2023 - Early concept identifying high momentum pullbacks within strong uptrends - Triggered after a prior wave up with rising volume and momentum - Focused on healthy retracements into support for optimal reward-to-risk setups HMT v1.0: Date: 18/10/2024 - Initial release of the High Momentum Trading framework - Combined multi-timeframe trend, volume, and momentum analysis. - Focused on identifying strong trending moves high momentum HMT v2.0: Date: 17/12/2024 - Major update to the Momentum indicator - Reduced false signals from inaccurate momentum detection - New screener with improved accuracy and fewer signals HMT v3.0: Date: 23/12/2024 - Added liquidity factor to enhance trend continuation - Improved potential for momentum-based plays - Increased winning probability by reducing entries during peaks HMT v3.1: Date: 31/12/2024 - Enhanced entry confirmation for improved reward-to-risk ratios HMT v4.0: Date: 05/01/2025 - Incorporated buying and selling pressure in lower timeframes to enhance the probability of trending moves while optimizing entry timing and scaling HMT v4.1: Date: 06/01/2025 - Enhanced take-profit (TP) target by incorporating market structure analysis HMT v5 : Date: 23/01/2025 - Refined wave analysis for trending conditions - Incorporated lower timeframe (LTF) momentum to strengthen trend reliability - Re-aligned and re-balanced entry conditions for improved accuracy HMT v6 : Date : 15/02/2025 - Integrated strong accumulation activity into in-depth wave analysis HMT v7 : Date : 20/03/2025 - Refined wave analysis along with accumulation and market sentiment HMT v8 : Date : 16/04/2025 - Fully restructured strategy logic HMT v8.1 : Date : 18/04/2025 - Refined Take Profit (TP) logic to be more conservative for improved win consistency LMT v1.0 : Date : 06/06/2025 - Rebranded to emphasize key levels + momentum as the core framework LMT v2.0 Date: 11/06/2025 - Fully restructured lower timeframe (LTF) momentum logic

CryptoWithJames
FLMUSDT UPDATE
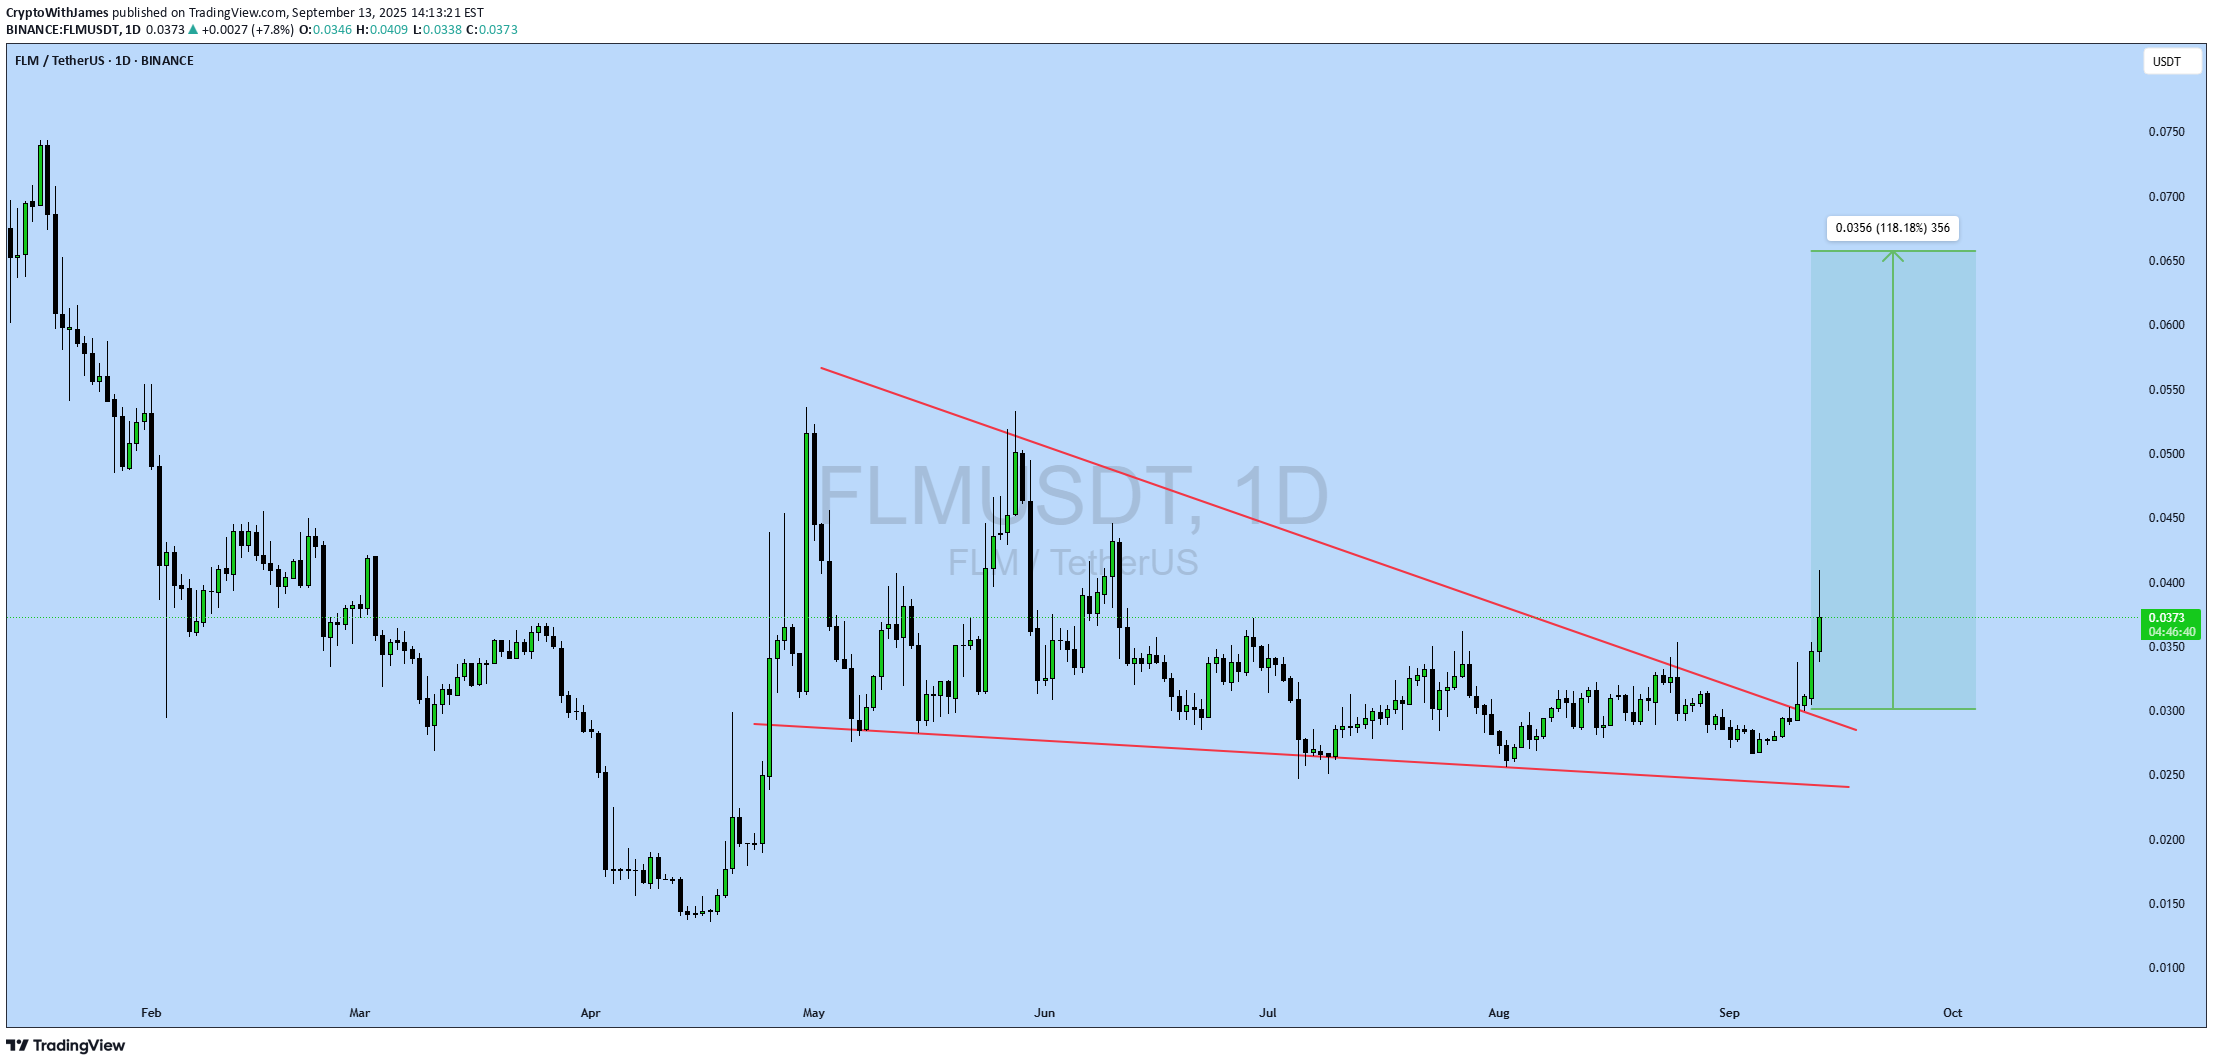
#FLM UPDATE FLM Technical Setup Pattern : Bullish Falling Wedge Pattern Current Price: $0.0374 Target Price: $0.0730 Target % Gain: 118.18% Technical Analysis: FLM has broken out of a bullish falling wedge on the daily timeframe with strong bullish momentum. A confirmed breakout above $0.035 signals upside continuation toward $0.073, supported by volume expansion and structure breakout. Time Frame: 1D Risk Management Tip: Always use proper risk management.

Alpha-GoldFX
FLMUSDT Forming Bullish Move
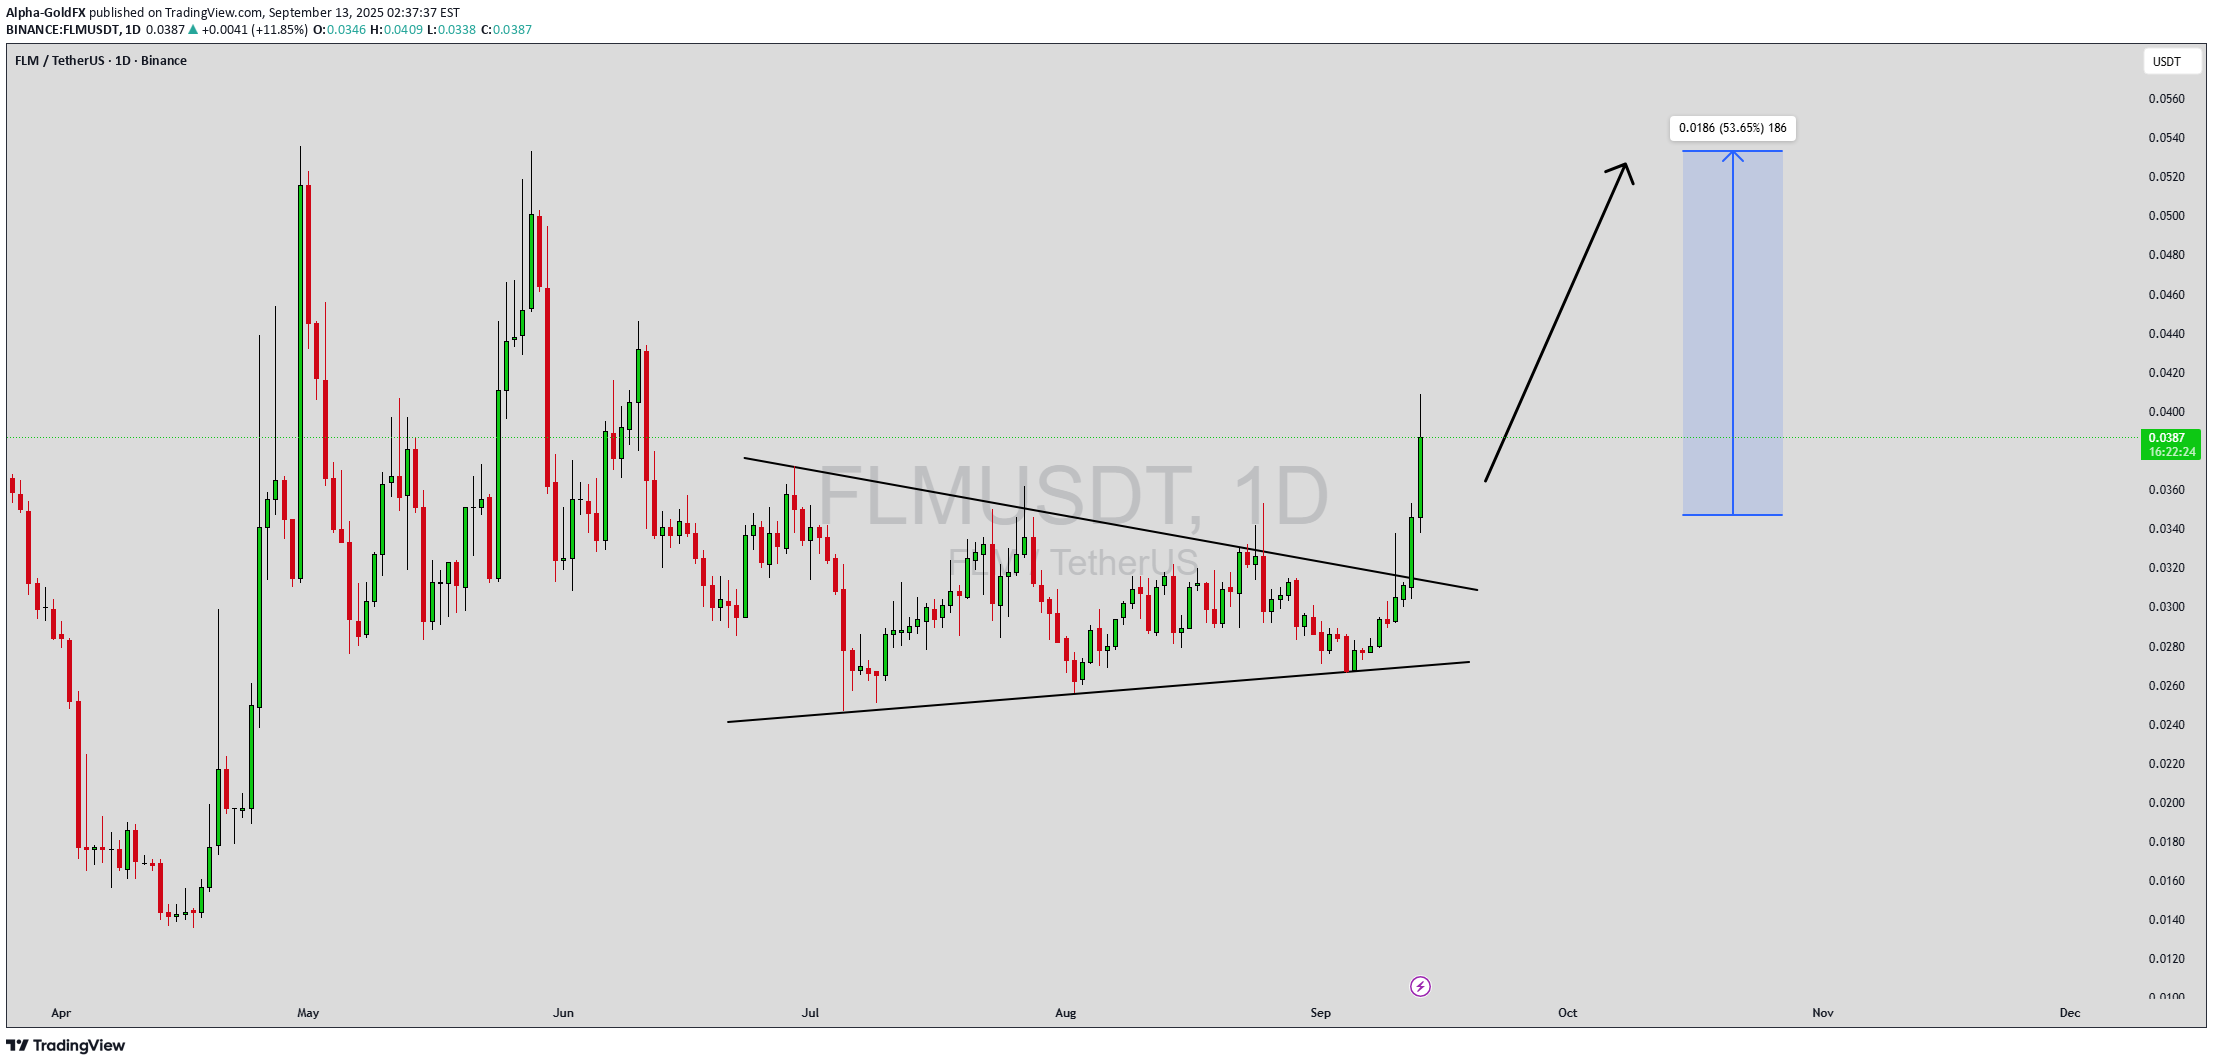
FLMUSDT is showing signs of strength with a bullish move pattern forming on the chart. The consistent trading volume indicates strong participation from investors, which often serves as a key driver for sustainable price growth. This accumulation phase suggests that buyers are preparing for a potential breakout that could carry momentum into higher levels. The current market behavior highlights investor confidence in the project, as the price structure aligns with bullish continuation signals. Once the resistance zones are cleared, FLMUSDT could see a significant upside move supported by volume and positive sentiment. With an expected gain of 40% to 50%+, this setup provides an attractive risk-to-reward ratio for traders and investors alike. The growing interest around this pair strengthens the outlook, making it one to watch closely for the next breakout opportunity. ✅ Show your support by hitting the like button and ✅ Leaving a comment below! (What is You opinion about this Coin) Your feedback and engagement keep me inspired to share more insightful market analysis with you!

SheikhNaveed
FLM/USDT 4H Technical Outlook
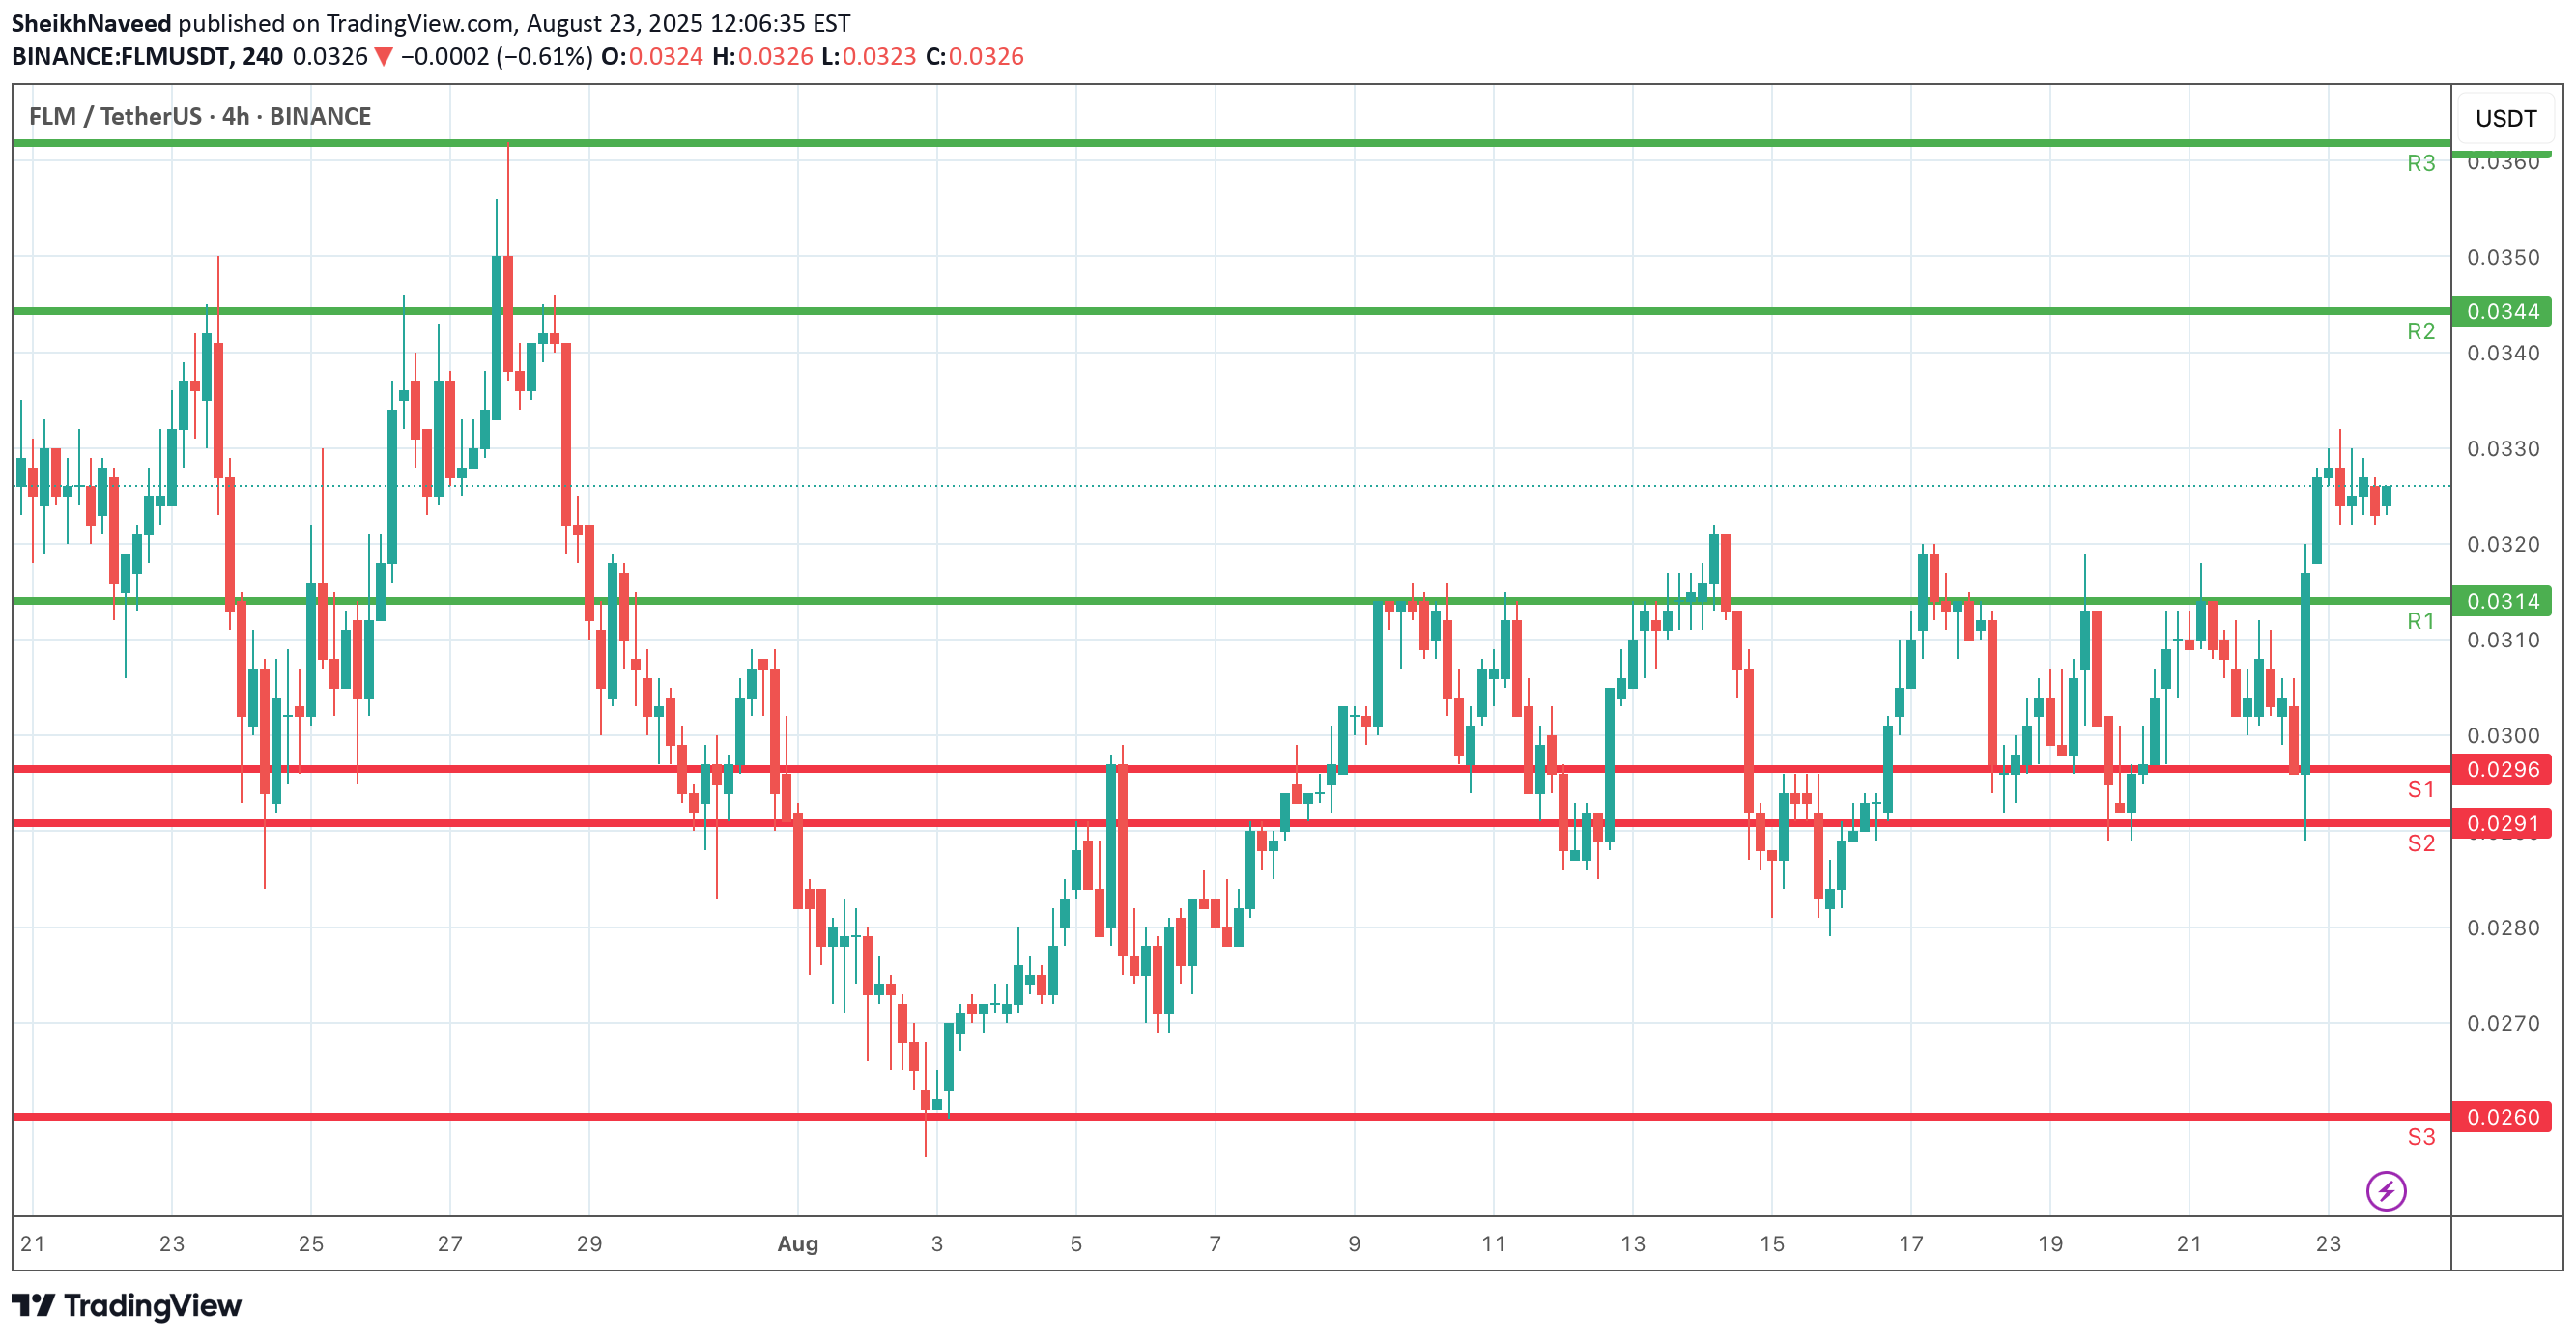
FLM is consolidating after reclaiming key support zones. On the downside, S1 (0.0296) and S2 (0.0291) are the immediate supports. A deeper correction could extend toward S3 (0.0260) if bearish momentum accelerates. On the upside, R1 (0.0314) is the first resistance to watch. A confirmed breakout above it strengthens the case for a move toward R2 (0.0344), with further upside potential to R3 (0.0360) if momentum continues. Currently, price action is holding above R1, suggesting buyers are attempting to build bullish continuation. However, a drop back below S1 could weaken the short-term outlook.

MastaCrypta
Mlem mlem - FLM USDT
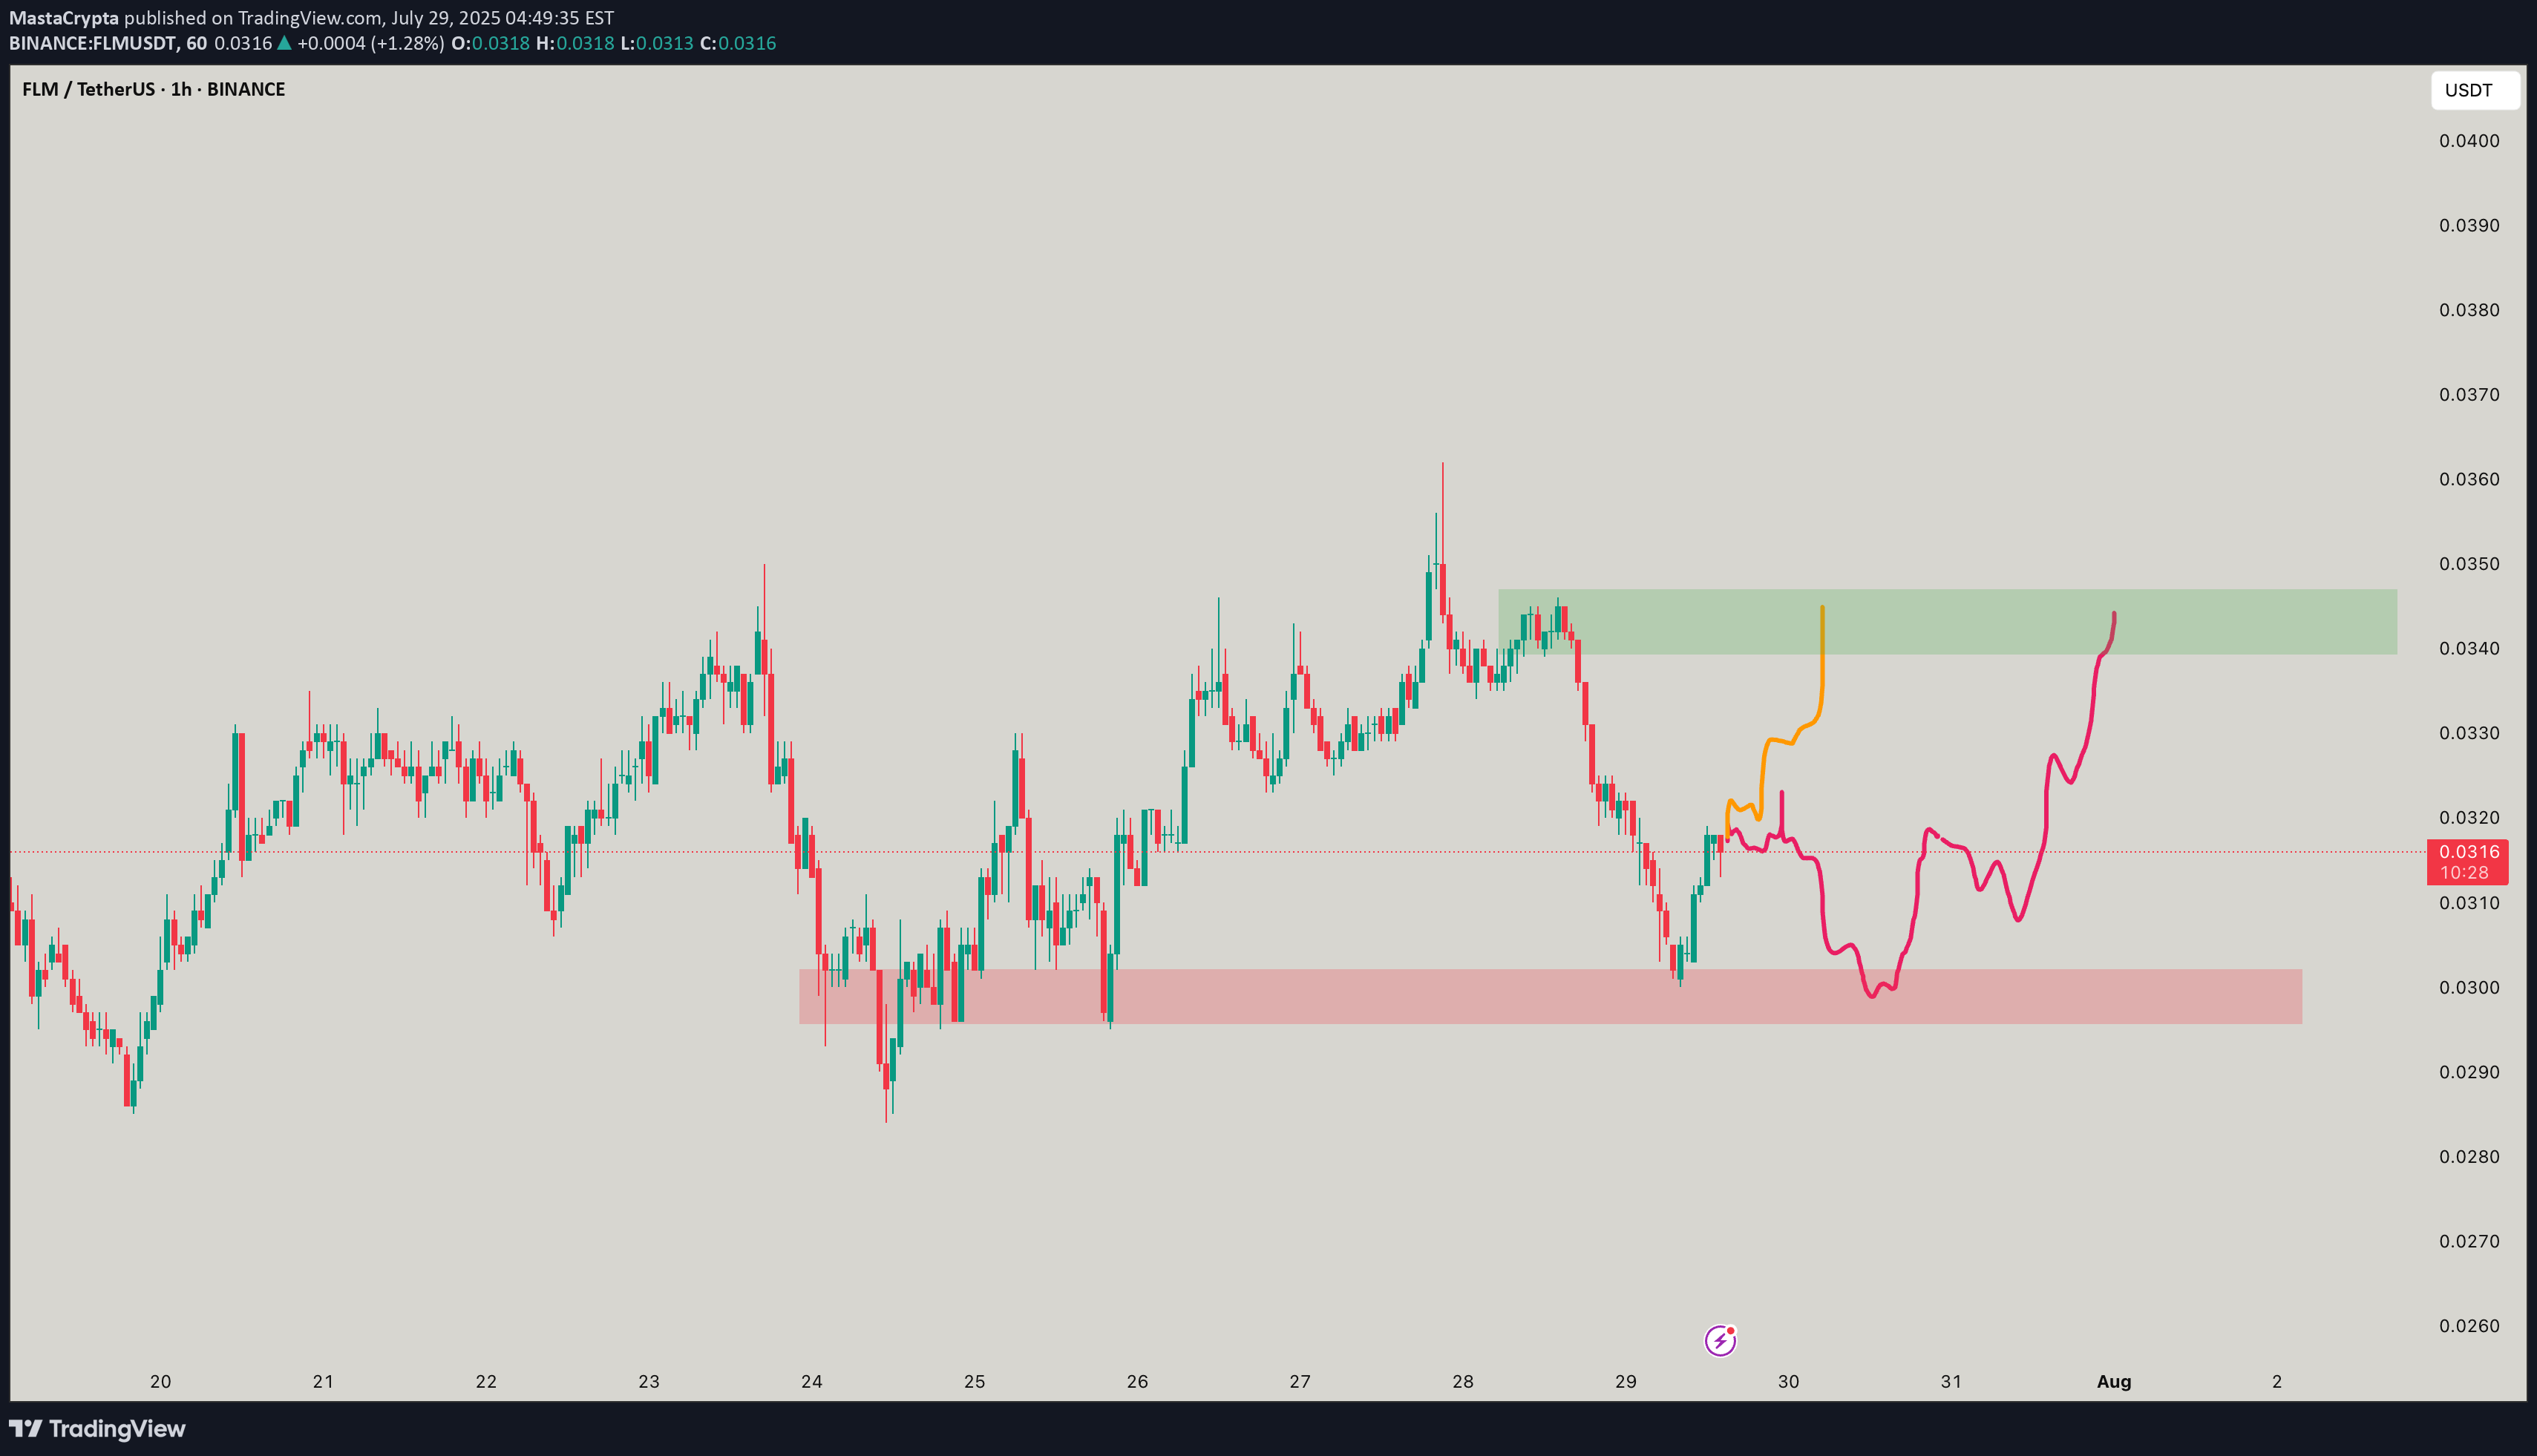
FLMUSDT if luck is lucly then u see orange or if not so lucky so the red ones happen!

CryptoAnalystSignal
#FLM/USDT – Bullish Reversal Opportunity | 1H Chart

#FLMThe price is moving within a descending channel on the 1-hour frame, adhering well to it, and is on its way to breaking it strongly upwards and retesting it.We have a bounce from the lower boundary of the descending channel. This support is at 0.0257.We have a downtrend on the RSI indicator that is about to break and retest, supporting the upside.There is a major support area in green at 0.0248, which represents a strong basis for the upside.Don't forget a simple thing: ease and capital.When you reach the first target, save some money and then change your stop-loss order to an entry order.For inquiries, please leave a comment.We have a trend to hold above the 100 Moving Average.Entry price: 0.0257.First target: 0.0270.Second target: 0.0285.Third target: 0.0301.Don't forget a simple thing: ease and capital.When you reach the first target, save some money and then change your stop-loss order to an entry order.For inquiries, please leave a comment.Thank you.
Disclaimer
Any content and materials included in Sahmeto's website and official communication channels are a compilation of personal opinions and analyses and are not binding. They do not constitute any recommendation for buying, selling, entering or exiting the stock market and cryptocurrency market. Also, all news and analyses included in the website and channels are merely republished information from official and unofficial domestic and foreign sources, and it is obvious that users of the said content are responsible for following up and ensuring the authenticity and accuracy of the materials. Therefore, while disclaiming responsibility, it is declared that the responsibility for any decision-making, action, and potential profit and loss in the capital market and cryptocurrency market lies with the trader.