
ETHFI
ether.fi
| تریدر | نوع سیگنال | حد سود/ضرر | زمان انتشار | مشاهده پیام |
|---|---|---|---|---|
 asilturkRank: 31971 | خرید | حد سود: تعیین نشده حد ضرر: تعیین نشده | 12/10/2025 | |
 Richtv_officialRank: 29646 | خرید | حد سود: تعیین نشده حد ضرر: تعیین نشده | 11/4/2025 |
Price Chart of ether.fi
سود 3 Months :
سیگنالهای ether.fi
Filter
Sort messages by
Trader Type
Time Frame

Bithereum_io
تحلیل هیجانانگیز ETHFI: آیا خیز بزرگ به سوی ۱.۴ دلار آغاز میشود؟
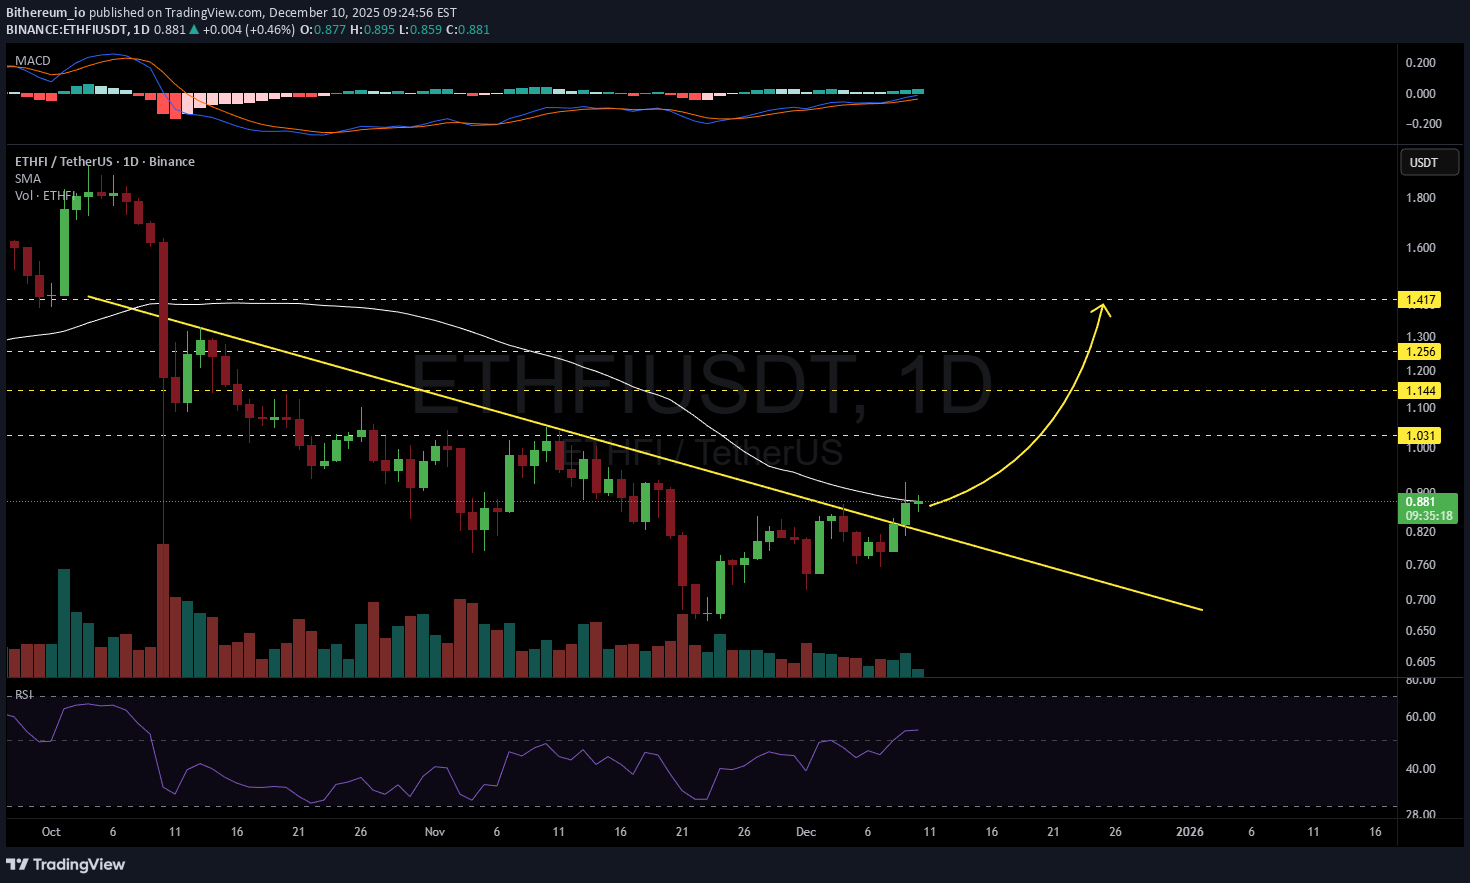
#ETHFI has broken above the descending resistance on the daily chart and is currently facing the SMA50. Keep a close eye on it. In case of a breakout above the SMA50, the potential targets are: 🎯 $1.031 🎯 $1.144 🎯 $1.256 🎯 $1.417 ⚠️ Always remember to use a tight stop-loss and maintain proper risk management.
asilturk
ETHFI: آیا این توکن استیکینگ اتریوم شما را به سودهای بزرگ میرساند؟ (تحلیل و پیشبینی)
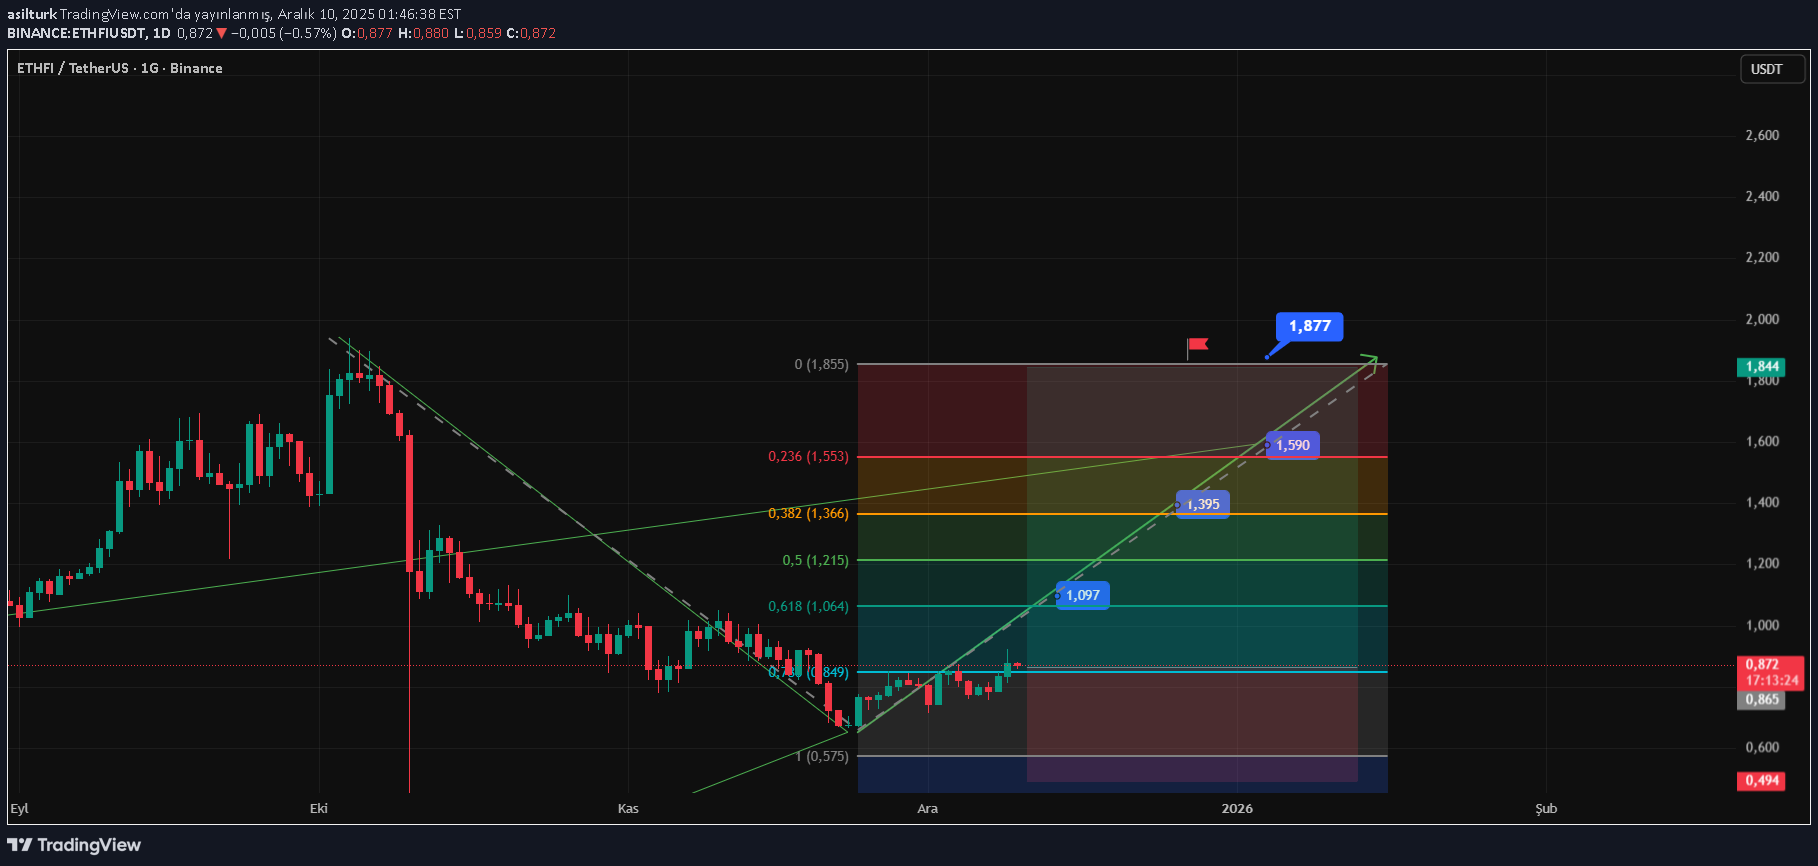
ETHFI is the governance token of the Ether.fi protocol, which aims to maximize Ethereum's core staking efficiency by combining it with "restaking", a next-generation technology. It offers users higher efficiency and flexibility. As of now, its price is $0.87 and it has a trading volume of $35 Million. When we look at it technically, ETHFI looks good in terms of volume, among the coins that show gradual increases due to the correction in the market. As a continuation of the weekly rising trend, it will test above $1 in the coming days, and if it remains above $1, the sequential targets specified in the chart can be followed. I wish you good luck.

tradecitypro
تحلیل ETHFI: آلتکوینهای دیفای در آستانه انفجار!
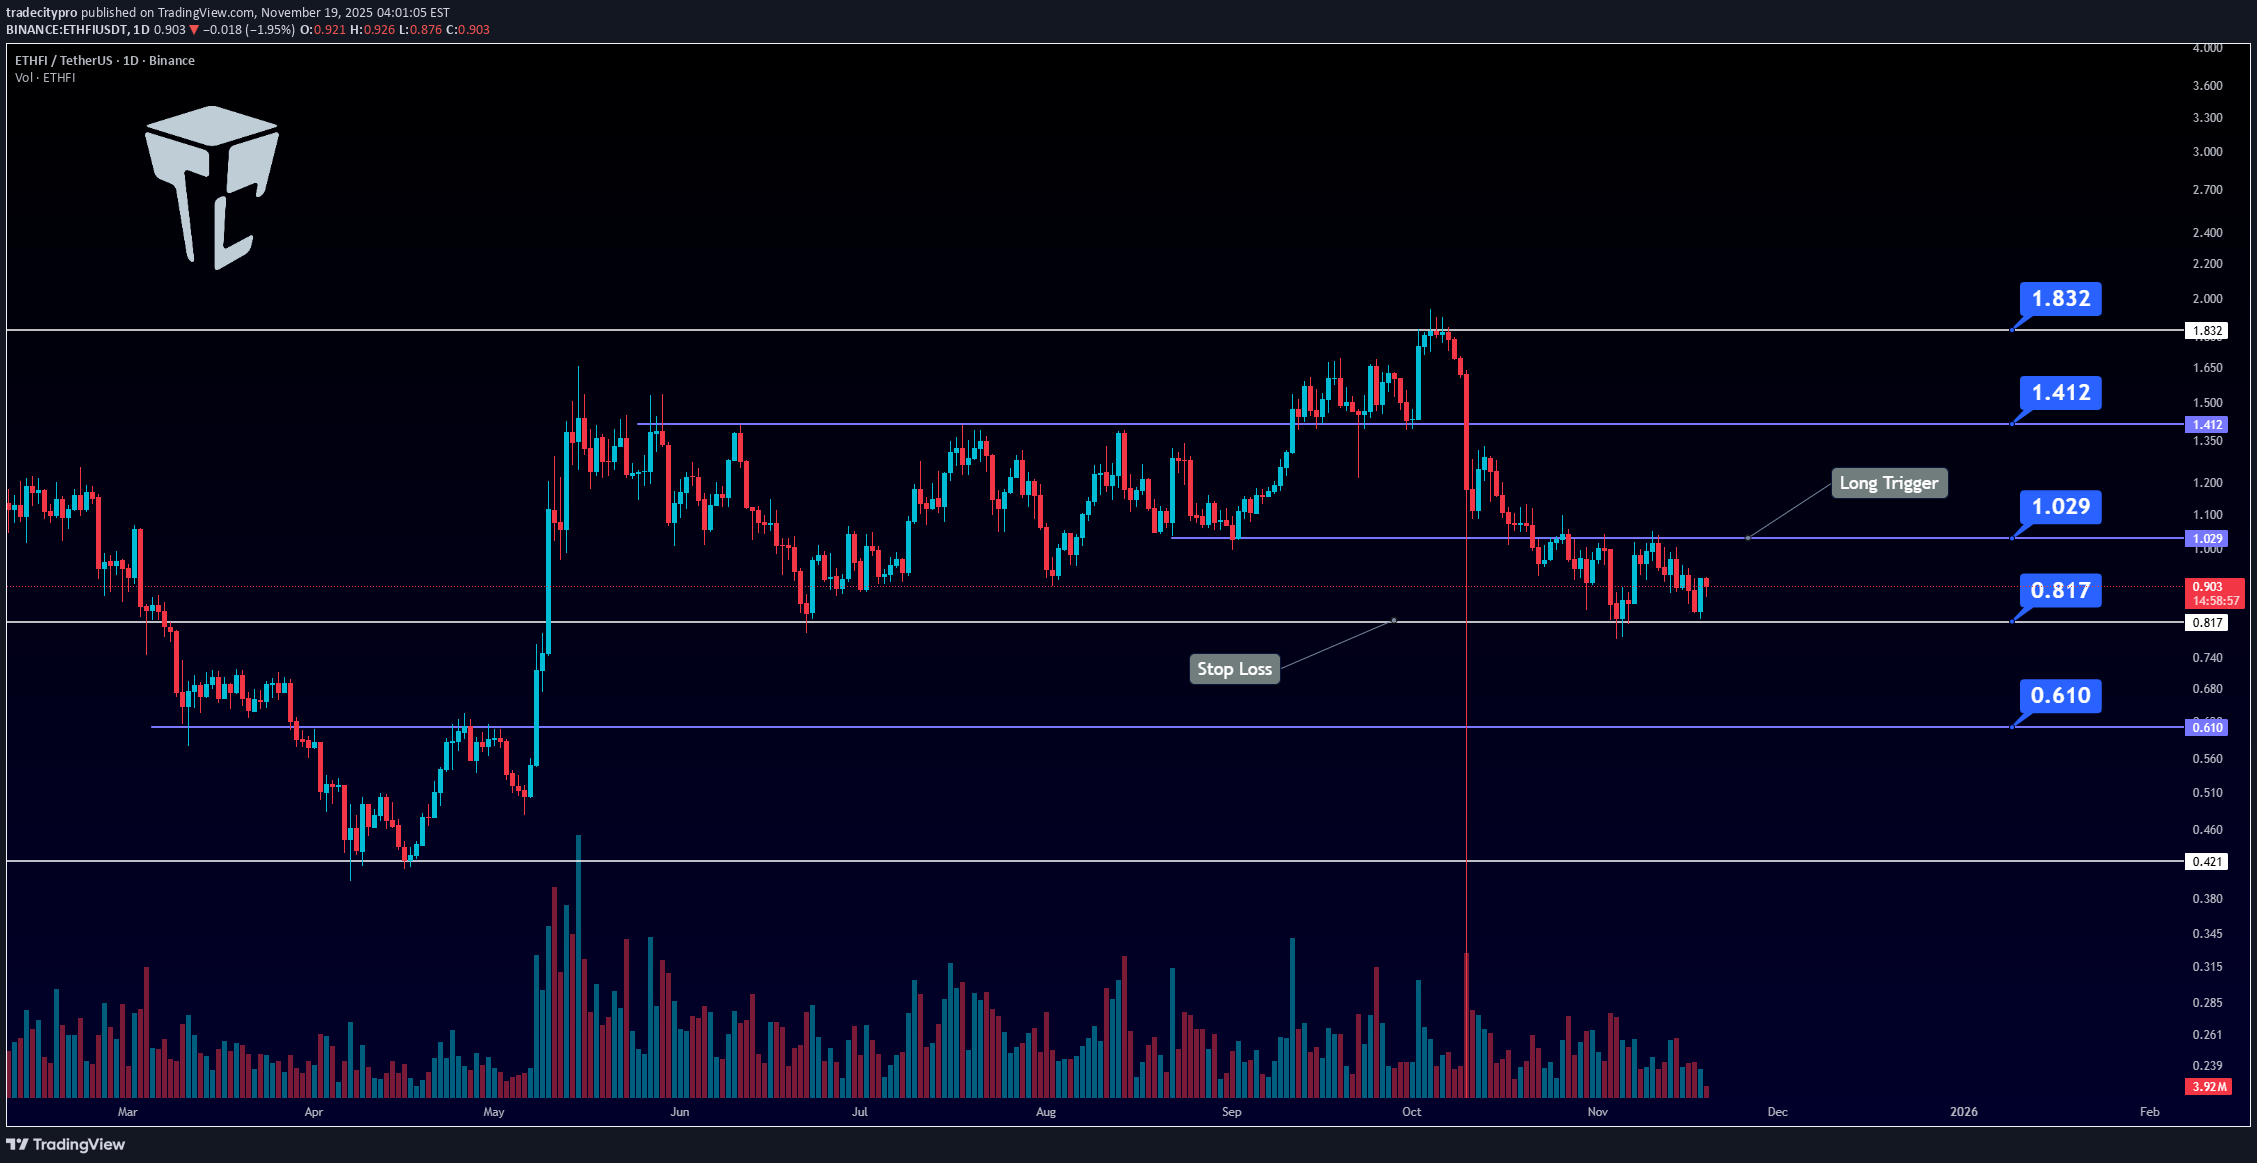
👋 Welcome to TradeCityPro! Let's move on to ethfi analysis, which is a popular DeFi coin, and with the movement of this coin, DeFi altcoins can also move. 🌐 Bitcoin Overview Before starting the analysis, let me remind you once again that at your request we have moved the Bitcoin analysis section to a dedicated daily report - it allows us to discuss the trend, dominance and overall sentiment of the Bitcoin market in more detail every day. On the daily timeframe, what happened after the heavy correction that we reacted to from the important 0.817 support. Currently, we are fluctuating between 0.817 and 1.029, and after breaking any of the levels indicated on the chart, you can open your positions. On the other hand, the support of 0.817 is very important, and if it is touched, you can move to the level of 0.610 and support us there. For a long position, if 1.029 is broken, you can open the position, and you need to be patient to buy sports. You can have more positions and you also need to deal with resistance. 📝 Final Thoughts Stay calm, trade wisely, and let's capture the market's best opportunities! This analysis reflects our opinions and is not financial advice. Share your thoughts in the comments, and don’t forget to share this analysis with your friends! ❤️

Rising33B
تحلیل تکنیکال ETHFI: نقطه ورود، حد سود و زیان برای ترید $0.9911
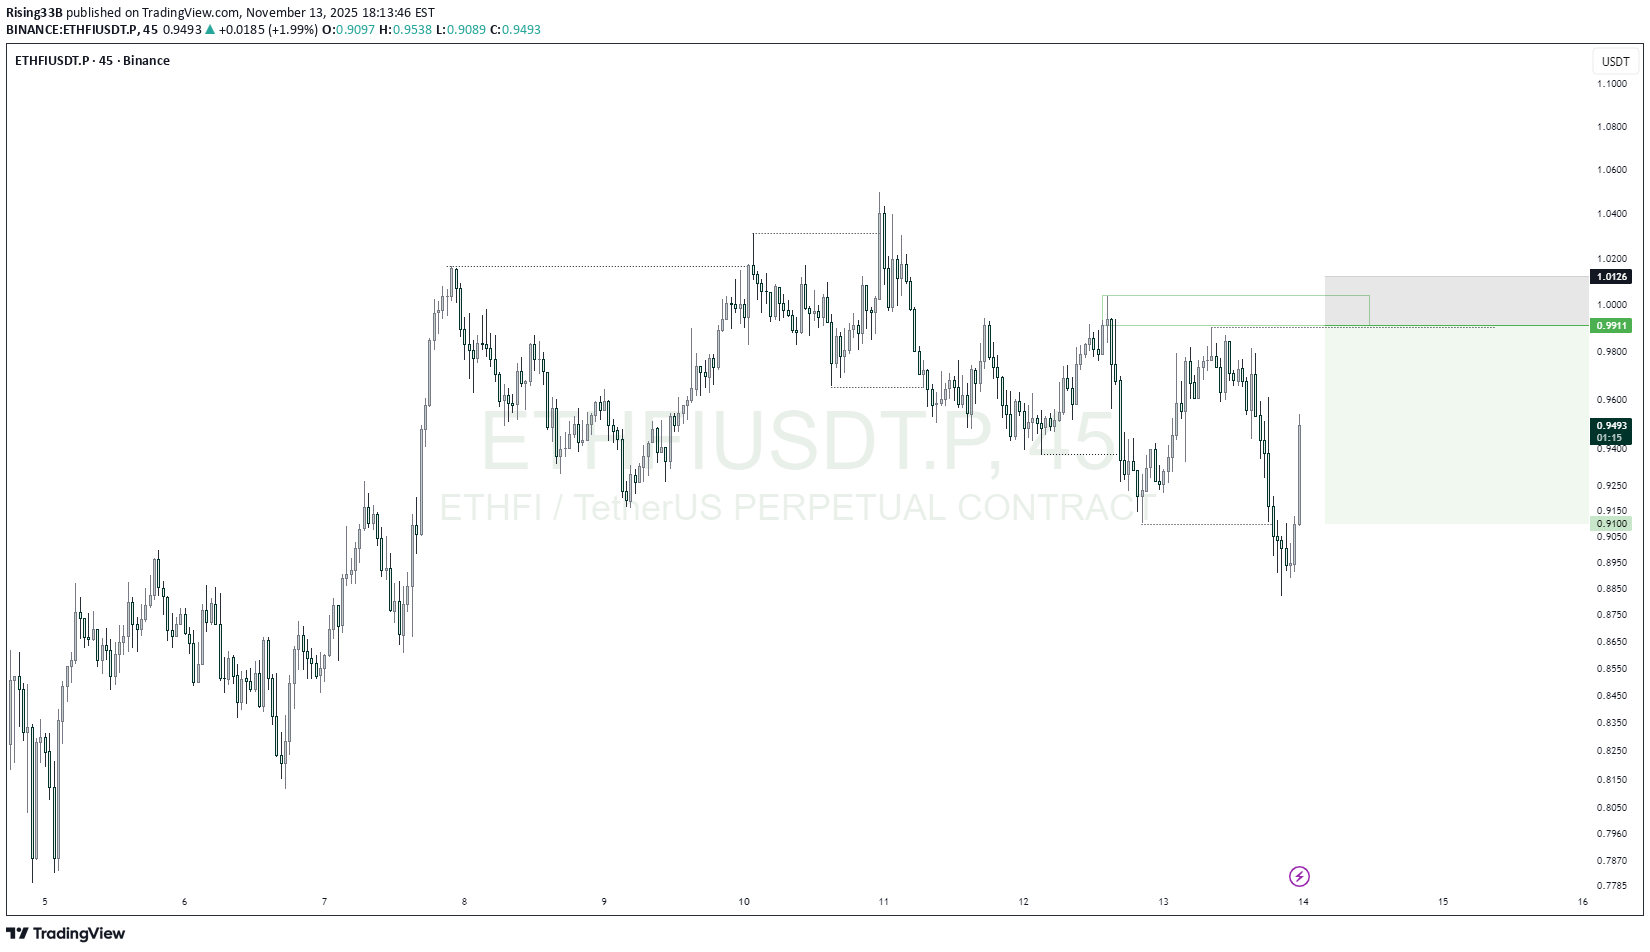
my entry on this trade idea is taken from a point of interest above an inducement . I extended my stoploss area to cover for the whole swing as price can target the liquidity there before going as I anticipate.. just a trade idea, not financial advise Entry; $0.9911 Take Profit; $0.9100 Stop Loss; $1.0126you can close partial at $0.94and apply breakeven.. or jst trade your planTP HIT! Happy trading!

CryptoNuclear
ETHFI در نقطه عطف حیاتی: آیا صعود در راه است یا سقوط زیر ۰.۸۵؟

ETHFI is currently trading within its most critical zone since mid-year — the 1.00–0.85 range, which has long acted as the last stronghold of buyers. This area is a battle zone between large-scale accumulation or the final signal of distribution. After facing prolonged downward pressure and failing to reclaim resistance at 1.80, the price is now retesting a strong demand zone — the same area that triggered a major rally earlier this year. The reaction from this region will define ETHFI’s next macro direction in the coming quarter. The structure suggests the market is in a macro consolidation phase, where liquidity is being collected from both sides before the next major move. A stable 3D candle close above 1.00 could act as the first trigger for a new upward cycle, while a decisive close below 0.85 would confirm a continuation of the multi-month bearish trend. --- 🔶 Technical Structure & Pattern Analysis Yellow Zone (1.00–0.85) is the key demand zone — the area where buyers previously stepped in aggressively. Price is currently moving sideways above this zone, indicating potential accumulation in progress. The previous sharp drop followed by long lower wicks suggests sellers may be losing momentum. Key resistance remains at 1.40 – 1.80, while a 3D breakout above 1.40 would signal a structural shift to bullish. --- 🚀 Bullish Scenario If ETHFI manages to hold and close a 3D candle above 1.00 and then breaks 1.40: Buyers regain control, shifting structure to higher highs and higher lows. Step targets: 1.80 → strong resistance level that capped previous rallies 2.42 → key confirmation of reversal 2.95 – 5.10 → potential expansion/euphoria phase Main validation: 3D close above 1.40 with rising volume. Defensive support: 0.90–0.95 as short-term buyer defense. --- ⚠️ Bearish Scenario If price breaks below 0.85 and closes a 3D candle under this zone: It confirms a major breakdown from the consolidation structure, opening room for deeper correction: 0.70 → next minor support 0.55 → critical retracement area 0.34 → historical extreme low Such breakdowns often trigger panic selling or a capitulation move. Bears remain in control if any retest of 0.85 fails to reclaim the zone. --- 📊 Key Levels (Quick Summary) Major Support (Demand Zone): 1.00 – 0.85 Immediate Resistance: 1.40 Next Resistances: 1.80 → 2.42 → 2.95 → 5.10 – 5.40 Bearish Targets: 0.70 → 0.55 → 0.34 --- 🧭 Macro Outlook & Sentiment Interpretation ETHFI stands at a crossroads — is this the final phase of capitulation or the foundation of a long-term accumulation before reversal? The 1.00–0.85 range could attract institutional buyers, yet without volume confirmation and a clear higher-high structure, the risk of a breakdown remains high. This psychological zone will likely define ETHFI’s direction heading into Q1 2026. --- 🧠 Extra Insights for Traders Wait for 3D candle close confirmation before committing to direction. Avoid FOMO during sideways movement — focus on confirmed breakouts. The best setups come from valid retests of support/resistance zones with real momentum. Watch closely how price reacts in the yellow zone — whether it bounces with strong volume or breaks down impulsively. --- #ETHFI #ETHFIUSDT #CryptoAnalysis #SwingTrade #CryptoSetup #TechnicalAnalysis #CryptoMarket #ReversalZone #CryptoTrading #SupportResistance #3DChart #CryptoOutlook
Richtv_official
آیا ETHFI در راه صعود انفجاری است؟ تحلیل سطوح کلیدی و نقاط ورود طلایی

ETHFI is currently testing a critical support zone between $0.60 and $0.80, a level that previously held strong during market corrections. Price structure appears to be respecting this level, and the RSI is nearing oversold territory, hinting at a possible momentum shift. This combination sets the stage for a potential bounce if current conditions hold. 🔹 Trade Idea Setup 📌 Entry Zone: $0.60 – $0.80 🎯 Take Profit Targets: • TP1: $1.90 • TP2: $2.90 🛑 Stop Loss: $0.18 This setup presents a favorable risk-reward ratio, with entry at support and clearly defined targets. RSI signals are adding confluence, but always watch for volume confirmation and broader market behavior.

talha8252
تحلیل کامل اتریوم (ETHFİ): اهداف کوتاهمدت، میانمدت و بلندمدت تا ۲۰۲۵

ETHFI - As long as the Fed cuts interest rates and bullish continues, the targets are permanent for me. - This analysis was made on 28.10.2025.

barismeral
کریپتو در کف قیمت: الان نخریم کی بخریم؟ بهترین فرصت خرید کجاست؟

There has been a serious stagnation and retreat in the crypto market recently. Many people look at this picture and become demoralized, and even consider leaving the market altogether. But in fact, experienced investors take action precisely during these periods. Because buying when the market is rising rather than falling is risky. The real opportunities arise in these quiet periods when everyone loses hope. Currently, many quality projects are trading at significantly lower levels compared to their past peaks. This means a serious opportunity for investors who think long-term. Of course, no one knows for sure the "bottom of everything", but in general it can be said that these levels are a reasonable collection area in the long term. In such periods, instead of acting in panic, it is a much better strategy to make purchases with a logical plan and in small pieces. In other words, instead of purchasing all capital from a single point, building a position gradually over time both reduces risk and balances the average cost. These prices, which are demoralizing today, may make you look back tomorrow and say, "I wish I had bought it then." ETHFIUSDT LDOUSDT AVAXUSDT TIAUSDT ARBUSDT EIGENUSDT Disclaimer: The information, graphs and comments shared here do not constitute investment advice. It contains only my personal opinions and analysis. It is recommended that you make your investment decisions in line with your own research and risk preferences.

fghareeb
سقوط موقت، وحشت نکنید! رسیدن به ۵ دلار با صبر هنوز ممکن است.

short term dip dont panic $5 is still possible with patience

CryptoandForexplus
تحلیل تکنیکال THFI/USDT: فرصت سودآوری تا پایان سیزن آلت کوینها (ورود در ۱.۵۵ دلار)

A high-potential currency that can give good profits until the end of the alt season Currently, this is the medium-term analysis and the chart is bullish You can buy at $1.55 No analysis is 100% If it falls below the purple range, the analysis will be violated
Disclaimer
Any content and materials included in Sahmeto's website and official communication channels are a compilation of personal opinions and analyses and are not binding. They do not constitute any recommendation for buying, selling, entering or exiting the stock market and cryptocurrency market. Also, all news and analyses included in the website and channels are merely republished information from official and unofficial domestic and foreign sources, and it is obvious that users of the said content are responsible for following up and ensuring the authenticity and accuracy of the materials. Therefore, while disclaiming responsibility, it is declared that the responsibility for any decision-making, action, and potential profit and loss in the capital market and cryptocurrency market lies with the trader.