
ETC
Ethereum Classic
| تریدر | نوع سیگنال | حد سود/ضرر | زمان انتشار | مشاهده پیام |
|---|---|---|---|---|
 JuliiaRank: 111 | خرید | حد سود: تعیین نشده حد ضرر: تعیین نشده | 12/18/2025 | |
 CryptoAnalystSignalRank: 30996 | خرید | حد سود: تعیین نشده حد ضرر: تعیین نشده | 12/23/2025 |
Price Chart of Ethereum Classic
سود 3 Months :
خلاصه سیگنالهای Ethereum Classic
سیگنالهای Ethereum Classic
Filter
Sort messages by
Trader Type
Time Frame
CryptoAnalystSignal
پیشبینی انفجاری قیمت ETC: این سطح حمایت کلیدی، قیمت را به کجا میرساند؟
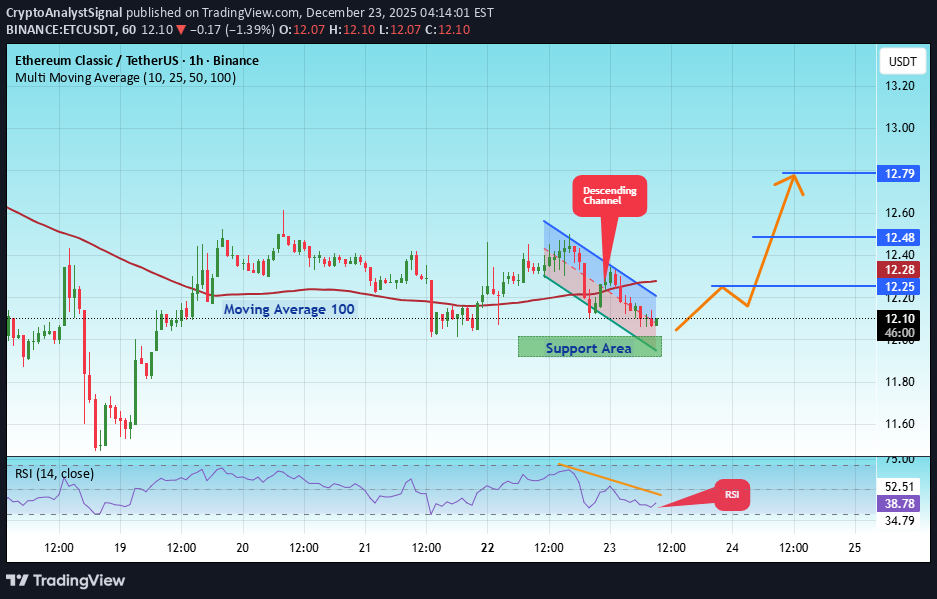
#ETC The price is moving in a descending channel on the 1-hour timeframe. It has reached the lower boundary and is heading towards breaking above it, with a retest of the upper boundary expected. We have a downtrend on the RSI indicator, which has reached near the lower boundary, and an upward rebound is expected. There is a key support zone in green at 11.92. The price has bounced from this zone multiple times and is expected to bounce again. We have a trend towards stability above the 100-period moving average, as we are moving close to it, which supports the upward movement. Entry price: 11.95 First target: 12.25 Second target: 12.48 Third target: 12.79 Don't forget a simple principle: money management. Place your stop-loss below the green support zone. For any questions, please leave a comment. Thank you.

SwallowAcademy
Ethereum Classic (ETC): Huge Bullish CME Gap Is Calling For Us!
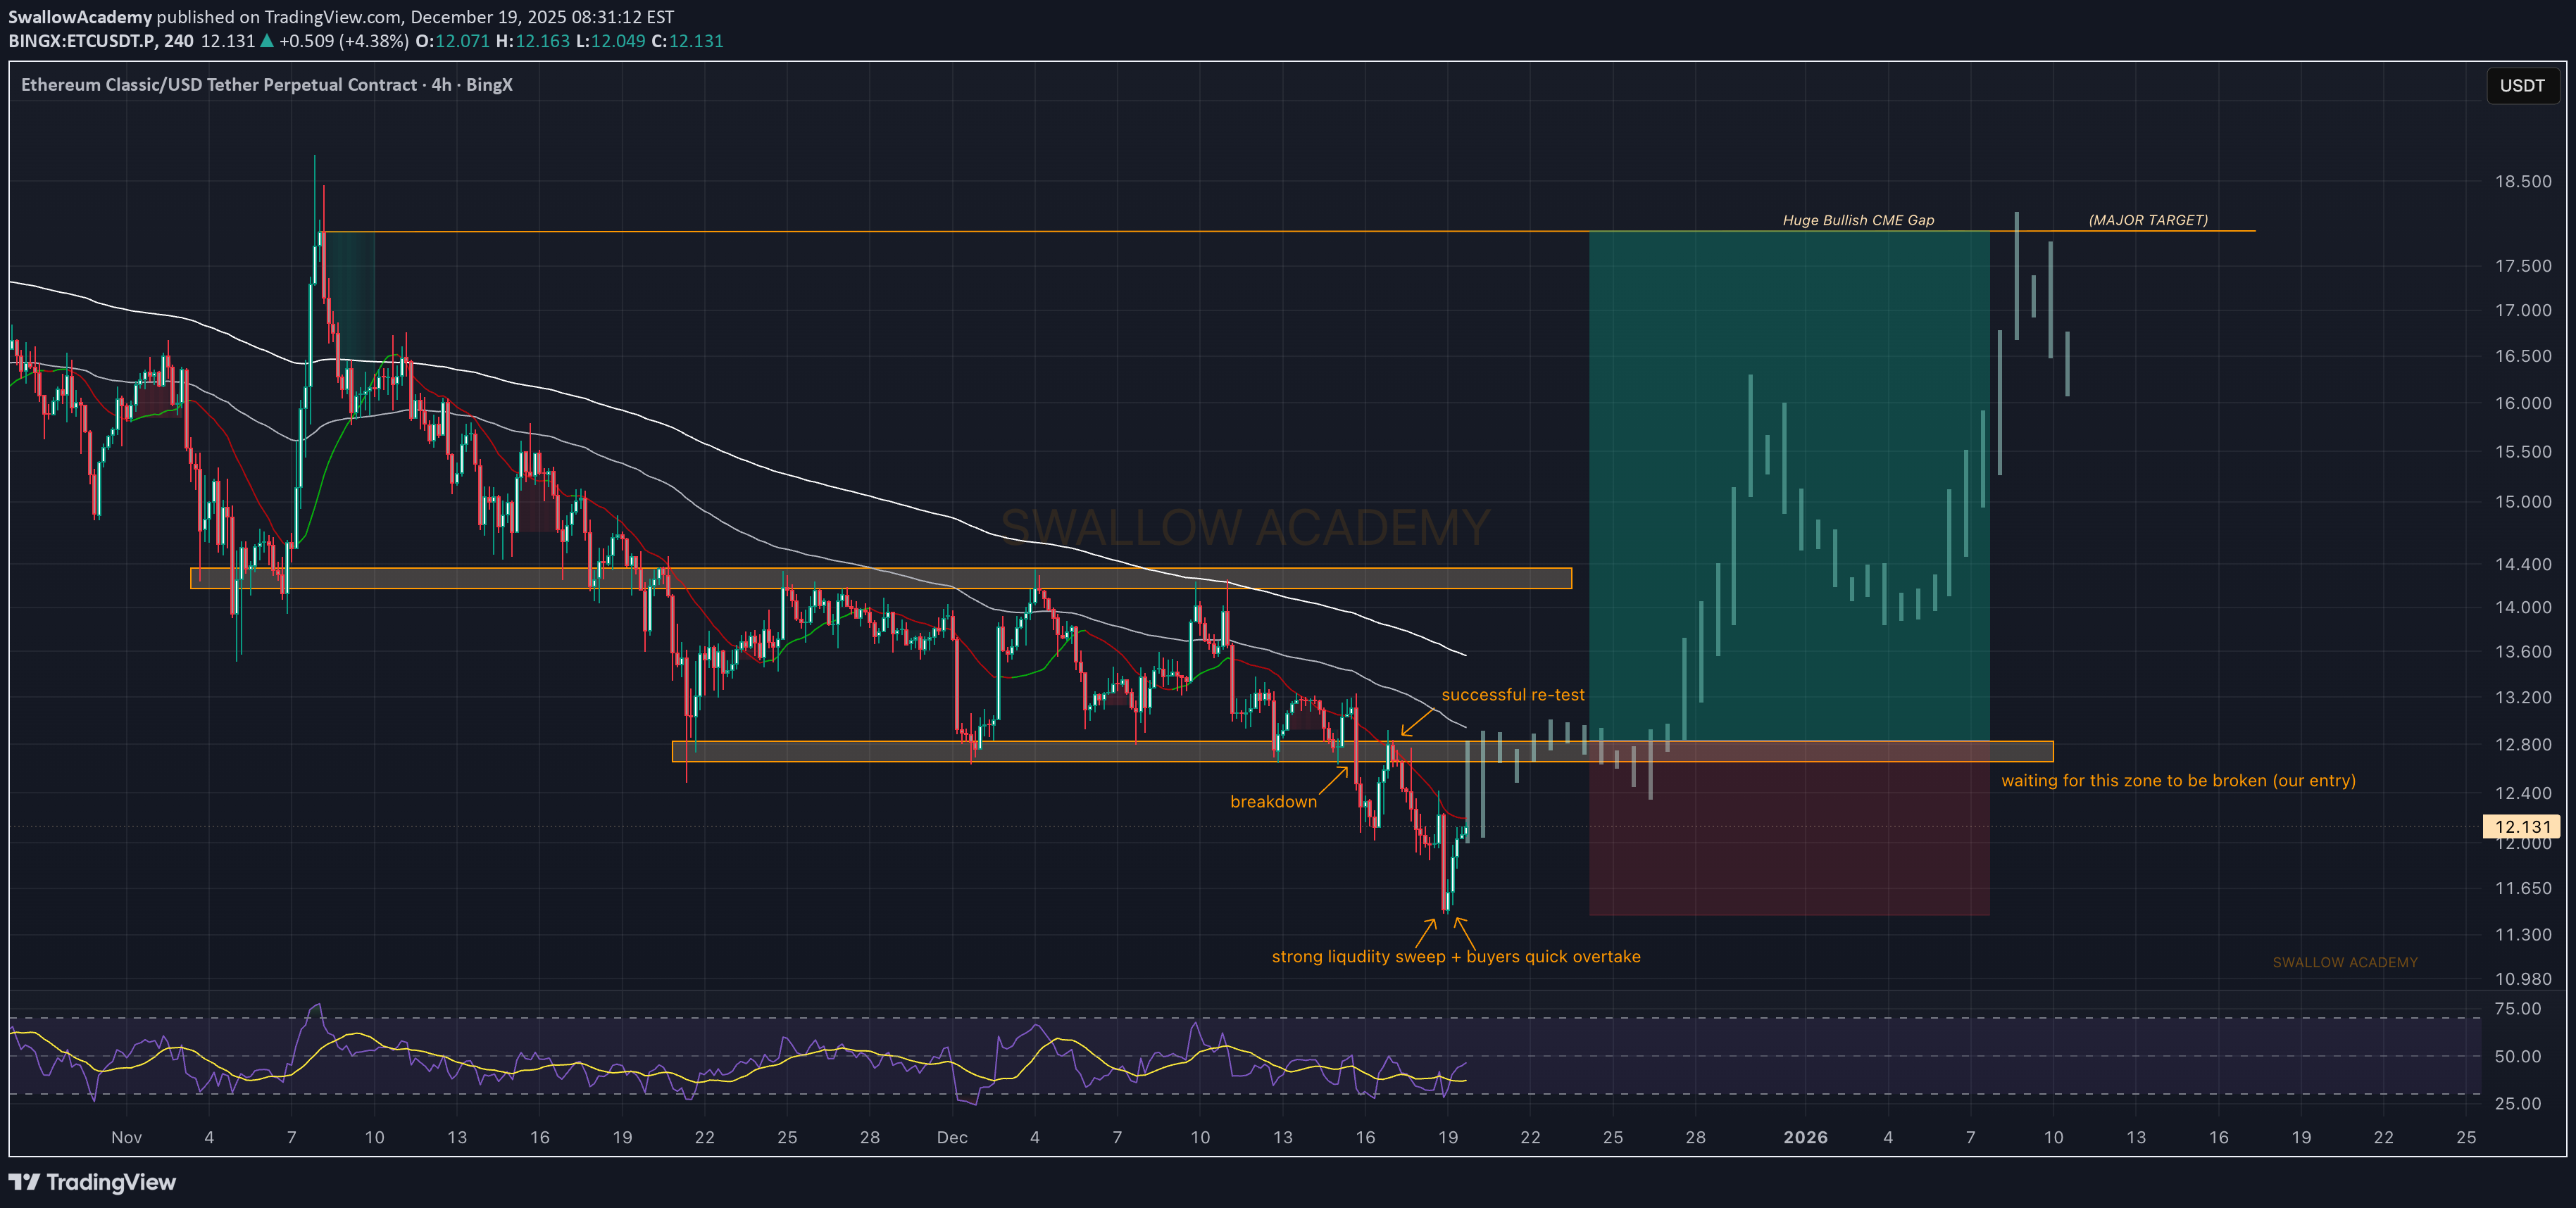
ETC recently broke the local lows, which led to a clear liquidity grab. After that sweep, buyers stepped in quickly and took control, showing early signs that a reversal might be forming here. The game plan is simple from here. We are waiting for a break of the highlighted zone, which by the time price gets there will also line up closely with the EMAs. If buyers manage to reclaim that area, the next move we look for is a continuation toward the large bullish CME gap above. Swallow Academy
Juliia
ETC/USDT Long Set-up
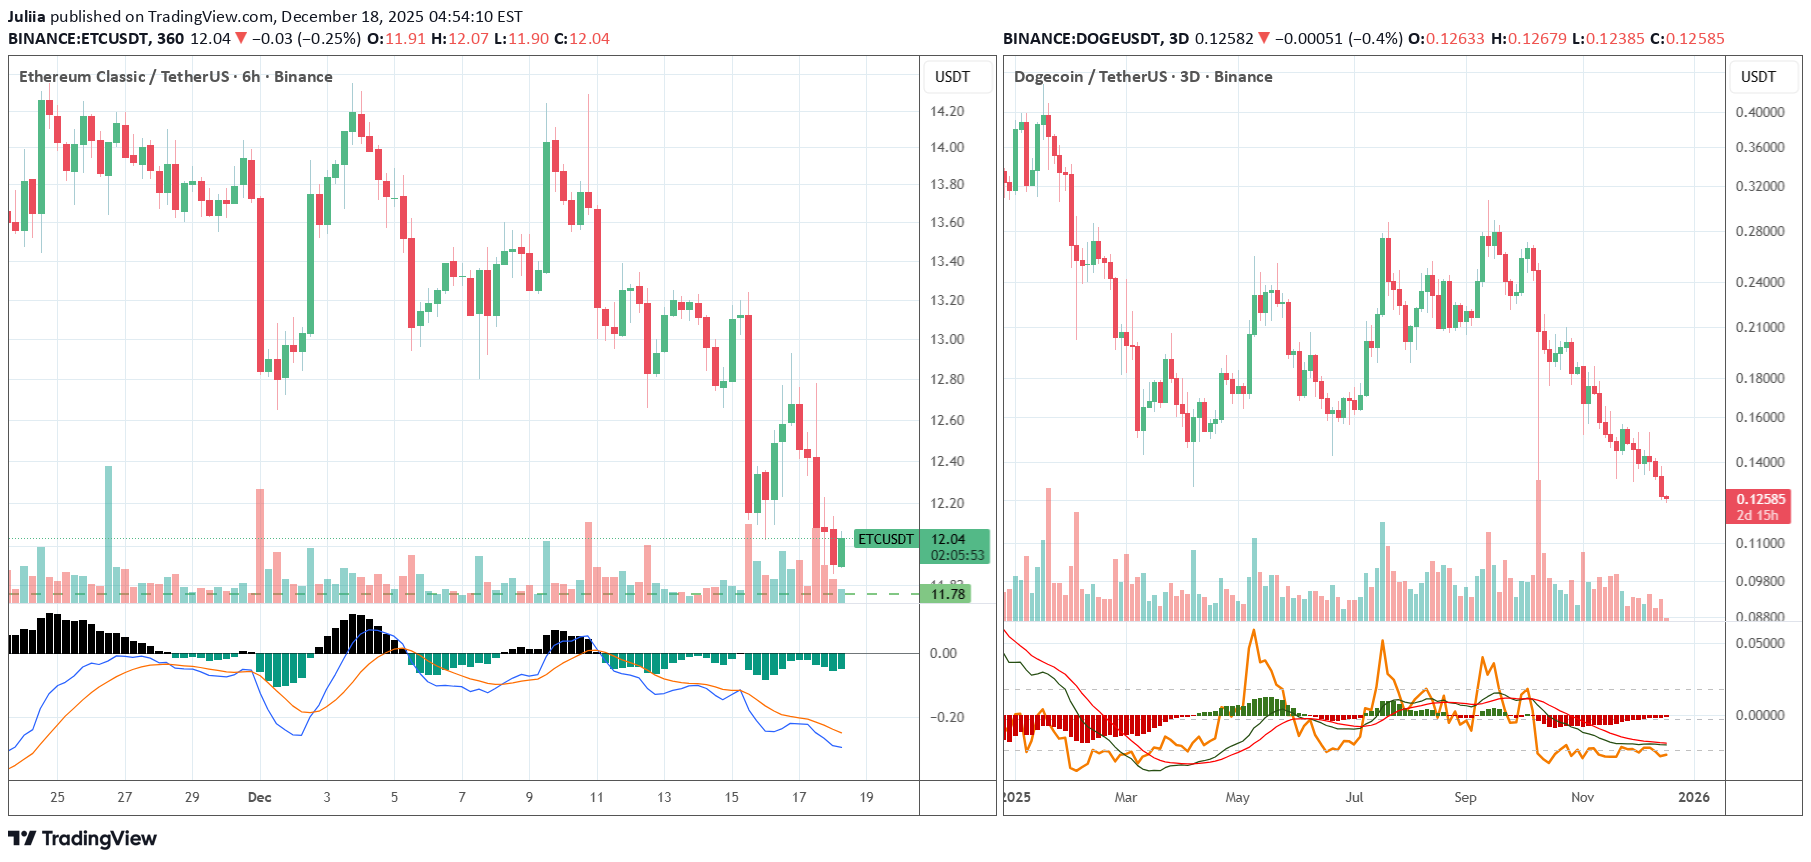
— Strong oversold condition, higher-timeframe convergences, tight stop nearby — Entry: $12.02 — Market Buy — Stop: $11.79 — 1.9% (this is the price movement from entry to stop, NOT the loss percentage) — Target: $14.212 Risk per trade: 1% of total deposit (this is the loss percentage) Position size: 50% of total deposit, leverage 10x Risk/Reward: 1:9.7
Juliia
سیگنال خرید قوی ETC/USDT: آیا فرصت ترید طلایی در راه است؟ (ریسک کم، سود بالا)

— Technical formation: wedge, supported by divergence on higher timeframes, dangerously close to the level, but the movement has not developed for almost a month. Strong short signal on Bitcoin has already played out. — Entry: $13.125 Market buy — Stop: $12.55 – 4.5% (this is the percentage of price movement from entry to stop, NOT percentage of loss) — Target: $16.5 Risk per trade: 1% of total deposit – this is the actual percentage of loss Position size: 20% of total deposit, leverage 10x RR 1:6
SwallowAcademy
شکست خط گردن اتریوم کلاسیک (ETC): منتظر جهش بزرگ به سمت شکاف قیمتی!
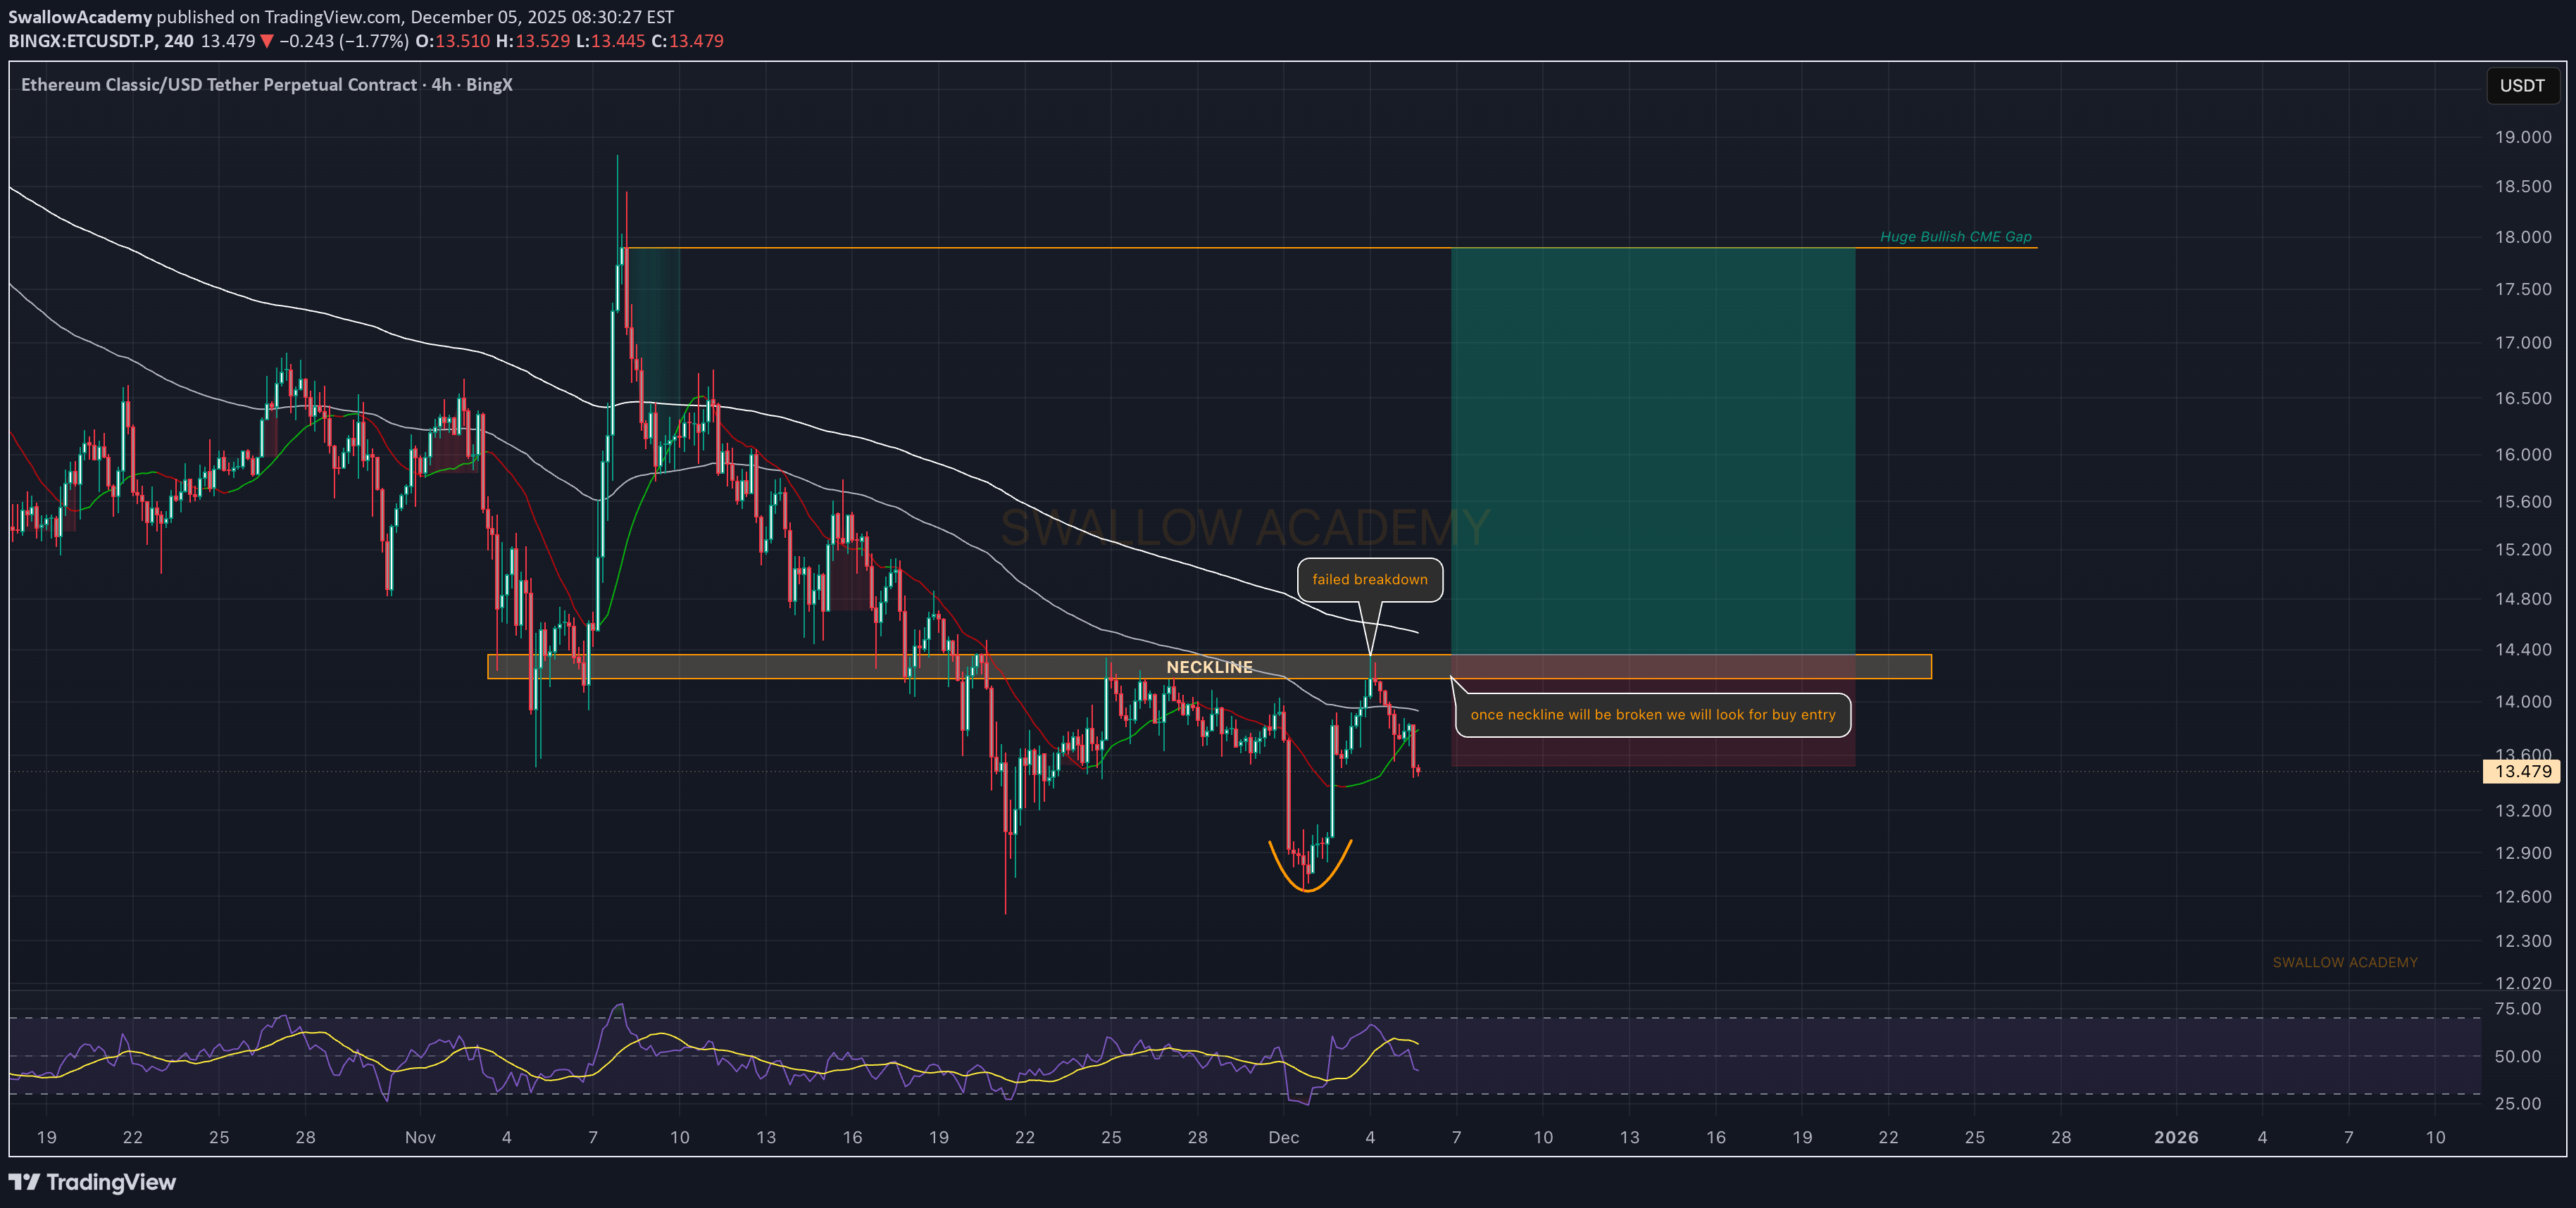
ETC keeps rejecting around the neckline, and until buyers break and secure this level there’s no clean long setup yet. The good part is that we already saw a failed breakdown at the lows, which shows buyers defending the zone. Once we get a clean breakout above the neckline, the plan becomes straightforward — look for an entry on the retest and aim for the big CME gap above. In the current market these bullish gaps usually act like magnets, so the moment structure flips, the upside move can come fast. Swallow Academy

تأیید روند صعودی بزرگ: آیا این نقطه ورود طلایی است؟
above the 50ma ++ super hormonica trend line. Can be Bull for now, join for updates ty
CryptoAnalystSignal
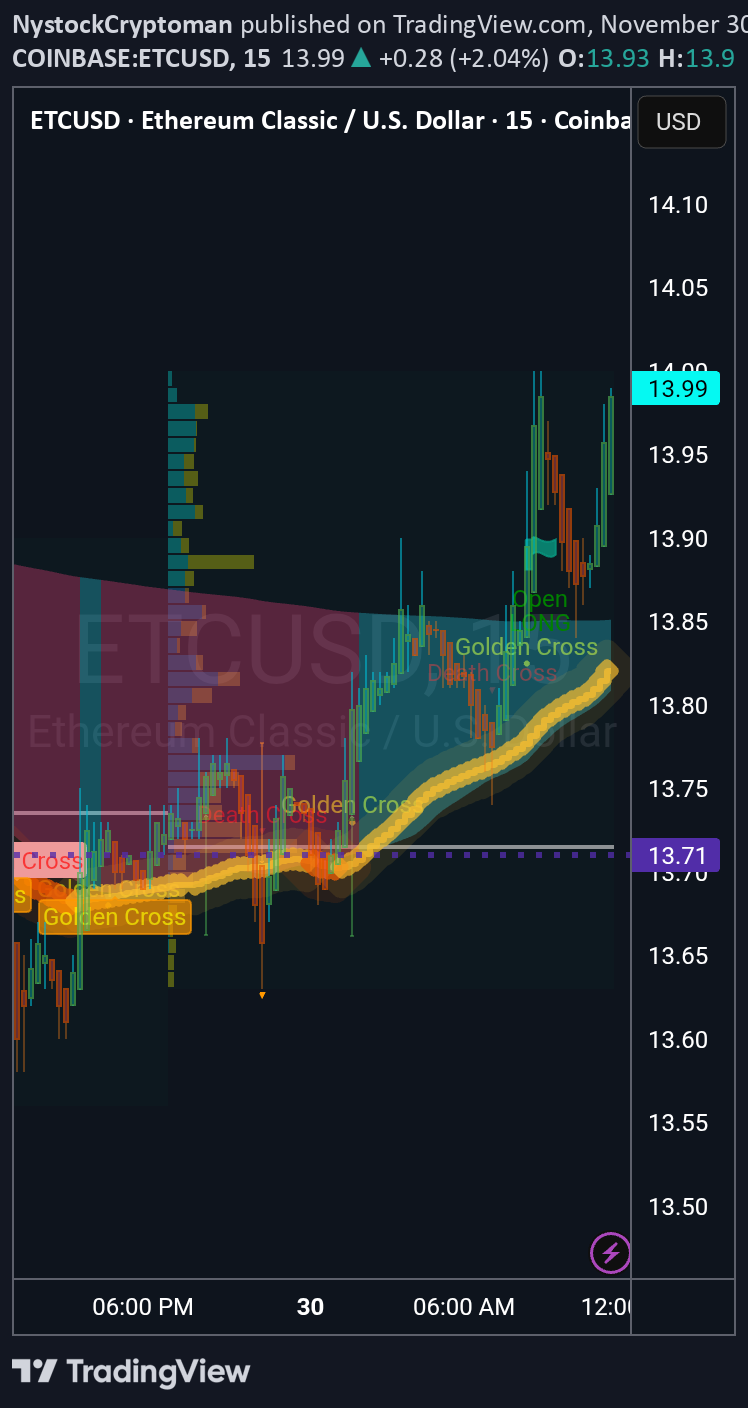
تحلیل تکنیکال ETC/USDT: فرصت خرید در حمایت کلیدی با اهداف صعودی!
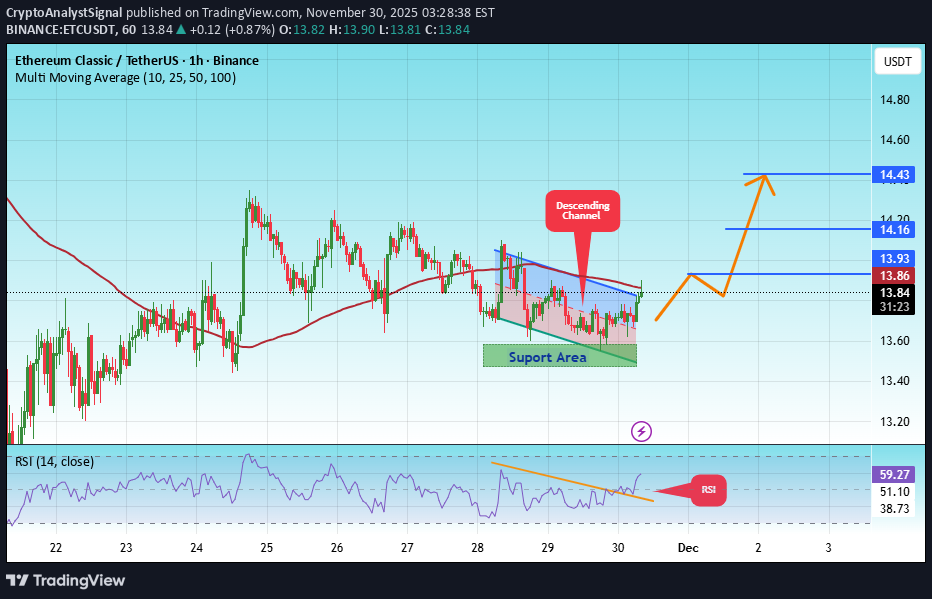
#ETC The price is moving in a descending channel on the 1-hour timeframe. It has reached the lower boundary and is heading towards breaking above it, with a retest of the upper boundary expected. We have a downtrend on the RSI indicator, which has reached near the lower boundary, and an upward rebound is expected. There is a key support zone in green at 13.86. The price has bounced from this zone multiple times and is expected to bounce again. We have a trend towards stability above the 100-period moving average, as we are moving close to it, which supports the upward movement. Entry price: 13.86 First target: 13.93 Second target: 14.16 Third target: 14.43 Don't forget a simple principle: money management. Place your stop-loss below the support zone in green. For any questions, please leave a comment. Thank you.#ETC First target: 13.93 Reached Second target: 14.16 Reached

moesalama
تکرار تاریخ: آیا حرکت بزرگ اتریوم کلاسیک (ETC) دوباره آغاز میشود؟
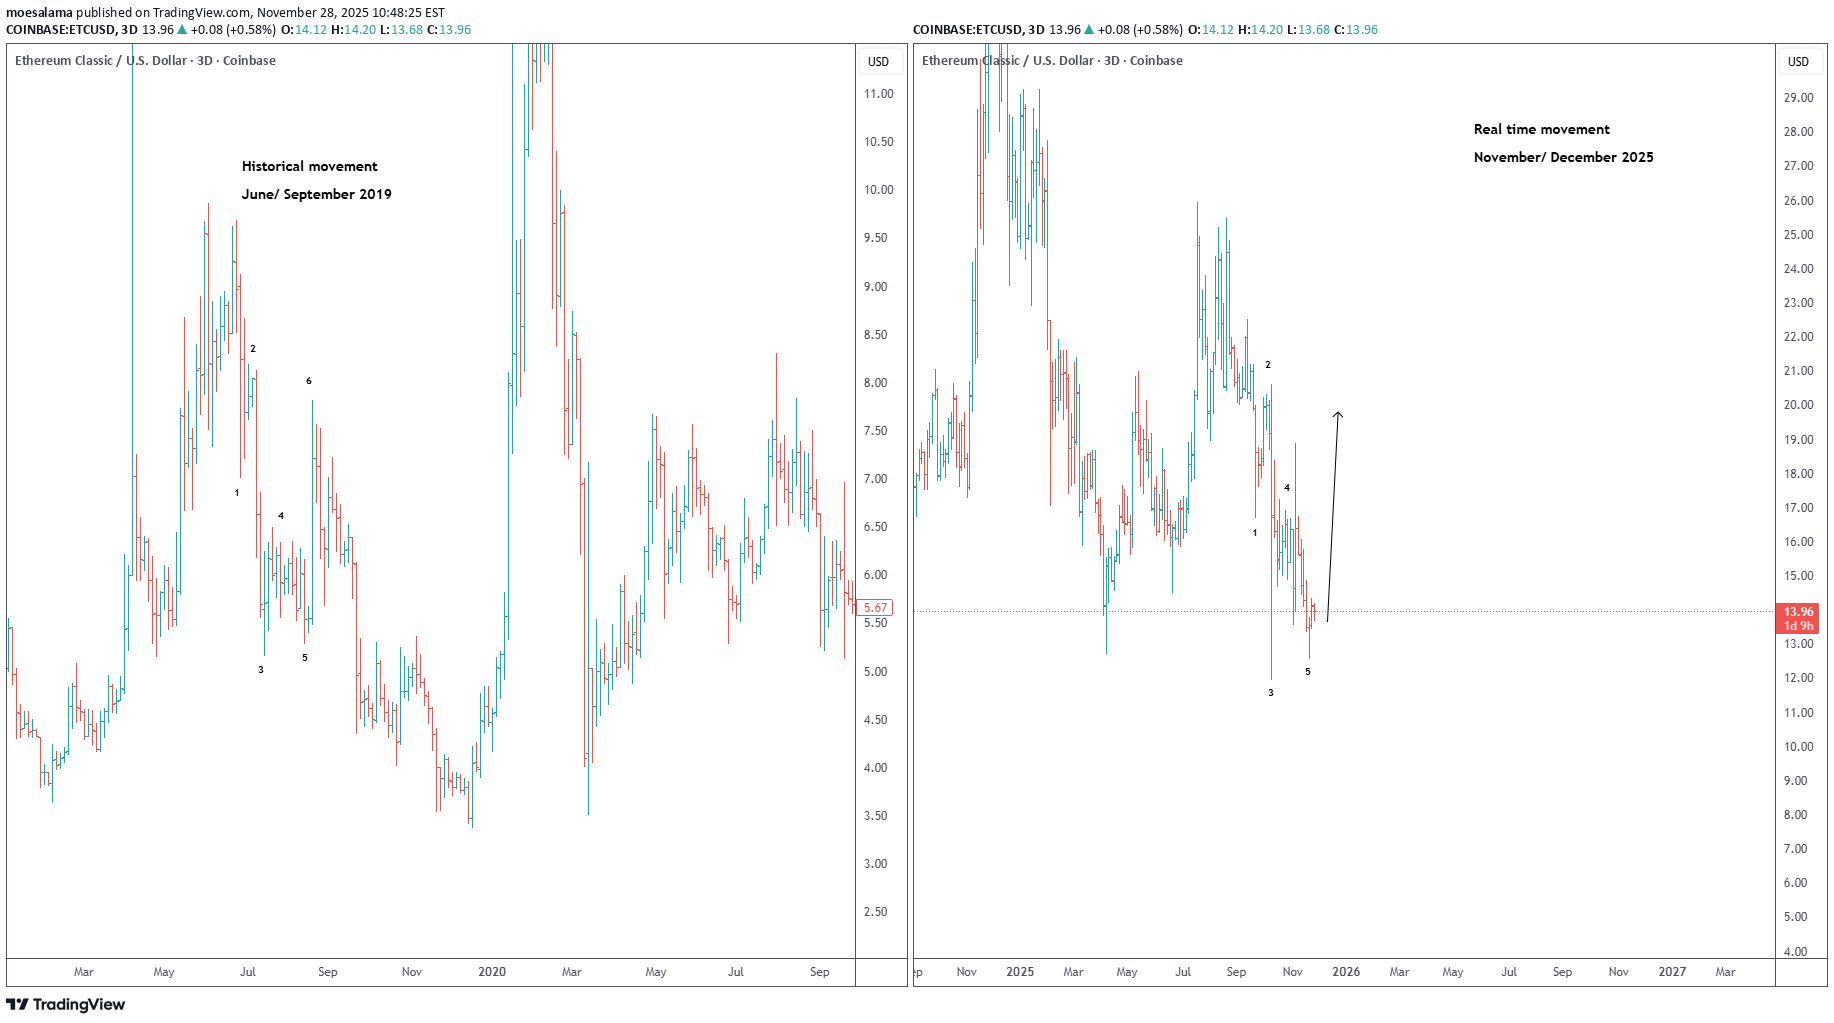
A historical movement from June/ September 2019 might be repeating in real time.

St_Gex
پتانسیل انفجاری ۷۰۰ درصدی اتریوم کلاسیک (ETC): فرصت خرید طلایی؟

Hi. Considering the low price and decent fundamentals, ETC is a good entry. Not a trading advice. Thanks Gex
نمودارها چه میگویند؟ چگونه الان در بازار صعودی شویم؟ (تحلیل BNB)
Nice charts showing similar patterns lol . How to be bullish right now? Need trading at yesterday's price , easy right? Join for updates, fyi chart is for bnb etc
Disclaimer
Any content and materials included in Sahmeto's website and official communication channels are a compilation of personal opinions and analyses and are not binding. They do not constitute any recommendation for buying, selling, entering or exiting the stock market and cryptocurrency market. Also, all news and analyses included in the website and channels are merely republished information from official and unofficial domestic and foreign sources, and it is obvious that users of the said content are responsible for following up and ensuring the authenticity and accuracy of the materials. Therefore, while disclaiming responsibility, it is declared that the responsibility for any decision-making, action, and potential profit and loss in the capital market and cryptocurrency market lies with the trader.