
DODO
DODO
| تریدر | نوع سیگنال | حد سود/ضرر | زمان انتشار | مشاهده پیام |
|---|---|---|---|---|
 Alpha-GoldFXRank: 34731 | خرید | حد سود: تعیین نشده حد ضرر: تعیین نشده | 11/26/2025 |
Price Chart of DODO
سود 3 Months :
سیگنالهای DODO
Filter
Sort messages by
Trader Type
Time Frame
Alpha-GoldFX
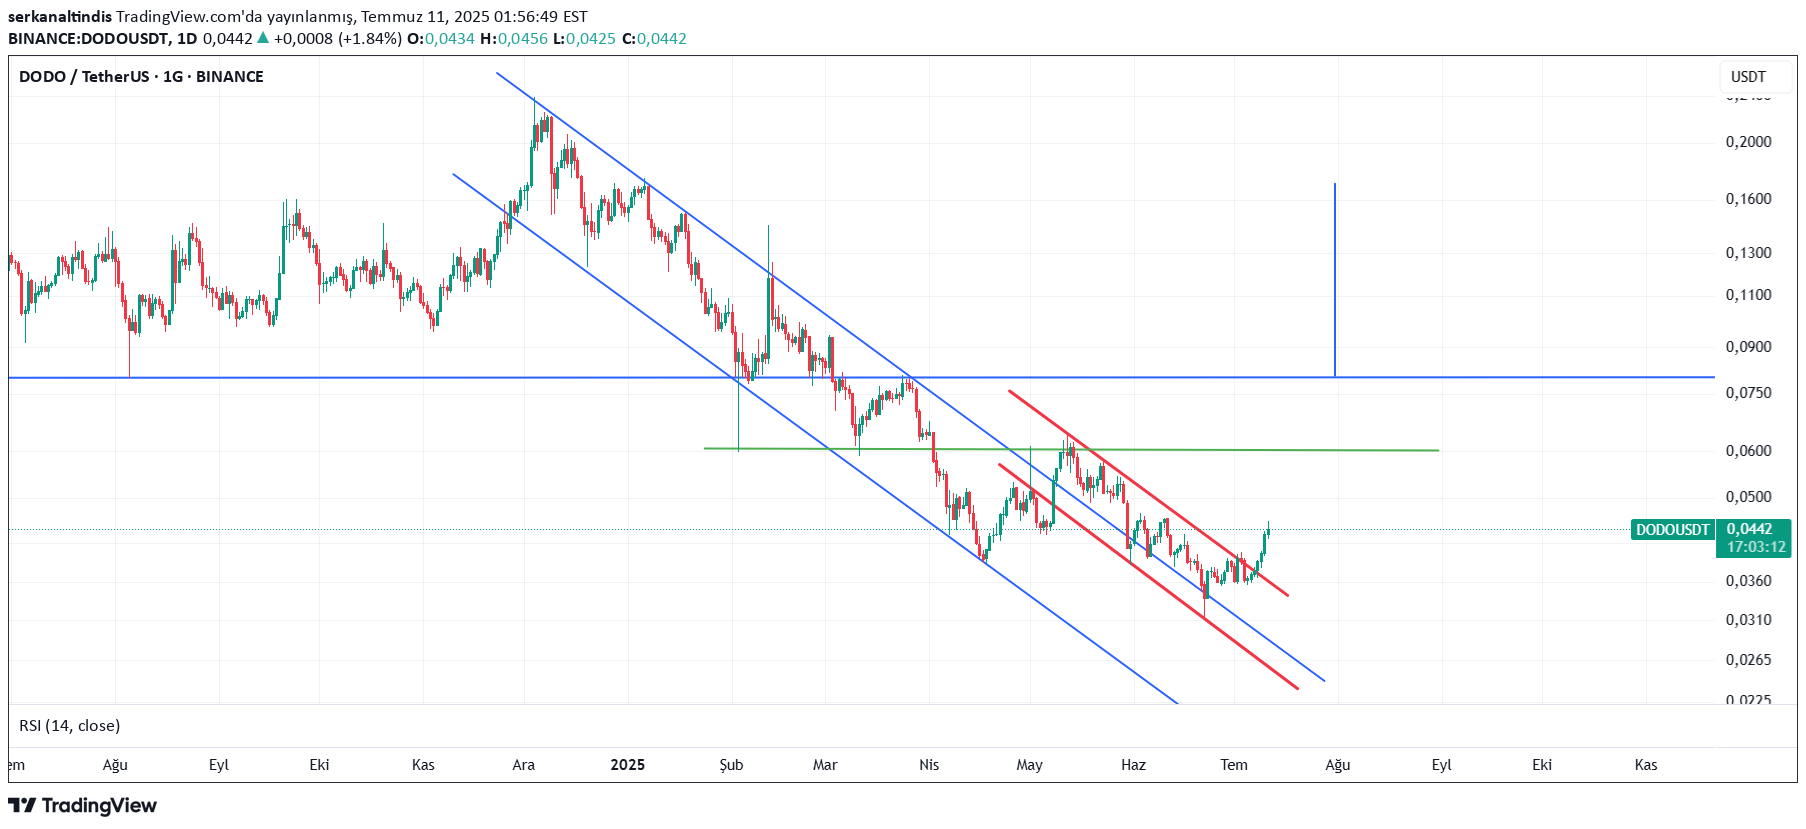
الگوی گوه نزولی DODOUSDT: سیگنال انفجار بزرگ 90 درصدی در راه است؟

DODOUSDT is forming a clear falling wedge pattern, a classic bullish reversal signal that often indicates an upcoming breakout. The price has been consolidating within a narrowing range, suggesting that selling pressure is weakening while buyers are beginning to regain control. With consistent volume confirming accumulation at lower levels, the setup hints at a potential bullish breakout soon. The projected move could lead to an impressive gain of around 80% to 90% once the price breaks above the wedge resistance. This falling wedge pattern is typically seen at the end of downtrends or corrective phases, and it represents a potential shift in market sentiment from bearish to bullish. Traders closely watching DODOUSDT are noting the strengthening momentum as it nears a breakout zone. The good trading volume adds confidence to this pattern, showing that market participants are positioning early in anticipation of a reversal. Investors’ growing interest in DODOUSDT reflects rising confidence in the project’s long-term fundamentals and current technical strength. If the breakout confirms with sustained volume, this could mark the start of a fresh bullish leg. Traders might find this a valuable setup for medium-term gains, especially as the wedge pattern completes and buying momentum accelerates. ✅ Show your support by hitting the like button and ✅ Leaving a comment below! (What is your opinion about this Coin?) Your feedback and engagement keep me inspired to share more insightful market analysis with you!

کاربر تازهوارد
تحلیل جامع و بهروز ارز دیجیتال dodo (دودو) 📈
Analysis دودو Please give up

Traders_Notes
High-Risk Crypto Bet – DODO Analysis

DODO is a decentralized finance (#DeFi) protocol that has seen a brutal 99% drawdown from its peak — making it one of the most devalued tokens in the market. 📉 Structure: The chart shows a “channel within a channel” structure — a signal of prolonged capitulation. DODO is currently in a range where most have written it off. But history shows that such zones often precede major reversals. 🌀 Formation: A potential inverse head and shoulders pattern is developing — a classic reversal setup. The minimal target from this structure is around $0.08. 📈 Early Signal: Price has already bounced +75% from the bottom — a possible sign of early accumulation. ☕ Bigger Picture: This zone might be forming the right side of a long-term cup pattern — hinting at a potential macro reversal if the market supports.

pullbacksignal
Trading Signal For DODOUSDT
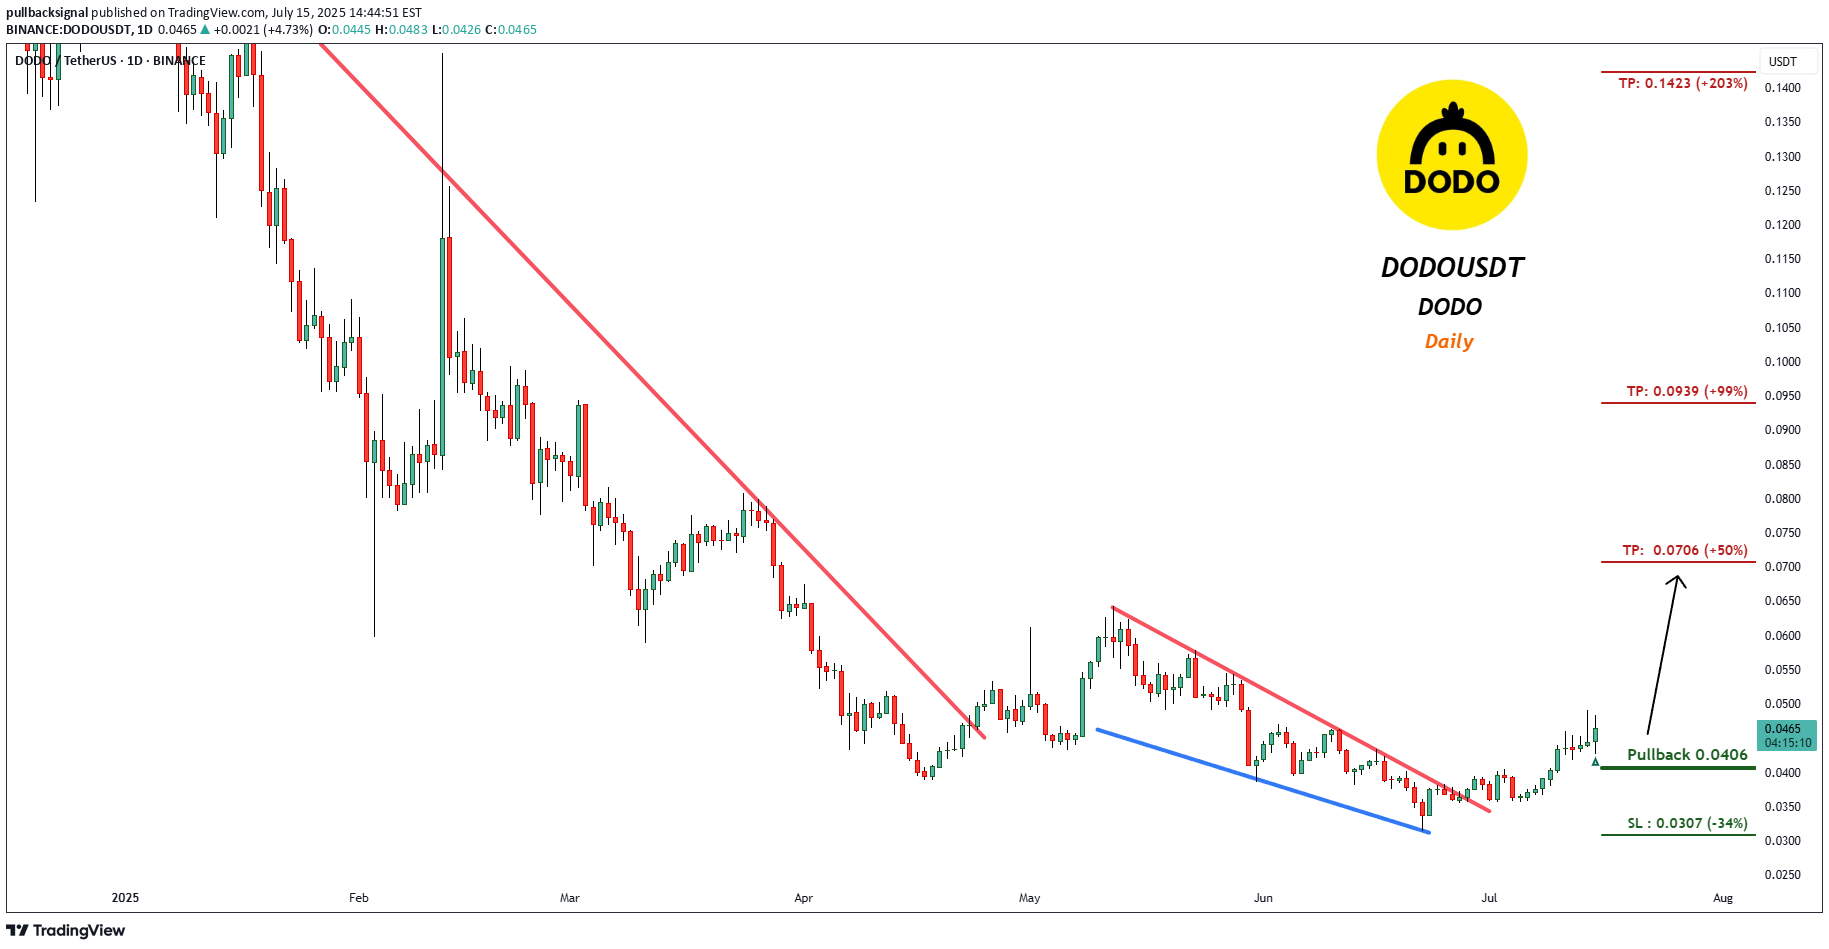
Trading Setup: A Trading Signal is seen in the DODOUSDT DODO (Daily) (spot) Traders can open their Buy Trades NOW ⬆️Buy now or Buy on 0.0406 ⭕️SL @ 0.0307 (-34%) 🔵TP1 @ 0.0706 (+50%) 🔵TP2 @ 0.0939 (+99%) 🔵TP3 @ 0.1423 (+203%) What are these signals based on? Classical Technical Analysis Price Action Candlesticks Fibonacci RSI, Moving Average , Ichimoku , Bollinger Bands Risk Warning Trading Forex, CFDs, Crypto, Futures, and Stocks involve a risk of loss. Please consider carefully if such trading is appropriate for you. Past performance is not indicative of future results. If you liked our ideas, please support us with your likes 👍 and comments .

#dodo
His first goal is to go slowly with hard attacks in the meantime.

weslad
Dodousdt decline continues
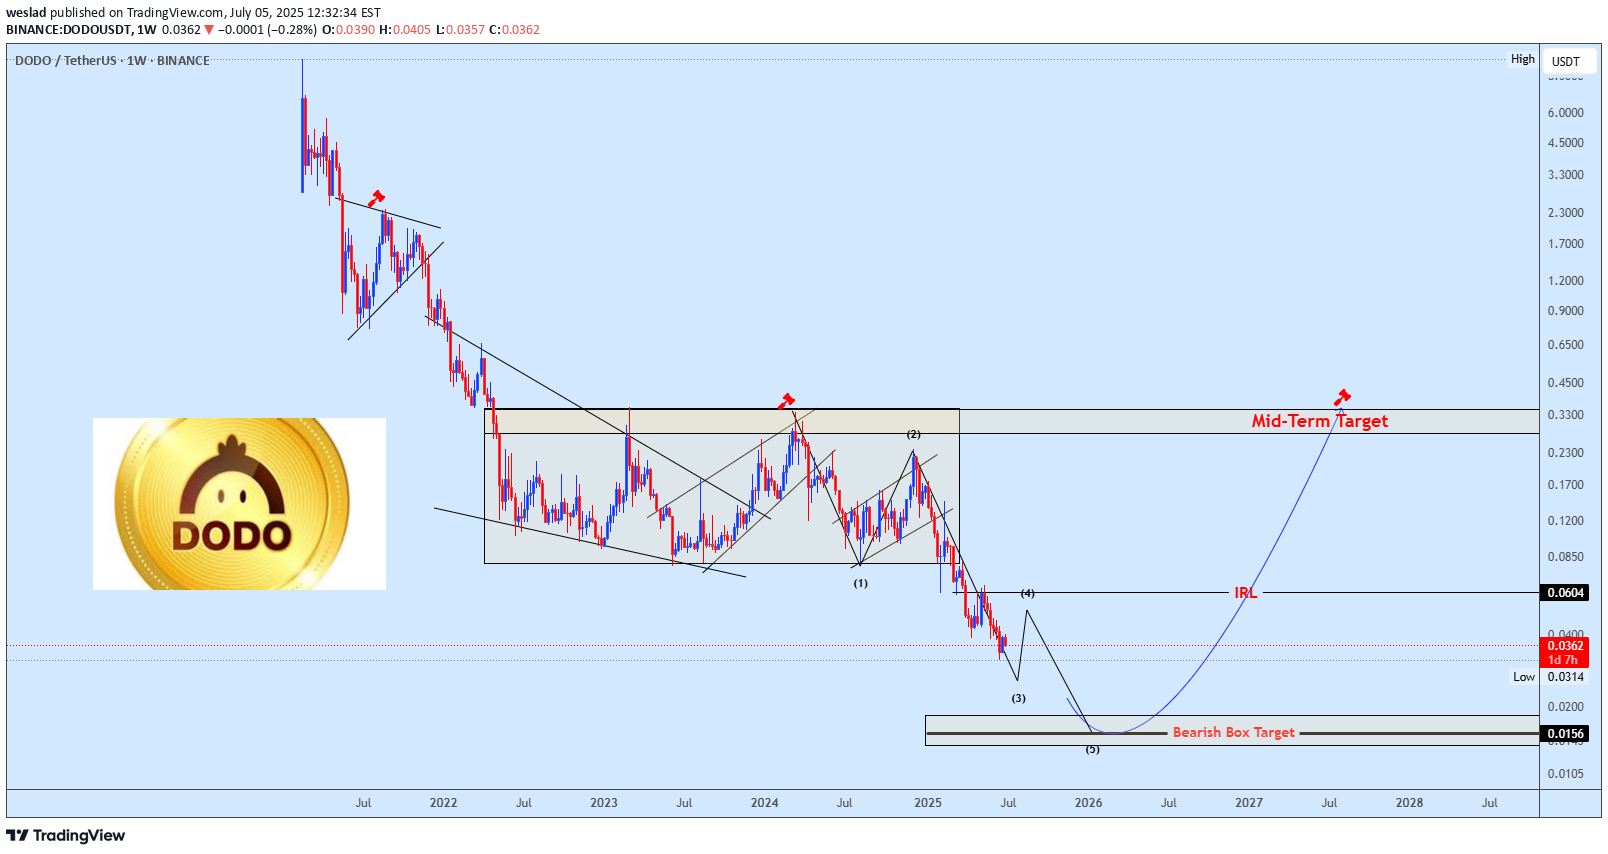
DODOUSDT has continued its downtrend, breaking below the key rectangular consolidation zone. With this breakdown confirmed, price is now heading toward the projected bearish box target.The plan is to monitor this lower zone for potential accumulation, anticipating a recovery move back toward the upper boundary of the previous consolidation box, which aligns with the mid-term target around the $0.33 region.Patience and confirmation will be essential before entering. This zone could offer a valuable long-term opportunity if market structure begins to shift.

CryptoNuclear
DODO/USDT Approaching Major Breakout? End of a Long Downtrend?

📊 In-Depth Analysis of DODO/USDT (1D Chart)The DODO/USDT pair remains in a medium-to-long-term downtrend since late 2024. However, the current price action shows early signs of a potential reversal.📐 Pattern and StructureDowntrend Resistance Line: The descending yellow trendline from the December 2024 peak continues to act as major resistance. Price is now testing this line.Key Support Zone: The region around $0.0314 – $0.0384 is a strong support area, proven by multiple bounce attempts.Layered Resistance Zones:$0.0454$0.0512$0.0606$0.0787$0.1169Major high at $0.2219🟢 Bullish ScenarioIf price breaks above the descending trendline, it could signal:1. A potential short-term trend reversal.2. First upside targets lie around $0.0454 and $0.0512.3. With strong volume, further upside to $0.0606 and $0.0787 is possible.Bullish Confirmation: A breakout candle above the trendline with strong volume and a successful retest.🔴 Bearish ScenarioIf the price gets rejected at the trendline:1. Price could revisit the critical $0.0314 support.2. A breakdown below $0.0314 would likely trigger a new lower low, extending the downtrend.3. Minimal support exists below this level, increasing downside risk.📌 Pattern SummaryThe structure shows a classic descending trendline dominating the market.The price is consolidating and forming a potential accumulation base.A confirmed breakout would likely shift the overall momentum.🧠 Strategy & Risk ManagementAggressive Entry: Buy on breakout + successful retest of trendline.Conservative Entry: Wait for confirmation above $0.0512 for safer reversal confirmation.Stop-loss: Below $0.0314, the critical support zone.#DODOUSDT #CryptoBreakout #TechnicalAnalysis #AltcoinReversal #TrendlineBreak #CryptoChart #CryptoSignals #DODOAnalysis #BullishBreakout

ShMohsin
dodo usdt

Buy current price 0.0398can sell in parts till 0.064current prices are very less. it was even less since 2022have some unlocking too from tomorrow but still in very cheap prices.

revange
DODOUSDT
Short -term trade. When the lower red zone volume is crossed, it can be progressed by taking a snow in the TP points.
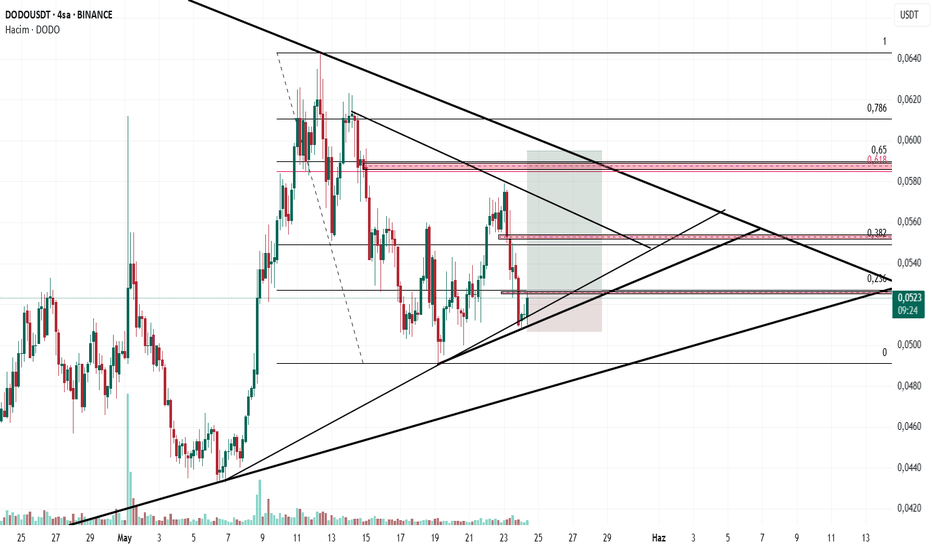
revange
DODOUSDT

این فرصتهای معاملاتی کوتاهمدت ارائه میدهد. میتوان با عبور پرحجم از ناحیه قرمز پایین، وارد معامله شد و با کسب سود در نقاط TP پیش رفت. اما رویداد اصلی با شکستهشدن روند به سمت بالا آغاز شد.
Disclaimer
Any content and materials included in Sahmeto's website and official communication channels are a compilation of personal opinions and analyses and are not binding. They do not constitute any recommendation for buying, selling, entering or exiting the stock market and cryptocurrency market. Also, all news and analyses included in the website and channels are merely republished information from official and unofficial domestic and foreign sources, and it is obvious that users of the said content are responsible for following up and ensuring the authenticity and accuracy of the materials. Therefore, while disclaiming responsibility, it is declared that the responsibility for any decision-making, action, and potential profit and loss in the capital market and cryptocurrency market lies with the trader.