
DGB
DigiByte
| تریدر | نوع سیگنال | حد سود/ضرر | زمان انتشار | مشاهده پیام |
|---|---|---|---|---|
 Dr_WallstreetRank: 34110 | فروش | حد سود: تعیین نشده حد ضرر: تعیین نشده | 13 hour ago |
Price Chart of DigiByte
سود 3 Months :
سیگنالهای DigiByte
Filter
Sort messages by
Trader Type
Time Frame
Dr_Wallstreet
تست زنده مدل حجمی: پیشبینی حرکت 20 درصدی نزولی بدون اهرم!
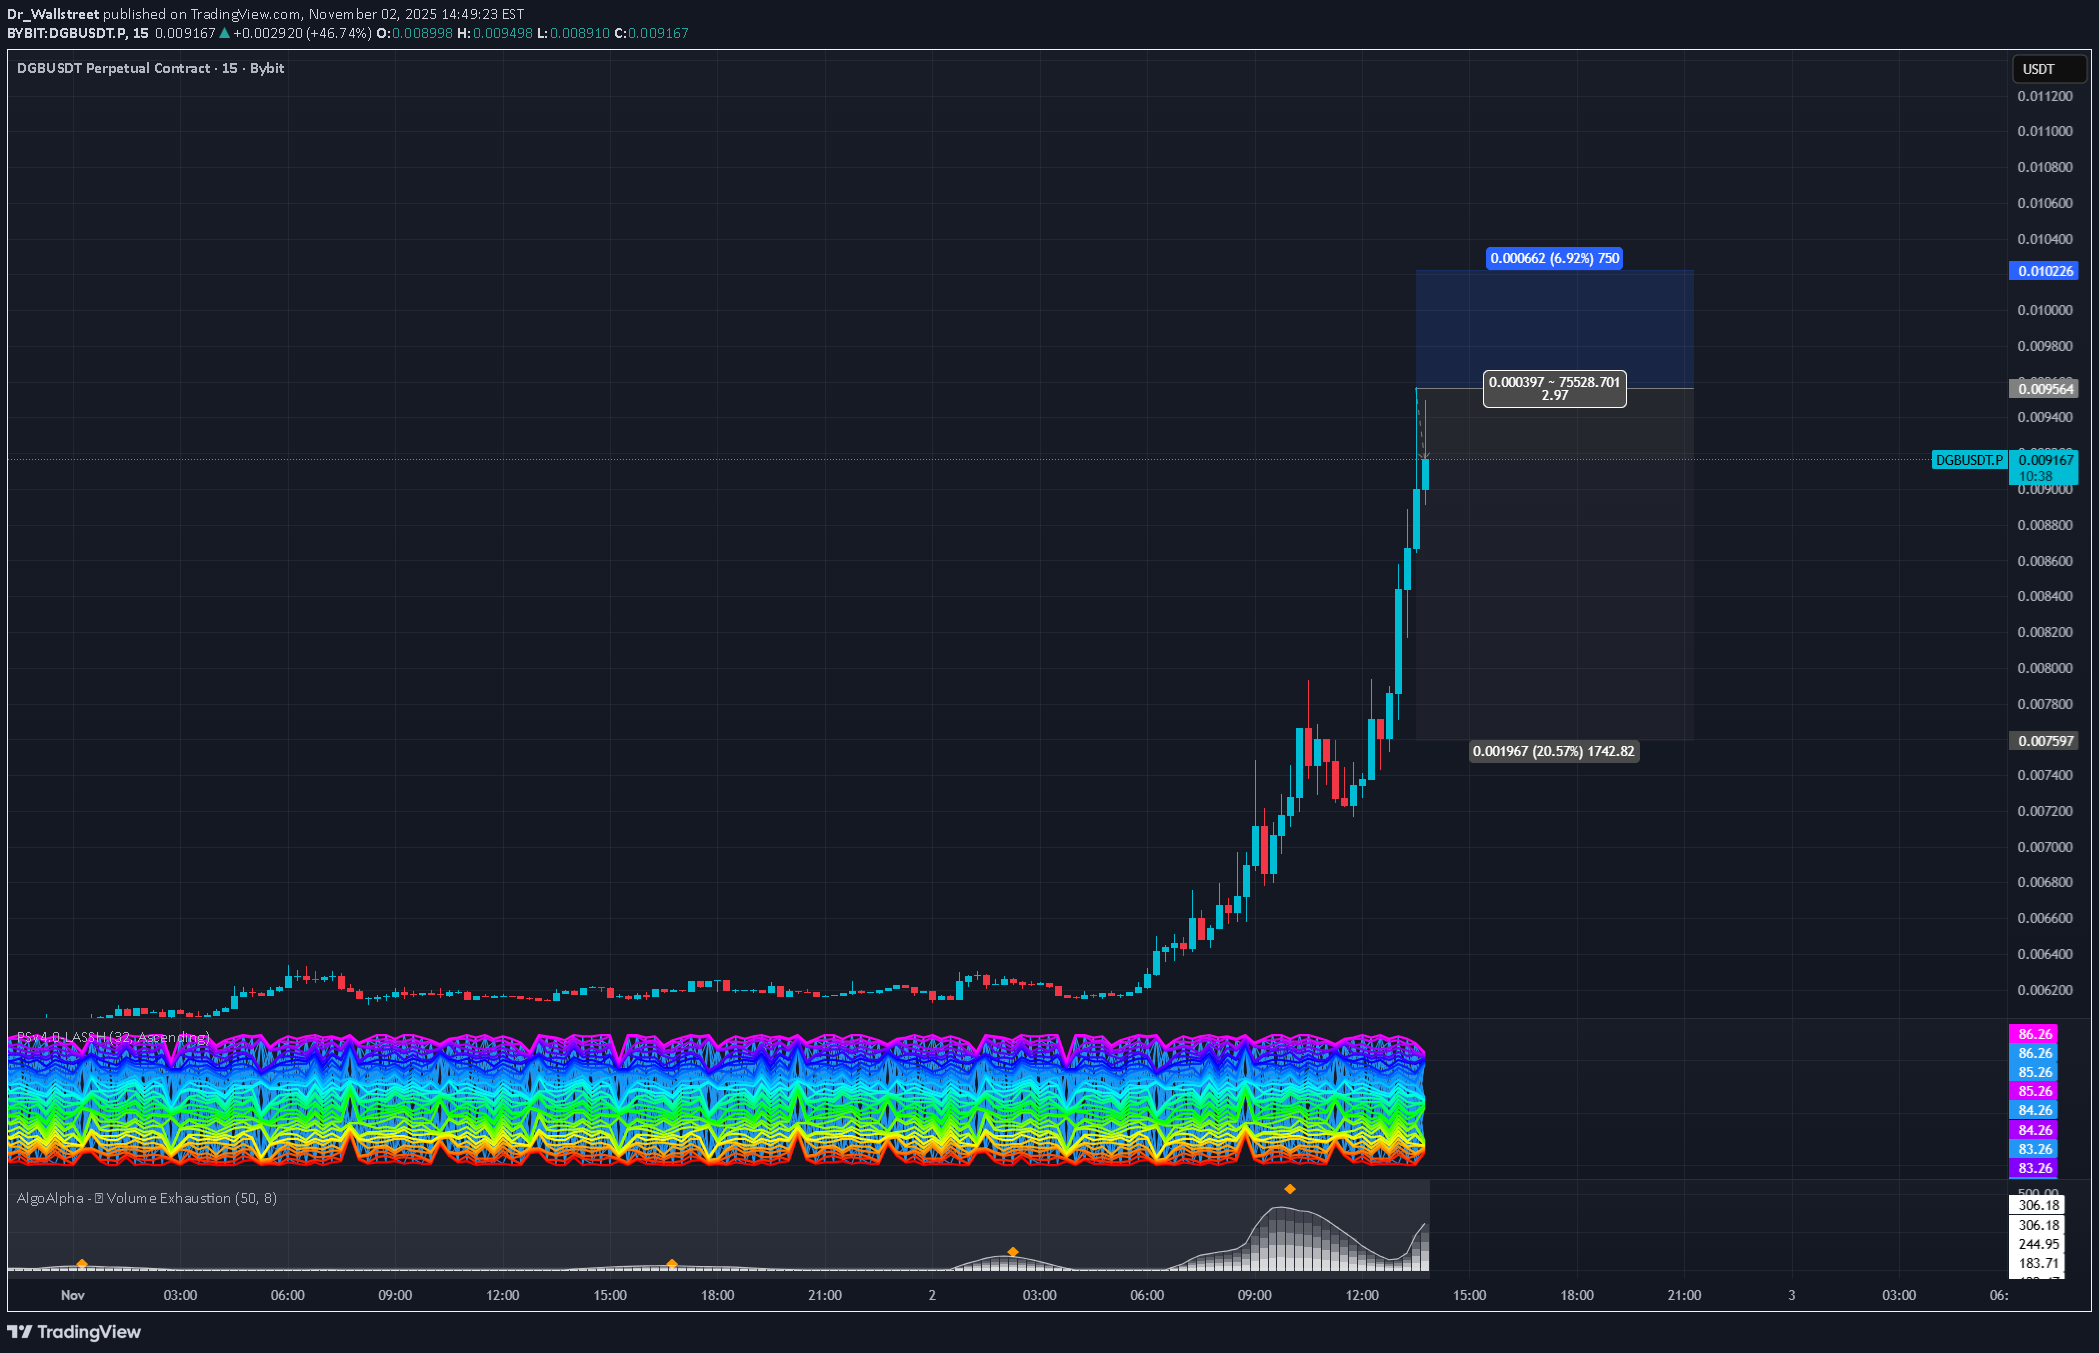
Targeting a 20% move to the downside with no leverage as part of trend system live test.Partial Take profit of 10% hit at 0.008600 and stoploss moved to break even.20% TP target hit and order fully filled.

CryptoNuclear
DGB در نقطه عطف حیاتی: آیا منتظر انفجار صعودی بزرگ هستیم یا پایان انباشت؟
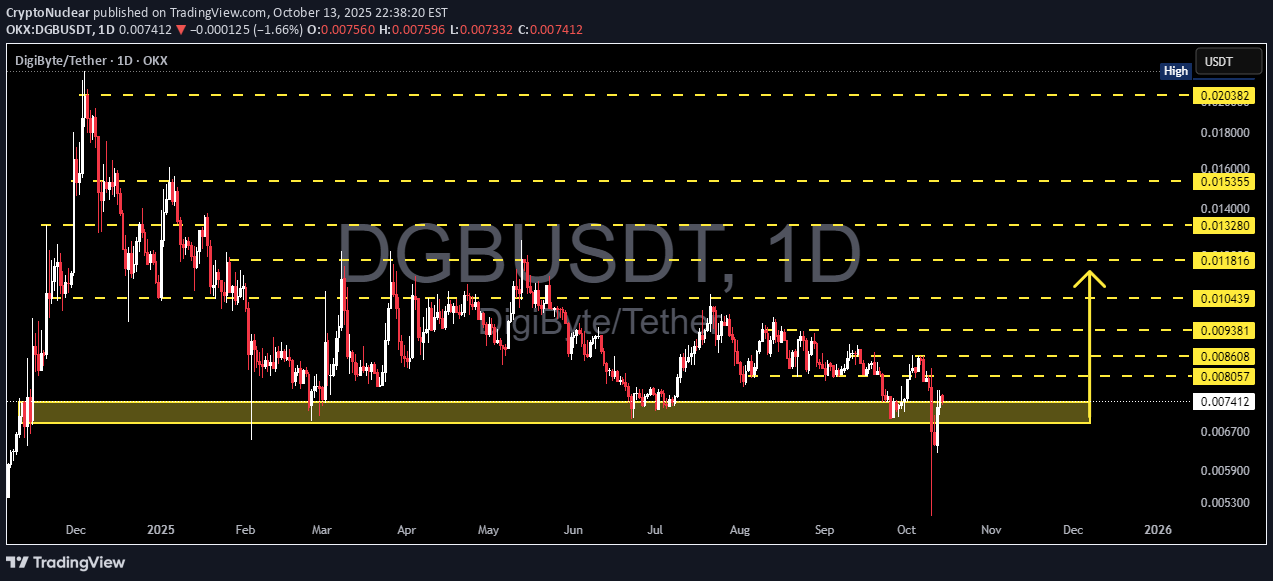
DGB is once again standing at the edge of its most critical demand zone between 0.0070–0.0067 (yellow box). This area has acted as a strong defense level throughout 2025, with each touch previously triggering a solid bullish reaction. However, this time the selling pressure appears more aggressive — with a sharp liquidity sweep below the zone, followed by a quick recovery. This could signal the presence of a potential bear trap or the final shakeout before a reversal. --- Technical Structure Overview Primary pattern: Long-term accumulation range with lower highs and flat support — resembling a descending accumulation structure. Key demand zone: 0.0070–0.0067 Layered resistance levels: 0.0080 • 0.0086 • 0.0094 • 0.0104 • 0.0118 • 0.0133 • 0.0153 • 0.0203 Volume: Still low, suggesting possible stealth accumulation by larger market participants. --- Bullish Scenario – Reversal from the “Capitulation Zone” If DGB manages to hold above this zone and close daily candles above 0.0086 with rising volume, it could mark the beginning of a major multi-week reversal after months of consolidation. Breakout confirmation: Daily close above 0.0086. Short-term targets: 0.0094 → 0.0104 → 0.0118 → 0.0133. Mid-term expansion targets: 0.0153 – 0.0203. Market narrative: A potential bear trap followed by reaccumulation could trigger a sharp short-covering rally. > “A daily close above 0.0086 could ignite a strong bullish reversal phase.” --- Bearish Scenario – Breakdown from Historical Support On the flip side, if price closes daily below 0.0067 without a strong recovery, the historical demand zone officially breaks down — opening room for deeper corrections toward 0.0059 – 0.0053. Breakdown confirmation: Daily close below 0.0067. Downside targets: 0.0059 – 0.0053. Market narrative: A confirmed breakdown would signal the end of the long accumulation phase and the start of a new distribution leg. > “Failure to defend the yellow zone may mark the transition from accumulation to full-scale distribution.” --- Pattern Insight & Sentiment DGB currently sits at a critical crossroads — either the start of a strong bullish reversal or the final stage of breakdown. The deep wick below support hints at liquidity collection, a classic sign often seen before a major trend reversal. Structurally, the setup resembles a Descending Accumulation Pattern, where every new dip attracts fresh buying interest. Still, without a confirmed breakout above 0.0086, bulls remain unconfirmed. --- Strategic Outlook Swing Traders: Wait for a confirmed daily breakout above 0.0086. Accumulative Buyers: Scale entries within 0.0070–0.0067 with a tight stop below 0.0065. Bearish Traders: Short only after a confirmed breakdown and failed retest below 0.0067. #DGB #DigiByte #CryptoAnalysis #PriceAction #TechnicalAnalysis #SupportAndResistance #CryptoTrading #SwingTrade #AccumulationZone #ReversalPattern

marqtz
دیجیبایت (DGB): جواهر پنهانی که میتواند 100 برابر شود؟ (تحلیل تکنیکال)
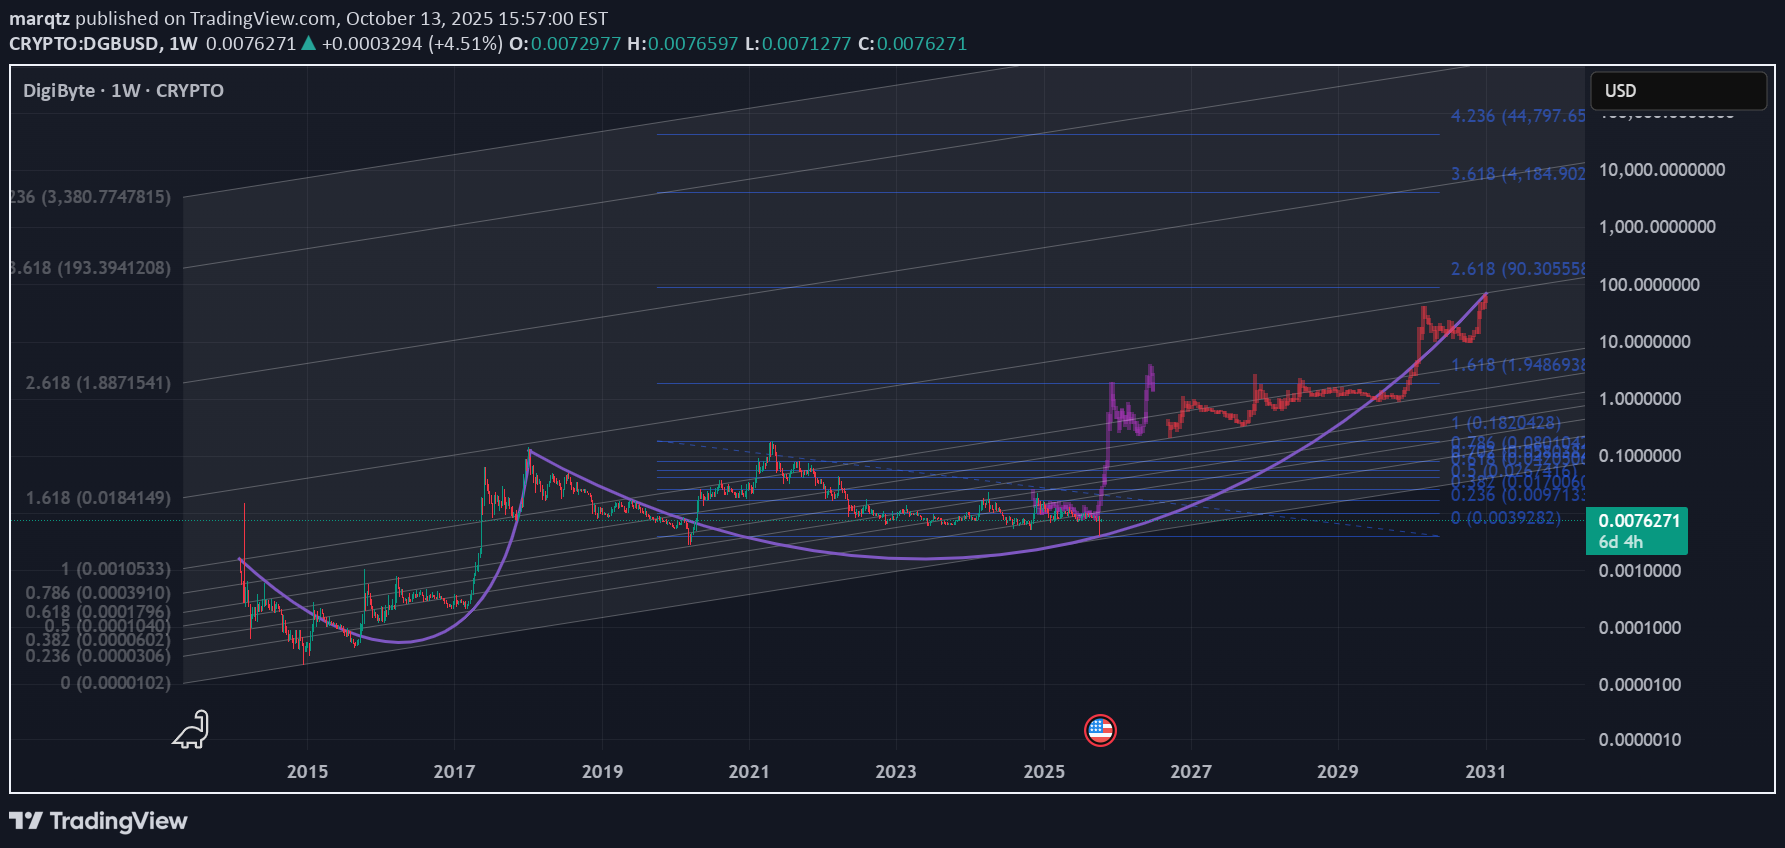
This is an idea based on the DGBUSD chart 1W log using Fibs levels and Bars Patterns. DigiByte is known as the most decentralized coin on the market. Open Source, better tech than Bitcoin, smart contracts, decentralized applications and secure authentication, make DGB a True Gem. Rumors about the incoming DigiDollar stable coin and years of accumulation could skyrocket soon the demand. DigiByte is ready for a 100-200x This is not a financial advice. Do Your Own Research

Zorroreny
DGB آماده جهش بزرگ: راز صعود شبیه به ZEC و رسیدن به ۱۰ دلار!

DGB finished correction and is ready for move up. When looking at pattern we see similar patter as ZEC had before breaking up. I expect similar move with DGB. Note that we have still active target from cup formation we did in 2014-2017 - 1:1 move target is at ca 10$. How to approach DGB - slowly DCA secure profits on important S/R ranges and important fibb levels, it's a longterm play...

Worldofchartsfx
DGB در آستانه جهش بزرگ: آماده انفجار قیمتی با پتانسیل ۵۰ درصد سود؟

consolidating within range from long time, and now testing upper descending trend line, the more trend line will be tested the weaker it will be, there are chances that dgb can break towards upside, in the event of successful breakout, will try to enter with the target of atleast 50%

SatochiTrader

DGB/USDT Trading Update 🔹 Main trend support: DGB is currently holding around its main trend level, showing early signs of stability after a strong correction. We have seen before similar trend 🔄 New cycle forming: A recovery setup is visible, with the market potentially entering a new cycle if momentum continues upward. 🎯 First target: The next significant target lies at $0.0106, aligning with resistance from the previous cycle. 📈 Upside potential: If this cycle gains confirmation, there is a 40% increase potential from current levels, making this a key area to watch. 📌 Summary: DGB is stabilizing at the main trend, showing promising signs of a new cycle activation. If the upward push holds, the first target of $0.0106 could mark a potential 40% increase in price. The previous increase from the start to now until the target took 14 days.Main trend acctivation is not far, there is a high chance after the main trend a breakout possibilityDGB is a coin that can take time. This is the first time in 20 days that volume looks to change for dgb

CryptoWithJames
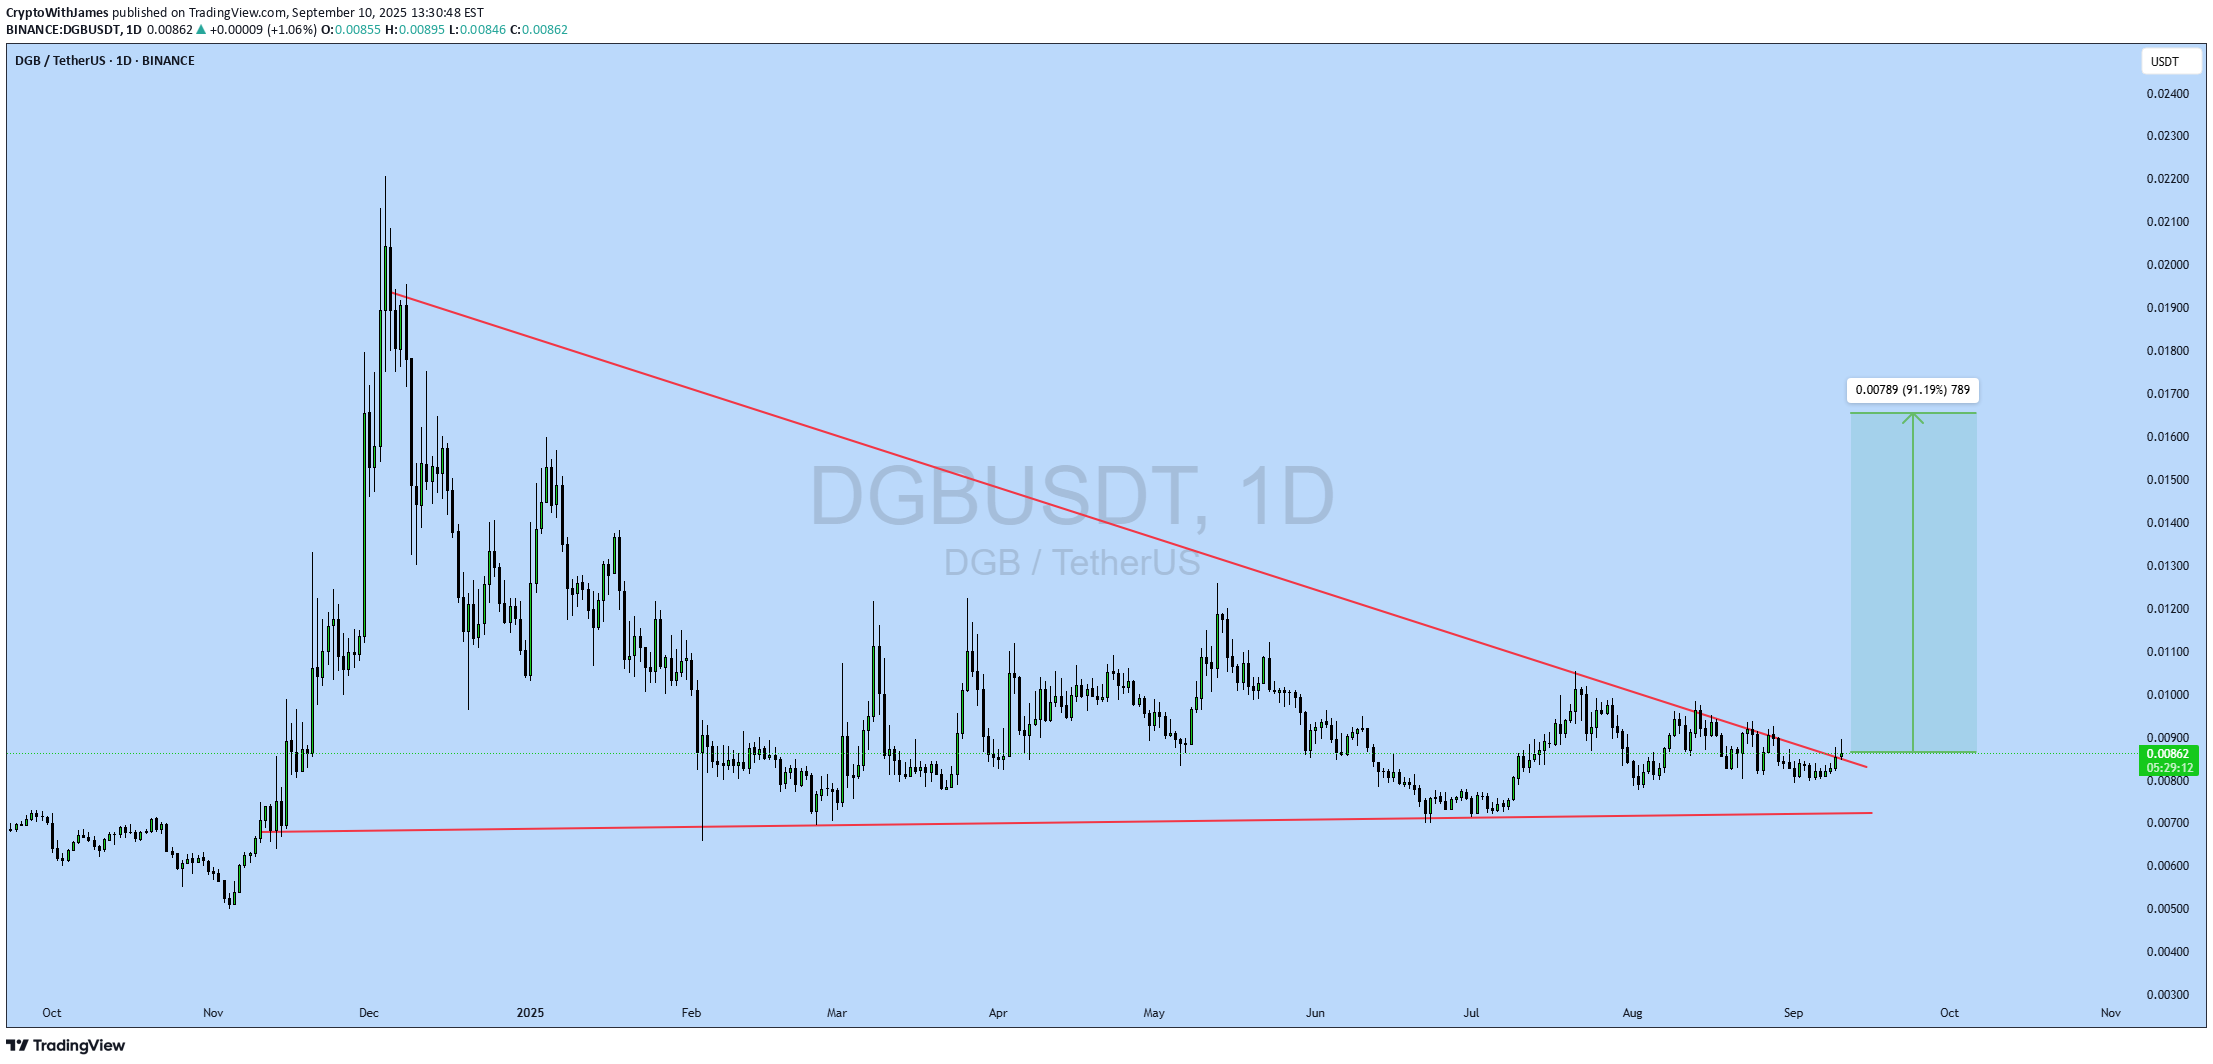
#DGB UPDATE DGB Technical Setup Pattern : Bullish Falling Wedge pattern Current Price: $0.00861 Target Price: $0.0165 Target % Gain: 91.19% Technical Analysis: DGB has broken out of a bullish falling wedge on the 1D chart. The breakout shows strong momentum, with potential to rally toward $0.0165, supported by historical price structure and trendline break confirmation. Time Frame: 1D Risk Management Tip: Always use proper risk management.
CryptoNuclear
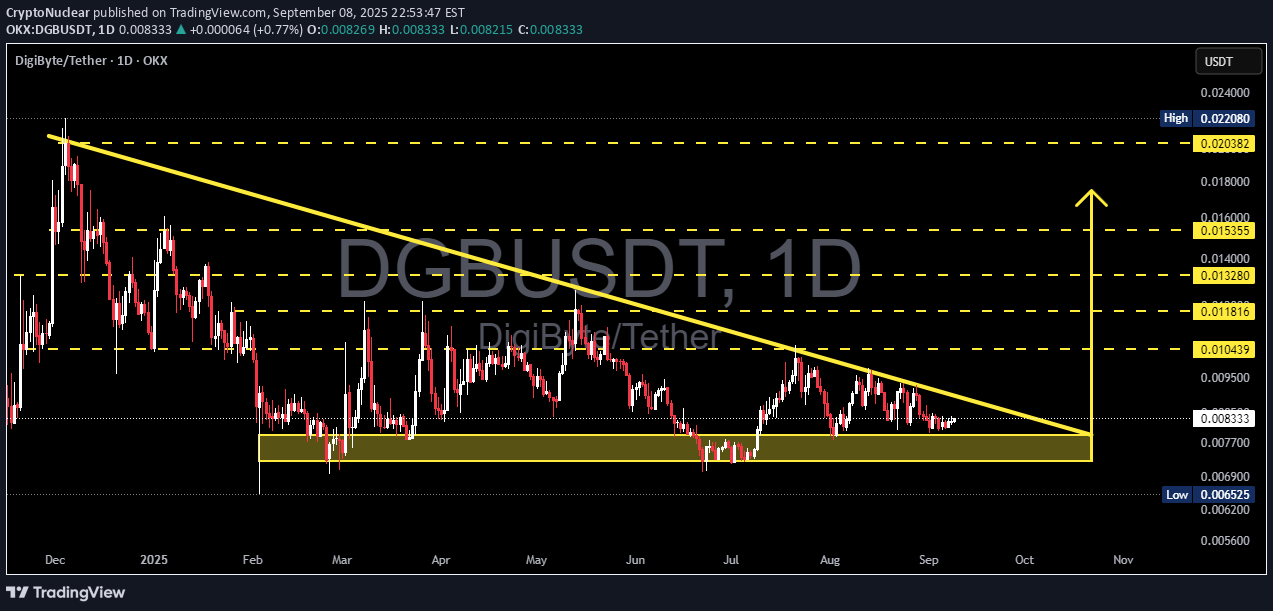
🔎 Technical Overview On the daily chart, DGB/USDT is forming a descending triangle, with a clear downward sloping trendline acting as dynamic resistance and a horizontal demand zone around 0.0065 – 0.0077 USDT providing strong support. This setup reflects a phase of accumulation or distribution, where the market is preparing for a decisive move: either a bullish breakout above the descending trendline or a bearish breakdown below the demand zone. --- 📊 Key Technical Levels Current price: 0.008295 Demand zone (support): 0.0065 – 0.0077 (yellow box) Upside resistance levels: 0.010439 → first breakout confirmation 0.011816 → secondary resistance 0.013280 → mid-term target 0.015355 → extended target 0.020382 & 0.022080 → major upside levels if momentum accelerates --- 🟢 Bullish Scenarios 1. Confirmed Breakout (conservative): If the price manages to close a daily candle above the descending trendline and reclaim 0.010439, bullish momentum is likely to strengthen. Targets: 0.0118 → 0.0132 → 0.0153 Key signals: rising volume, RSI recovery, strong daily green candle. 2. Bounce from Demand (aggressive): If price retests the 0.0065–0.0077 zone and bounces, this area may serve as a strong accumulation point. Stop loss: below 0.0063–0.0065. Initial target: 0.0104, with extensions to higher resistances. Risk-to-reward ratio could be highly favorable if the bounce holds. --- 🔴 Bearish Scenario A daily close below 0.0065 would confirm the descending triangle breakdown. This breakdown could trigger further downside with a target toward 0.0056 or lower. After the breakdown, the 0.0065–0.0077 zone would flip into a supply zone (resistance). --- 📌 Pattern & Sentiment Descending Triangle: traditionally considered a bearish continuation pattern, but in crypto markets, upside breakouts are also possible. Historical Demand Zone: the highlighted yellow box has been tested multiple times since March 2025, making it a key psychological support. Market Sentiment: the reaction around this zone and the ability to break the trendline will dictate the medium-term direction. --- ⚖️ Conclusion & Strategy Bullish play: wait for a breakout above 0.0104 with strong volume (safer) or accumulate cautiously in the demand zone with a tight SL (riskier). Bearish play: a daily close below 0.0065 signals breakdown and opens the door for deeper declines. Risk management: always use stop loss and limit exposure to 1–2% risk per trade. DGB is currently at a make-or-break point. Whether buyers can defend the demand zone or sellers push through support will define the next big move. --- #DGBUSDT #DGB #DigiByte #CryptoAnalysis #TechnicalAnalysis #DescendingTriangle #CryptoTrading #SupportAndResistance #Altcoins

MasterAnanda
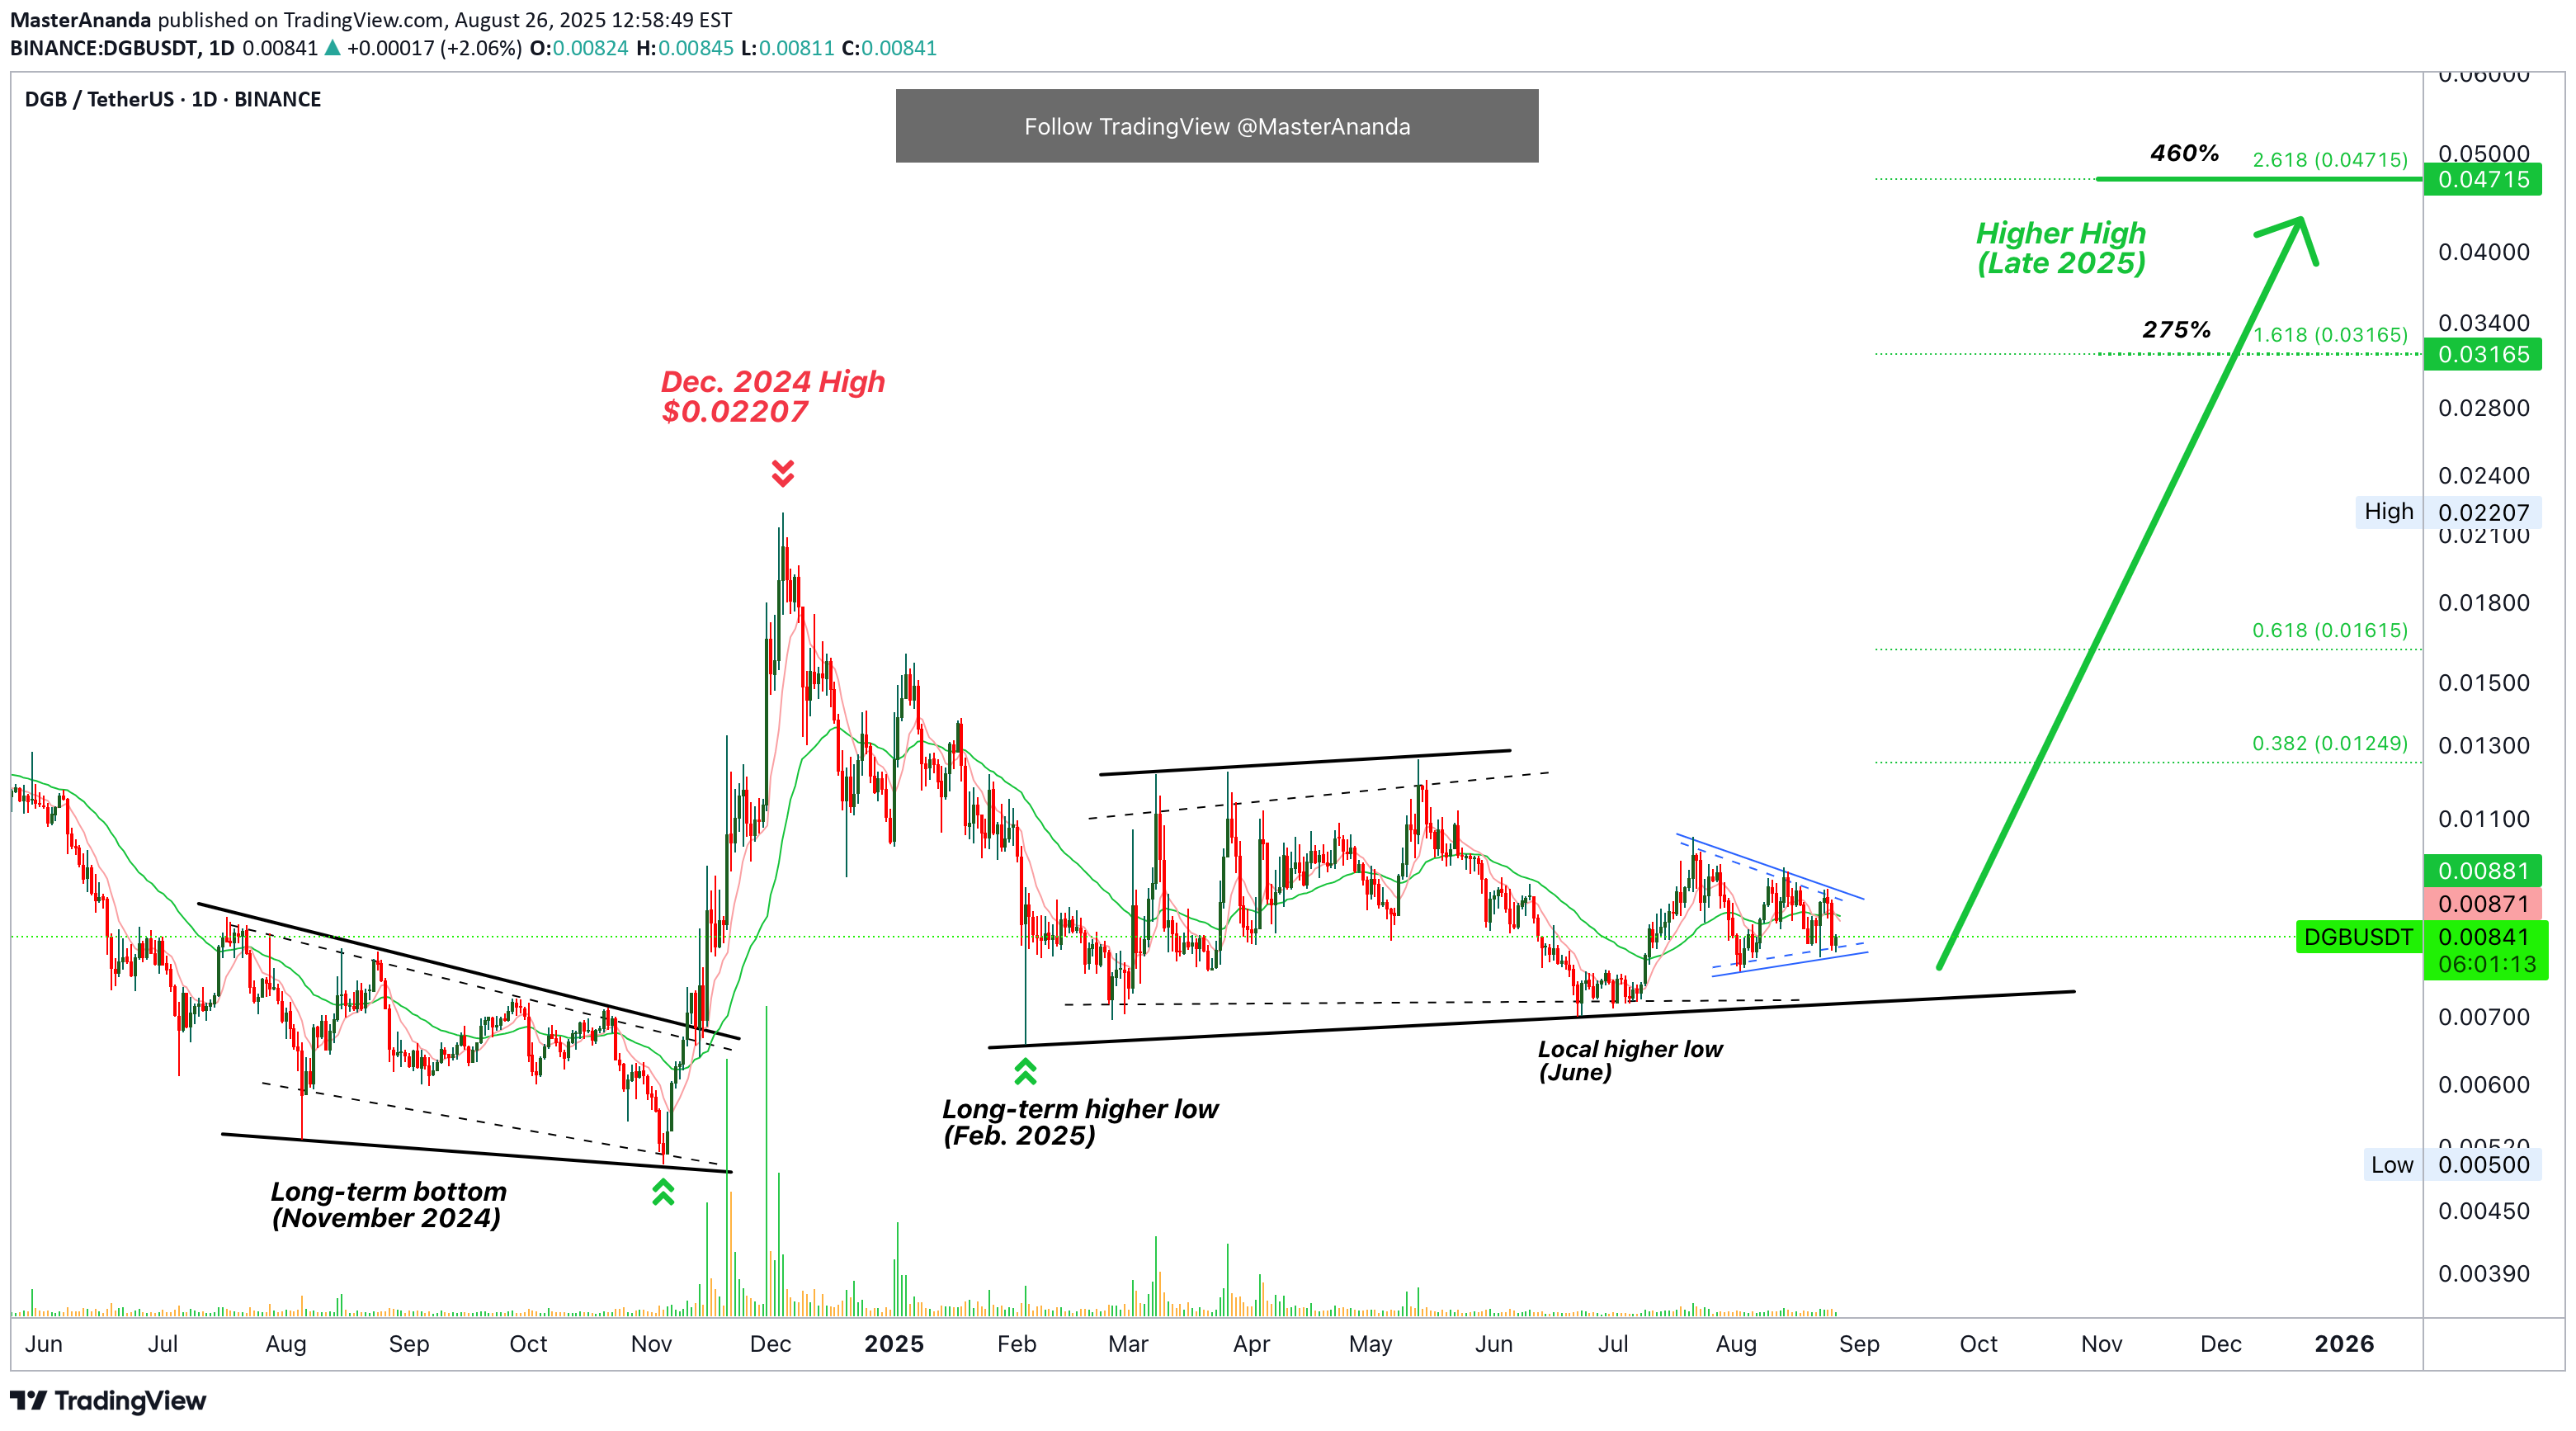
I am looking at DigiByte long-term and this is a standard chart. Dozens of altcoins and hundreds of trading pairs are in a similar situation, a good situation I should say. DGBUSDT is stronger than many because the major low happened in November 2024. All of this 2025 is higher low zone. Long-term higher lows and also short-term and this shows a bullish bias. It means that smart traders always buy when prices are moving close to support. It also reveals that we are going to be seeing strong growth, eventually, now very close. The highest price in December 2024 was 0.02207. This price marked the peak of a 340% rise. The entire move lasted exactly one month. This is the level that will break in the next bullish wave. We have targets short-term, mid-term but also long-term. The short-term target, within one month, 0.01615 opens 90% profits potential. The next target is a major point and the first strong resistance mid-term, 0.03165 for 275%. Mid-term within 30-90 days, three months. 0.04715 is also a mid-term target with 460%. Long-term, there can be more. Here you have the mid-range scenario for DGBUSDT. I will do DGBBTC for you next. Namaste.
MasterAnanda

I will explain everything. The technical analysis, why I believe DigiByte can grow beyond 2,700%, and the overall Cryptocurrency market conditions. Good evening my fellow Cryptocurrency trader, I hope you are having a wonderful day. First, let me tell you that DigiByte (DGBUSDT) is fully bullish confirmed based on technical analysis. In simple terms, the action is happening above EMA55 weekly and we have higher lows since November 2024 and three weeks closing green. Since there are now new lows in 2025, this clearly shows a lack of bearish trend. There is no bearish trend but neither a bullish trend, the market has been sideways. DigiByte has been sideways now for 1,169 days. And this is the reason why a new all-time high is possible in this year and bullish cycle. This is simply the strongest consolidation phase ever in the history of this market. A 1,044% target at $0.116 is very easy indeed and should be hit without a question. But the fact that the market has been neutral for so long opens the doors for a massive bullish cycle and this is why we are aiming higher. Just as a new all-time lows can be hit within a bearish period, new all-time highs can be hit within a bullish cycle. Consider $0.29 or higher. Just consider inflation, how much the world changed in the past four years. All the advances when it comes to regulations and acceptance towards this market. A new all-time high is only logical and easy to conceive. It is also supported by market sentiment, marketwide action and technical analysis. DigiByte will not stay behind. It will surely perform just as you expect or even beyond. The Cryptocurrency market tends to surprise, it always go beyond our expectations. Thanks a lot for your continued support. Namaste.
Disclaimer
Any content and materials included in Sahmeto's website and official communication channels are a compilation of personal opinions and analyses and are not binding. They do not constitute any recommendation for buying, selling, entering or exiting the stock market and cryptocurrency market. Also, all news and analyses included in the website and channels are merely republished information from official and unofficial domestic and foreign sources, and it is obvious that users of the said content are responsible for following up and ensuring the authenticity and accuracy of the materials. Therefore, while disclaiming responsibility, it is declared that the responsibility for any decision-making, action, and potential profit and loss in the capital market and cryptocurrency market lies with the trader.