
DEXE
DeXe
| تریدر | نوع سیگنال | حد سود/ضرر | زمان انتشار | مشاهده پیام |
|---|---|---|---|---|
 Alpha-GoldFXRank: 32441 | خرید | حد سود: تعیین نشده حد ضرر: تعیین نشده | 12/19/2025 |
Price Chart of DeXe
سود 3 Months :
سیگنالهای DeXe
Filter
Sort messages by
Trader Type
Time Frame
Alpha-GoldFX
DEXEUSDT Forming Falling Wedge

DEXEUSDT is forming a clear falling wedge pattern, a classic bullish reversal signal that often indicates an upcoming breakout. The price has been consolidating within a narrowing range, suggesting that selling pressure is weakening while buyers are beginning to regain control. With consistent volume confirming accumulation at lower levels, the setup hints at a potential bullish breakout soon. The projected move could lead to an impressive gain of around 190% to 200% once the price breaks above the wedge resistance. This falling wedge pattern is typically seen at the end of downtrends or corrective phases, and it represents a potential shift in market sentiment from bearish to bullish. Traders closely watching DEXEUSDT are noting the strengthening momentum as it nears a breakout zone. The good trading volume adds confidence to this pattern, showing that market participants are positioning early in anticipation of a reversal. Investors’ growing interest in DEXEUSDT reflects rising confidence in the project’s long-term fundamentals and current technical strength. If the breakout confirms with sustained volume, this could mark the start of a fresh bullish leg. Traders might find this a valuable setup for medium-term gains, especially as the wedge pattern completes and buying momentum accelerates. ✅ Show your support by hitting the like button and ✅ Leaving a comment below! (What is your opinion about this Coin?) Your feedback and engagement keep me inspired to share more insightful market analysis with you!

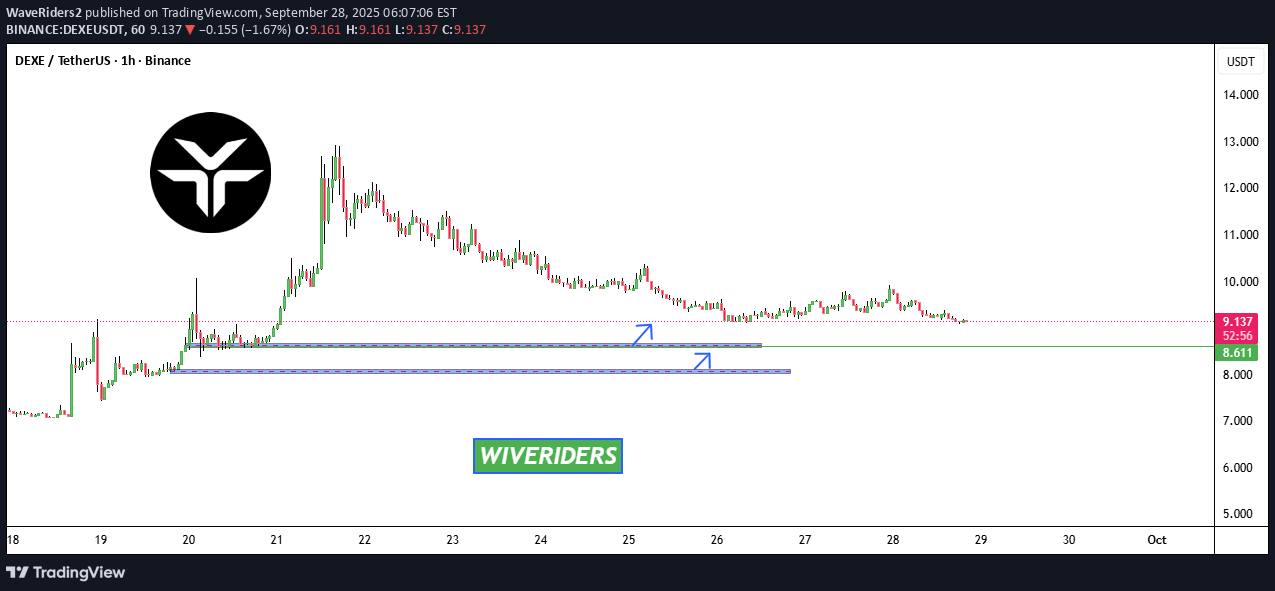
WaveRiders2


sladkamala123
روند صعودی دِکس (DEX) و تتر (USDT): آینده این ارزهای دیجیتال چه میشود؟

It"s interesting for future growth. The trend is clear. We"ll see where it goes.
WaveRiders2
WaveRiders2


CryptoNuclear
DEXE/USDT — Demand Zone Retest: Bullish Reversal or Breakdown?
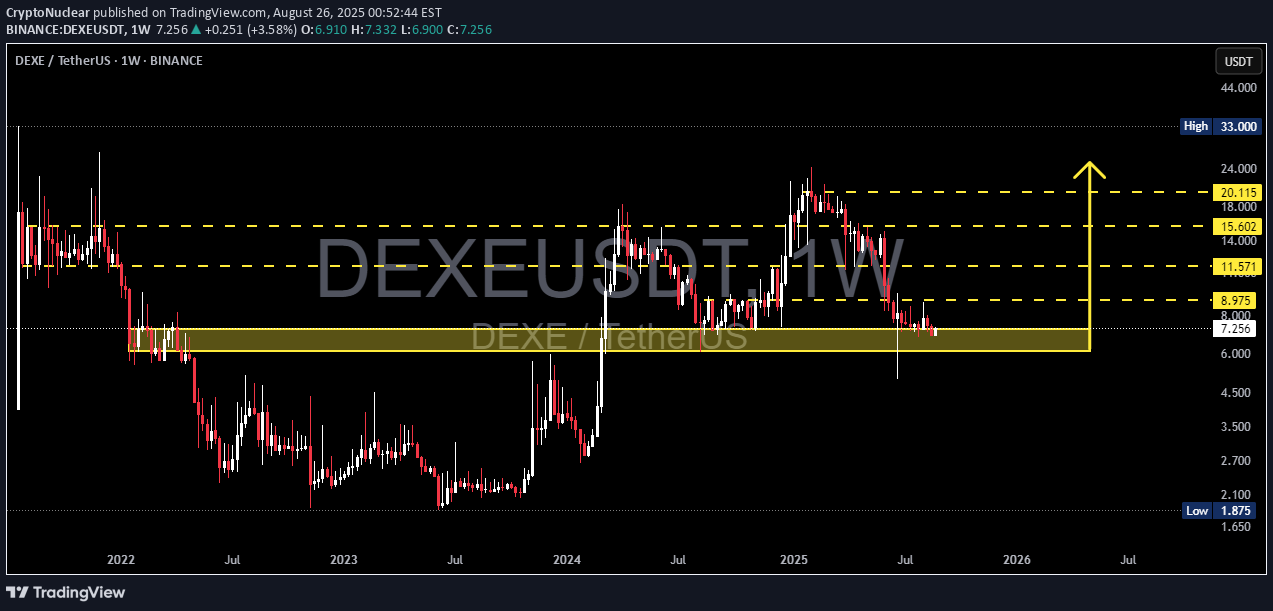
🔎 Overview DEXE/USDT is currently retesting the weekly demand zone ($6–8) which has historically acted as a strong accumulation area during 2022–2023. After a massive rally in 2024 followed by a strong correction in early 2025, price has formed a series of lower highs, showing clear selling pressure from smart money. Now, the market is at a critical juncture: will this demand zone hold and spark a new bullish phase, or will it break down and send price back toward historical lows? --- 📌 Market Structure & Pattern Macro trend: still bearish since the 2021 peak, despite a relief rally in 2024. Current structure: a sequence of lower highs, signaling sellers remain in control. Demand zone $6–8: a major support zone that has served as an institutional accumulation area before. False break wick below the zone, quickly reclaimed → typical sign of liquidity grab/shakeout before potential reversal. --- 🚀 Bullish Scenario 1. Confirmation: Weekly close above $8.975 → strong sign that buyers are regaining control. 2. Upside targets (layered resistances): $11.571 → first target (minor supply test). $15.602 → mid-term target, partial profit zone. $20.115 → major bullish target if momentum extends. 3. Entry strategies: Conservative: Wait for a confirmed close > $8.975. Aggressive: Accumulate gradually within $6–8 with a stop below the zone. 4. Market psychology: This area often represents smart money re-entry after stop-hunting retail traders. --- 🔻 Bearish Scenario 1. Confirmation: Weekly close below $6.0 → demand zone failure. 2. Downside potential: Breakdown would open room toward lower support areas ($4.5 → $3.0 → even $1.8). 3. Strategy: Exit longs if weekly closes below $6.0. Shorts only for experienced traders due to limited liquidity. 4. Market psychology: A breakdown of this demand zone would trigger panic selling and shift sentiment heavily bearish. --- 🎯 Conclusion DEXE/USDT is standing at a golden decision point that will define its mid-term direction: If held → potential bullish rally toward $11–20+. If broken → high risk of continuation down toward sub-$5 levels. This is a high-risk, high-reward zone: the opportunity is big, but false breaks are common. Risk management is key. --- 📌 Trading Notes Always use weekly close for confirmation, not just wicks. Keep risk per trade < 3% of total capital. Monitor BTC/ETH correlation as it strongly impacts altcoins. #DEXE #DEXEUSDT #Crypto #Altcoins #TechnicalAnalysis #PriceAction #SupportResistance #SwingTrading #CryptoAnalysis

BeInCrypto
DEXE — Bullish Ichimoku Breakout Signals Uptrend Continuation

DEXE’s recent double-digit rally has propelled its price above the Ichimoku Cloud, a key indicator of trend strength and momentum. With this breakout, the token is now trading above both Leading Span A (green) and Span B (yellow), signaling a potential shift into a sustained bullish phase. At the time of writing, Span A and Span B have flipped into dynamic support levels at $7.74 and $7.21, respectively. These levels are now crucial floors to watch in the coming sessions. Holding above the Cloud typically reflects strong positive sentiment and suggests further upside potential as long as price maintains this structure.

vagada
DEXE: Bounce + RSI Divergence + DeFi Strength
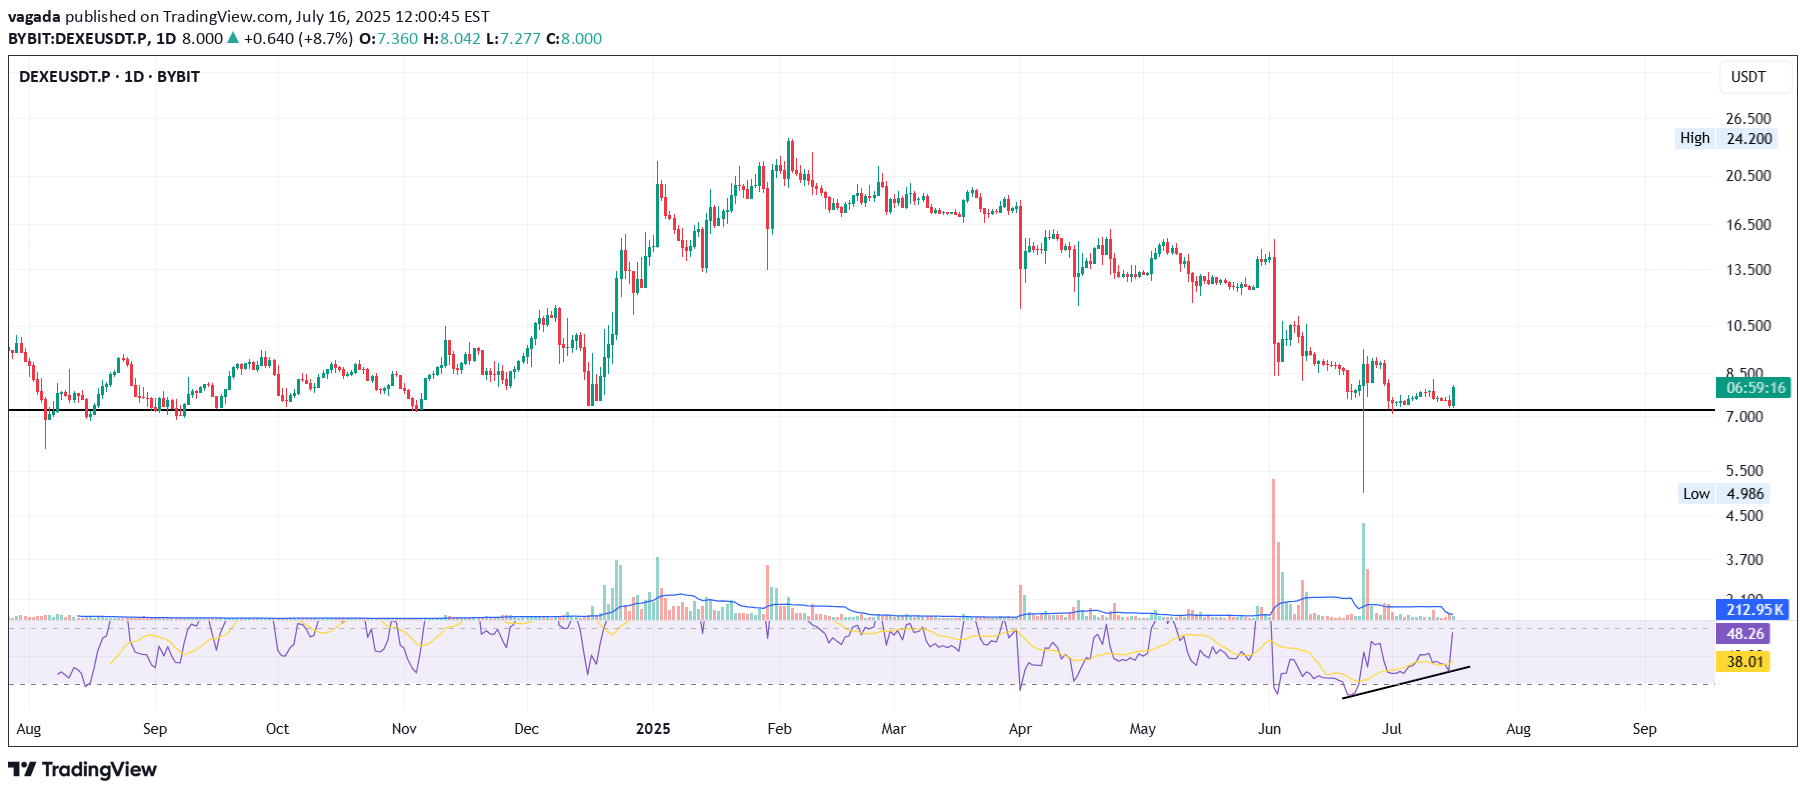
DEXE on the daily just bounced off an 11-month-old support - the key black line. A strong bullish divergence on the RSI has been building for over a month — now confirming with momentum. That long green wick under support? It’s signalling buyer interest and possible accumulation. Fundamentals: DEXE powers decentralized governance (DAO) with AI + DeFi alignment. It enables transparent on-chain decision-making and sustainable DAO growth. Backed by real partnerships, aiming for fair, merit-based participation. I’m long: not financial advice. Always take profits and manage risk. Interaction is welcome.DEXE just surprised me — I hadn’t noticed the 0.786 Fib level acting as resistance. So now, price may be trapped between that resistance and the black line below as support. One of them will eventually break. We’ll be here to watch it unfold.

CryptoAnalystSignal
#DEXE/USDT

#DEXE The price is moving within a channel on the 1-hour frame, adhering well to it, and is heading for a strong breakout and retest. We have a bounce from the lower boundary of the channel, this support at 8.93. We have a downtrend on the RSI indicator that is about to be broken and retested, which supports the upward trend. We have a trend of consolidation above the 100 moving average. Entry price: 9.30 First target: 9.60 Second target: 10.14 Third target: 10.65#DEXE First target: 9.60 Reached Second target: 10.14 Reached Third target: 10.65 Reached

CoreCrypto1
DEXE/USDT: FALLING WEDGE BREAKOUT!!

DEXE Breakout Alert – 80% Move Loading?Hey Traders! If you're into high-conviction plays and real alpha — hit that like and tap Follow for trade setups that actually deliver.DEXE has broken out of a falling wedge pattern on the daily timeframe and has successfully retested the breakout level. The structure looks strong, and momentum is starting to build.Entry Zone: $13.4 – $14.4Targets: $16.1 / $18.2 / $21.2 / $24.4Stop-loss: $12.60Leverage: Use low leverage (Max 5x)This could be the beginning of a powerful upward move.Keep this setup on your radar and manage risk accordingly.Let me know your thoughts or if you're riding this one too.
Disclaimer
Any content and materials included in Sahmeto's website and official communication channels are a compilation of personal opinions and analyses and are not binding. They do not constitute any recommendation for buying, selling, entering or exiting the stock market and cryptocurrency market. Also, all news and analyses included in the website and channels are merely republished information from official and unofficial domestic and foreign sources, and it is obvious that users of the said content are responsible for following up and ensuring the authenticity and accuracy of the materials. Therefore, while disclaiming responsibility, it is declared that the responsibility for any decision-making, action, and potential profit and loss in the capital market and cryptocurrency market lies with the trader.