
DEGO
Dego Finance
| تریدر | نوع سیگنال | حد سود/ضرر | زمان انتشار | مشاهده پیام |
|---|---|---|---|---|
 CryptoAnalystSignalRank: 30933 | خرید | حد سود: تعیین نشده حد ضرر: تعیین نشده | 12/15/2025 |
Price Chart of Dego Finance
سود 3 Months :
سیگنالهای Dego Finance
Filter
Sort messages by
Trader Type
Time Frame
CryptoAnalystSignal
تحلیل DEGO/USDT: سیگنال قوی صعودی در تایم فریم 1 ساعته - آماده جهش بزرگ؟
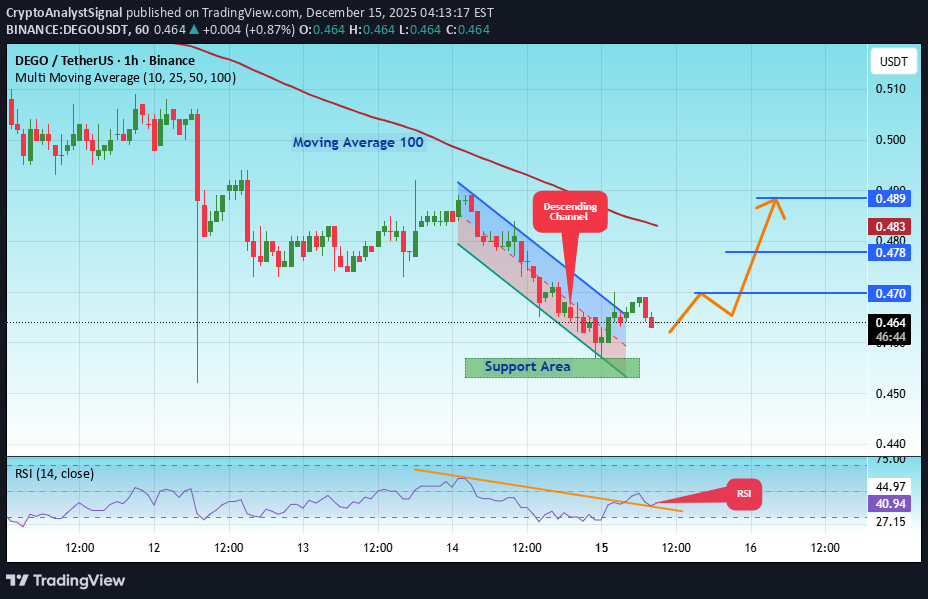
#DEGO The price is moving in a descending channel on the 1-hour timeframe. It has reached the lower boundary and is heading towards breaking above it, with a retest of the upper boundary expected. We have a downtrend on the RSI indicator, which has reached near the lower boundary, and an upward rebound is expected. There is a key support zone in green at 0.455. The price has bounced from this zone multiple times and is expected to bounce again. We have a trend towards stability above the 100-period moving average, as we are moving close to it, which supports the upward movement. Entry price: 0.464 First target: 0.470 Second target: 0.478 Third target: 0.489 Don't forget a simple principle: money management. Place your stop-loss order below the support zone in green. For any questions, please leave a comment. Thank you.
CryptoAnalystSignal
#DEGO/USDT – Bullish Breakout Setup | 1H Chart Analys
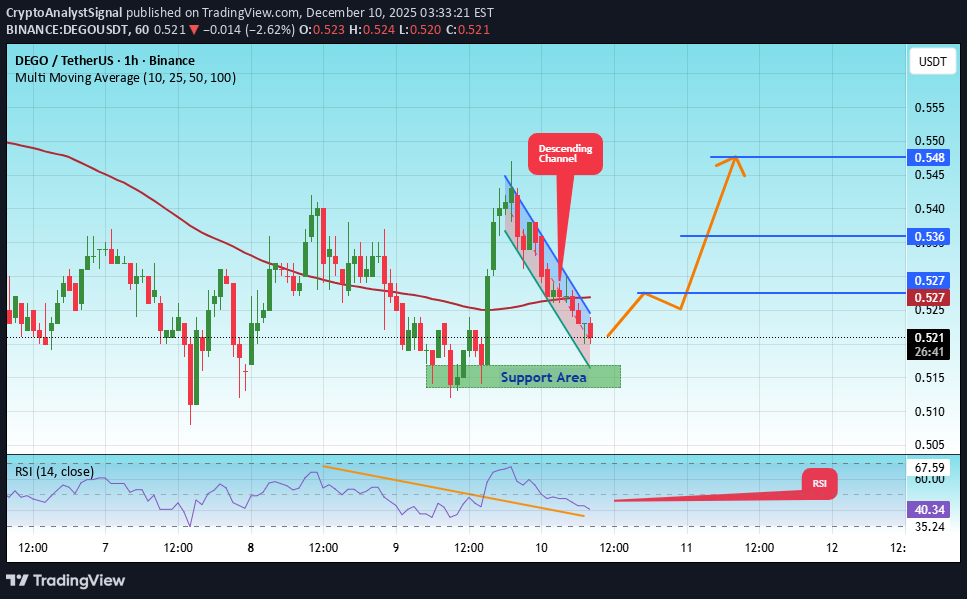
#DEGO The price is moving in a descending channel on the 1-hour timeframe. It has reached the lower boundary and is heading towards breaking above it, with a retest of the upper boundary expected. We have a downtrend on the RSI indicator, which has reached near the lower boundary, and an upward rebound is expected. There is a key support zone in green at 0.515. The price has bounced from this zone multiple times and is expected to bounce again. We have a trend towards consolidation above the 100-period moving average, as we are moving close to it, which supports the upward movement. Entry price: 0.515 First target: 0.527 Second target: 0.536 Third target: 0.548 Don't forget a simple principle: money management. Place your stop-loss below the green support zone. For any questions, please leave a comment. Thank you.
CryptoAnalystSignal
تحلیل تکنیکال DEGO/USDT: سیگنال ورود به پامپ پس از شکست کانال نزولی!
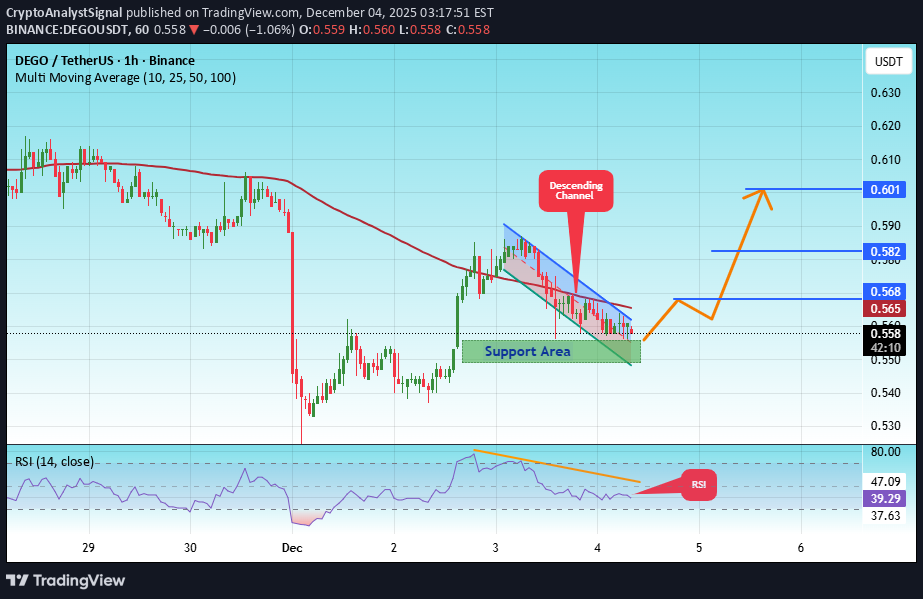
#DEGO The price is moving in a descending channel on the 1-hour timeframe. It has reached the lower boundary and is heading towards breaking above it, with a retest of the upper boundary expected. We have a downtrend on the RSI indicator, which has reached near the lower boundary, and an upward rebound is expected. There is a key support zone in green at 0.550. The price has bounced from this zone multiple times and is expected to bounce again. We have a trend towards stability above the 100-period moving average, as we are moving close to it, which supports the upward movement. Entry price: 0.558 First target: 0.568 Second target: 0.582 Third target: 0.601 Don't forget a simple principle: money management. Place your stop-loss below the support zone in green. For any questions, please leave a comment. Thank you.
CryptoAnalystSignal
تحلیل نمودار DEGO/USDT: آمادهسازی برای انفجار صعودی بزرگ!
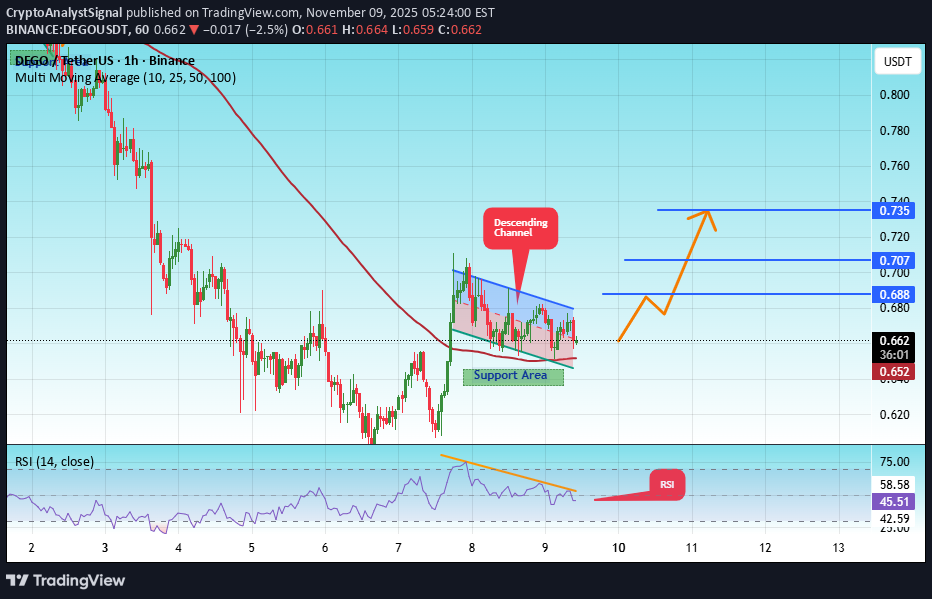
#DEGO The price is moving within an ascending channel on the 1-hour timeframe and is adhering to it well. It is poised to break out strongly and retest the channel. We have a downtrend line on the RSI indicator that is about to break and retest, which supports the upward move. There is a key support zone in green at the 0.640 price level, representing a strong support point. We have a trend of consolidation above the 100-period moving average. Entry price: 0.660 First target: 0.688 Second target: 0.707 Third target: 0.735 Don't forget a simple money management rule: Place your stop-loss order below the green support zone. Once you reach the first target, save some money and then change your stop-loss order to an entry order. For any questions, please leave a comment. Thank you.#DEGO First target: 0.688 Reached Second target: 0.707 Reached
CryptoAnalystSignal
سیگنال خرید DEGO: ورود به موج صعودی کانال موازی با اهداف جذاب!
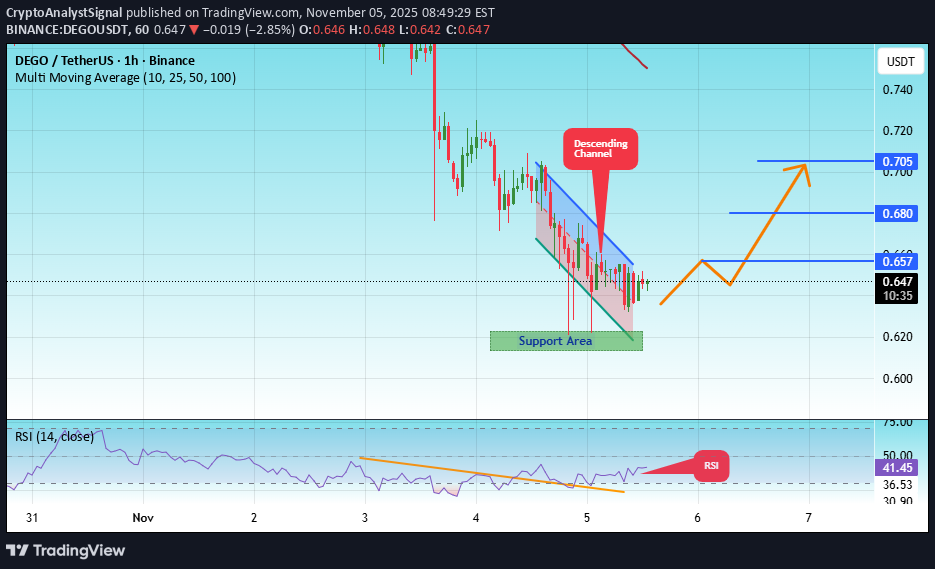
#DEGO The price is moving within an ascending channel on the 1-hour timeframe and is adhering to it well. It is poised to break out strongly and retest the channel. We have a downtrend line on the RSI indicator that is about to break and retest, which supports the upward move. There is a key support zone in green at the price of 0.618, representing a strong support point. We have a trend of consolidation above the 100-period moving average. Entry price: 0.645 First target: 0.657 Second target: 0.680 Third target: 0.705 Don't forget a simple money management rule: Place your stop-loss order below the green support zone. Once the first target is reached, save some money and then change your stop-loss order to an entry order. For any questions, please leave a comment. Thank you.#DEGO First target: 0.657 Reached Second target: 0.680 Reached Third target: 0.705 Reached
CryptoAnalystSignal
سیگنال خرید داغ DEGO/USDT: آماده انفجار صعودی در کانال موازی!
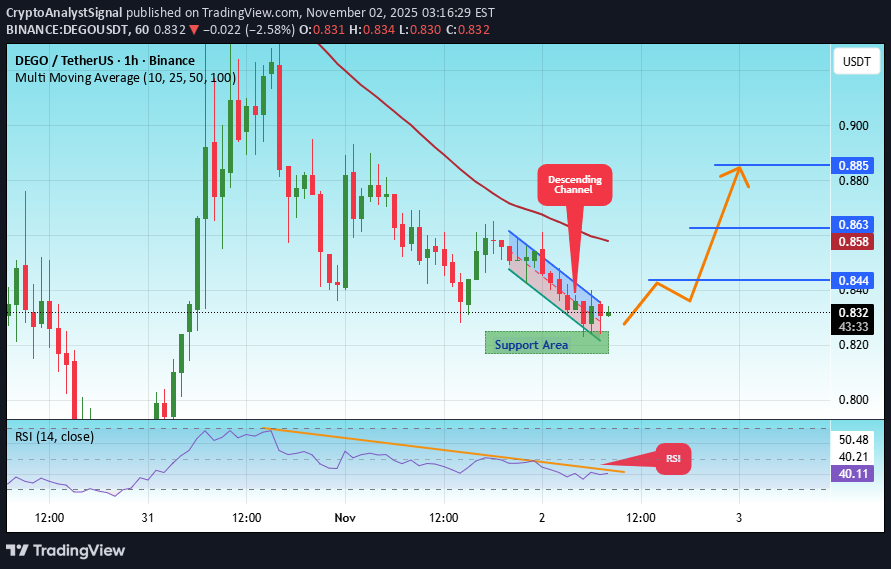
#DEGO The price is moving within an ascending channel on the 1-hour timeframe and is adhering to it well. It is poised to break out strongly and retest the channel. We have a downtrend line on the RSI indicator that is about to break and retest, which supports the upward move. There is a key support zone in green at the price of 0.822, representing a strong support point. We have a trend of consolidation above the 100-period moving average. Entry price: 0.831 First target: 0.844 Second target: 0.863 Third target: 0.885 Don't forget a simple money management rule: Place your stop-loss order below the support zone in green. Once the first target is reached, save some money and then change your stop-loss order to an entry order. For any questions, please leave a comment. Thank you.

Cryptojobs
سیگنال صعودی قوی: آیا قیمت $DEGO به اوج میرسد؟ (+20% رشد در راه است!)
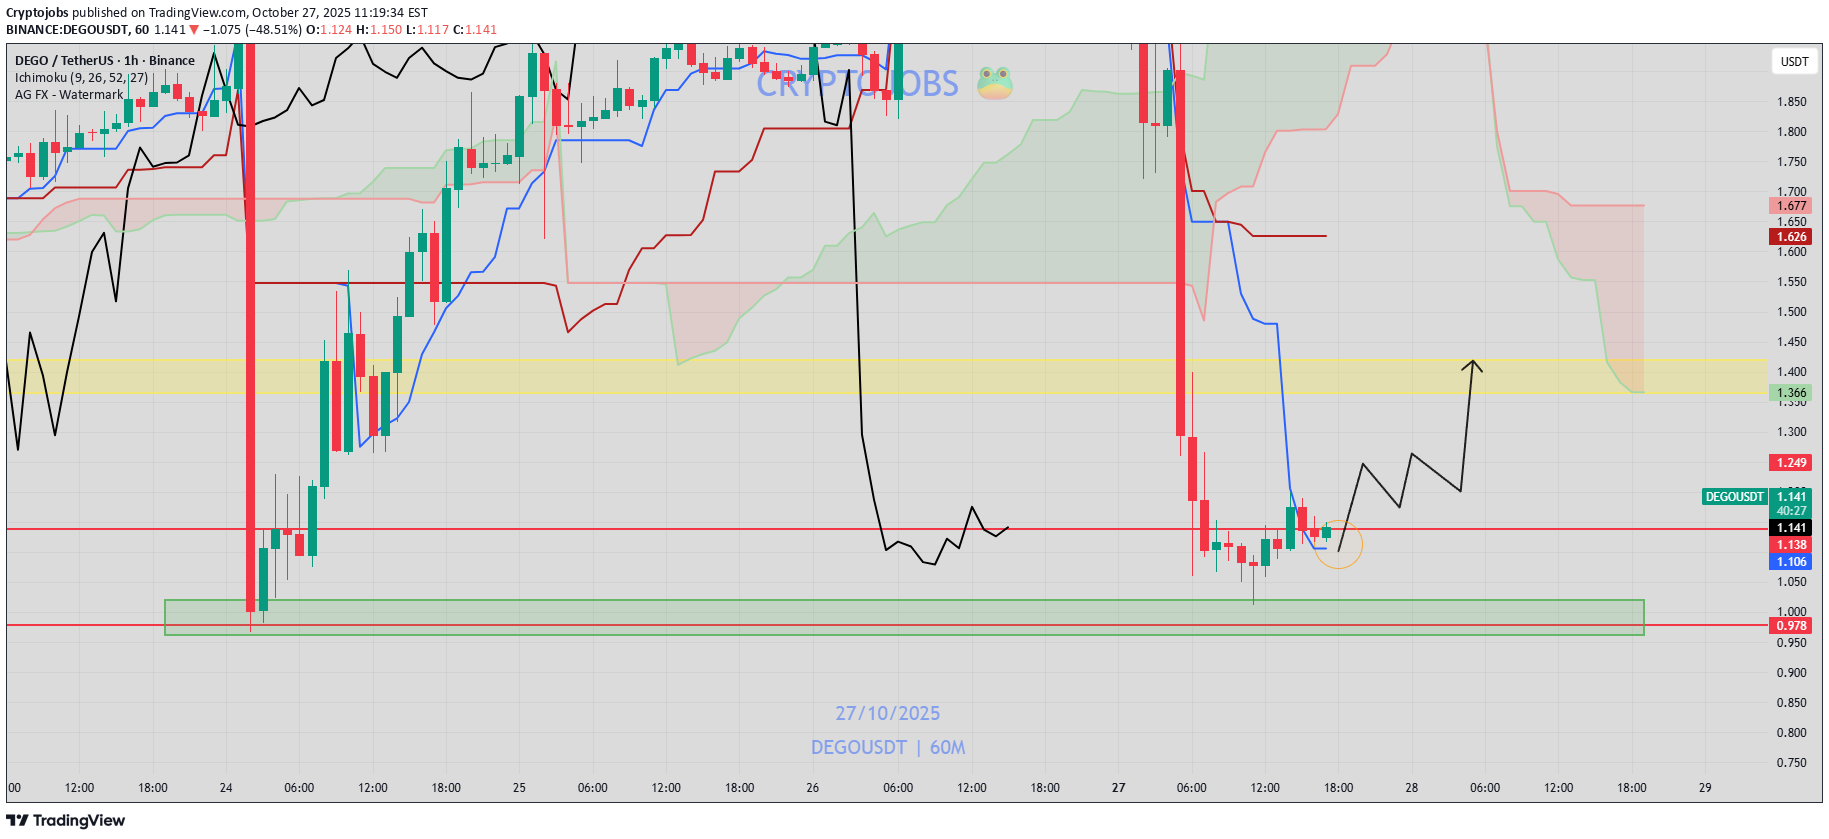
$DEGO looks bottomed here 📈 We can expect to see 15 - 20%+ bull correction.
CryptoAnalystSignal
موج صعودی DEGO/USDT: فرصت خرید با اهداف بزرگ (آماده شکست خط روند نزولی RSI)
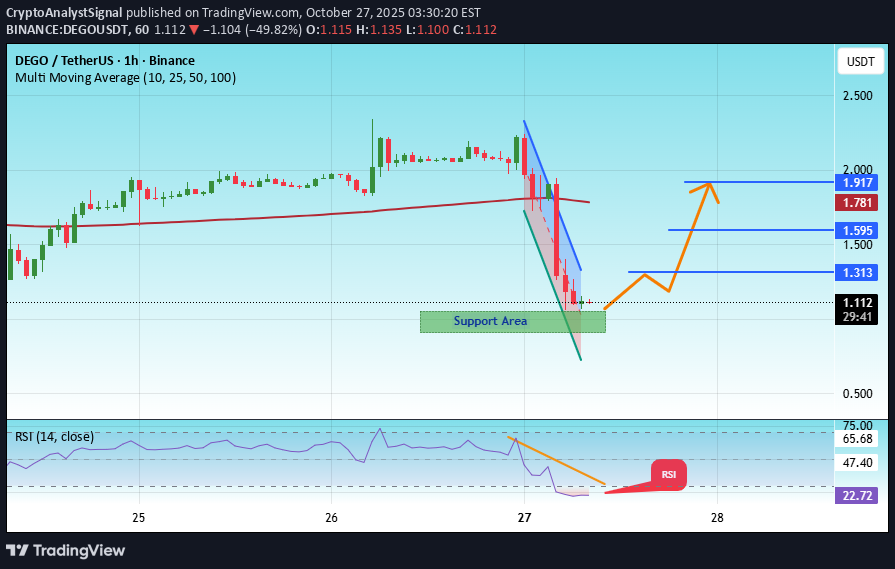
#DEGO The price is moving in an ascending channel on the 1-hour frame, adhering well to it, and heading for a strong breakout and retest. We have a bearish trend on the RSI indicator that is about to be broken and retested, which supports the upward breakout. There is a major support area in green at 0.985, representing a strong support point. We are heading for consolidation above the 100 moving average. Entry price: 1.12. First target: 1.313. Second target: 1.595. Third target: 1.917. Don't forget a simple matter: capital management. When you reach the first target, save some money and then change your stop-loss order to an entry order. For inquiries, please leave a comment. Thank you.
CryptoAnalystSignal
سیگنال صعودی قوی دیگو (DEGO): آماده شکست کانال نزولی با اهداف جدید!

#DEGO The price is moving within a descending channel on the 1-hour frame, adhering well to it, and heading for a strong breakout and retest. We have a bearish trend on the RSI indicator that is about to be broken and retested, which supports the upward breakout. There is a major support area in green at 1.030, representing a strong support point. We are heading for consolidation above the 100 moving average. Entry price: 1.10. First target: 1.137. Second target: 1.18. Third target: 1.240. Don't forget a simple matter: capital management. When you reach the first target, save some money and then change your stop-loss order to an entry order. For inquiries, please leave a comment. Thank you.#DEGO First target: 1.137 Reached Second target: 1.18 Reached Third target: 1.240 Reached

Zorroreny
DEGO - now or never....

DEGO is oversold, bouncing from longterm RSI support line and has pattern similar to XRP - just that accumulation range is more horizontal. We are at the point where no further dips are allowed or we get invalidation! Expecting bounce up and push toward fibb 0.886 range (conservative move) with possible scam wick to new ATH (extended, speculative move).
Disclaimer
Any content and materials included in Sahmeto's website and official communication channels are a compilation of personal opinions and analyses and are not binding. They do not constitute any recommendation for buying, selling, entering or exiting the stock market and cryptocurrency market. Also, all news and analyses included in the website and channels are merely republished information from official and unofficial domestic and foreign sources, and it is obvious that users of the said content are responsible for following up and ensuring the authenticity and accuracy of the materials. Therefore, while disclaiming responsibility, it is declared that the responsibility for any decision-making, action, and potential profit and loss in the capital market and cryptocurrency market lies with the trader.