
DCR
Decred
| تریدر | نوع سیگنال | حد سود/ضرر | زمان انتشار | مشاهده پیام |
|---|---|---|---|---|
No results found. | ||||
Price Chart of Decred
سود 3 Months :
سیگنالهای Decred
Filter
Sort messages by
Trader Type
Time Frame

wolffxtrader


AndrewsMarket-Mastery
مومنتوم انفجاری دکر (DCR)؛ آیا آماده جهش بزرگ است؟

DCR/USDT is starting to show very encouraging bullish momentum, suggesting that Decred (DCR) could be gearing up for a meaningful move. On-chain, price has held up after recent consolidation, and trading volume is climbing — signs that accumulation may be occurring and that bullish participants are stepping back in. This shift could set the stage for a breakout if DCR can push past its near-term resistance levels with strength. From a fundamental standpoint, Decred is a deeply ambitious project. It’s built on a hybrid consensus model that combines proof-of-work with proof-of-stake, giving both miners and stakers a meaningful role in governance. This governance by stake model is central to its value, as holders can vote on protocol changes and budget allocations, making the network highly decentralized and community-driven. The supply dynamics also work in its favor: Decred has a capped maximum supply of 21 million DCR, with roughly 17 million currently in circulation, which supports scarcity. Strategically, the key will be to watch for a clean breakout above consolidation. If DCR breaks higher on strong volume and holds that level, it would confirm genuine bullish conviction. A pullback to retest this breakout could offer an ideal risk-reward entry. On the downside, placing a stop just below the recent support zone would provide a defined invalidation point. Given the fundamentals and structural setup, the upside potential is compelling if the momentum continues to build.

DivergenceSeeker
دیکرِد (Decred): ارز دیجیتالی که قرار است بترکاند! (تحلیل و آیندهنگری)
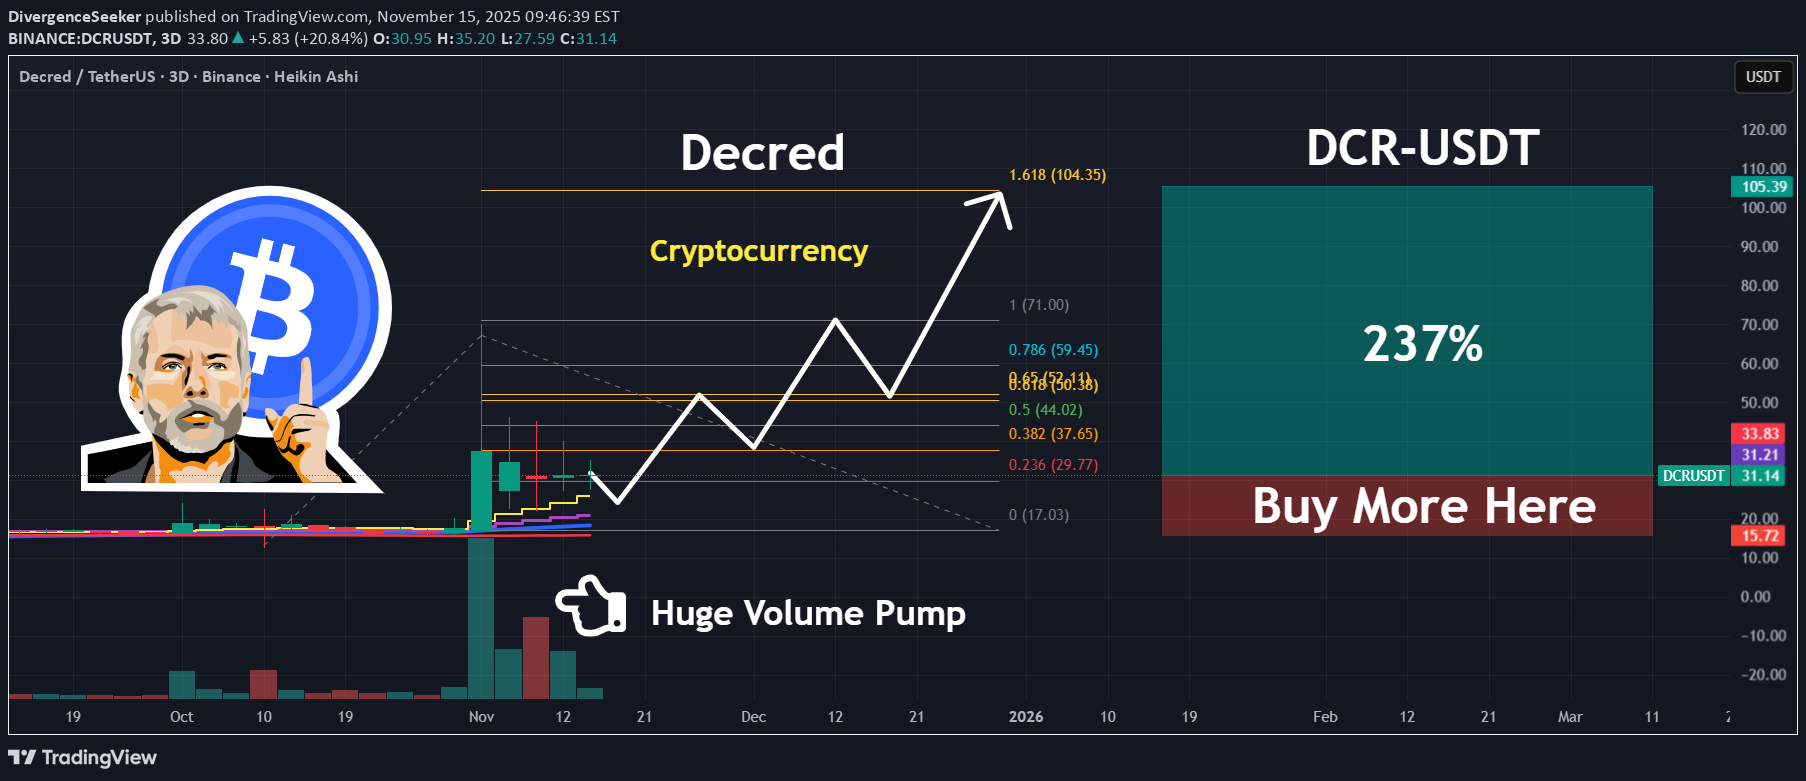
Decred is Money Evolved. By combining battle tested Proof-of-Work with an innovative take on Proof-of-Stake that places coin holders in charge of shaping the future, Decred is able to adapt to challenges and innovate at a rapid pace. You acquire influence in Decred by putting “skin in the game”. Decred’s security, privacy, scalability, and decentralized treasury empower stakeholders and provides them with the tools needed to enhance their financial sovereignty.

WaveRiders2

marqtz
پیشبینی میانمدت داکرِد (DCR): یک سال آینده چگونه خواهد بود؟
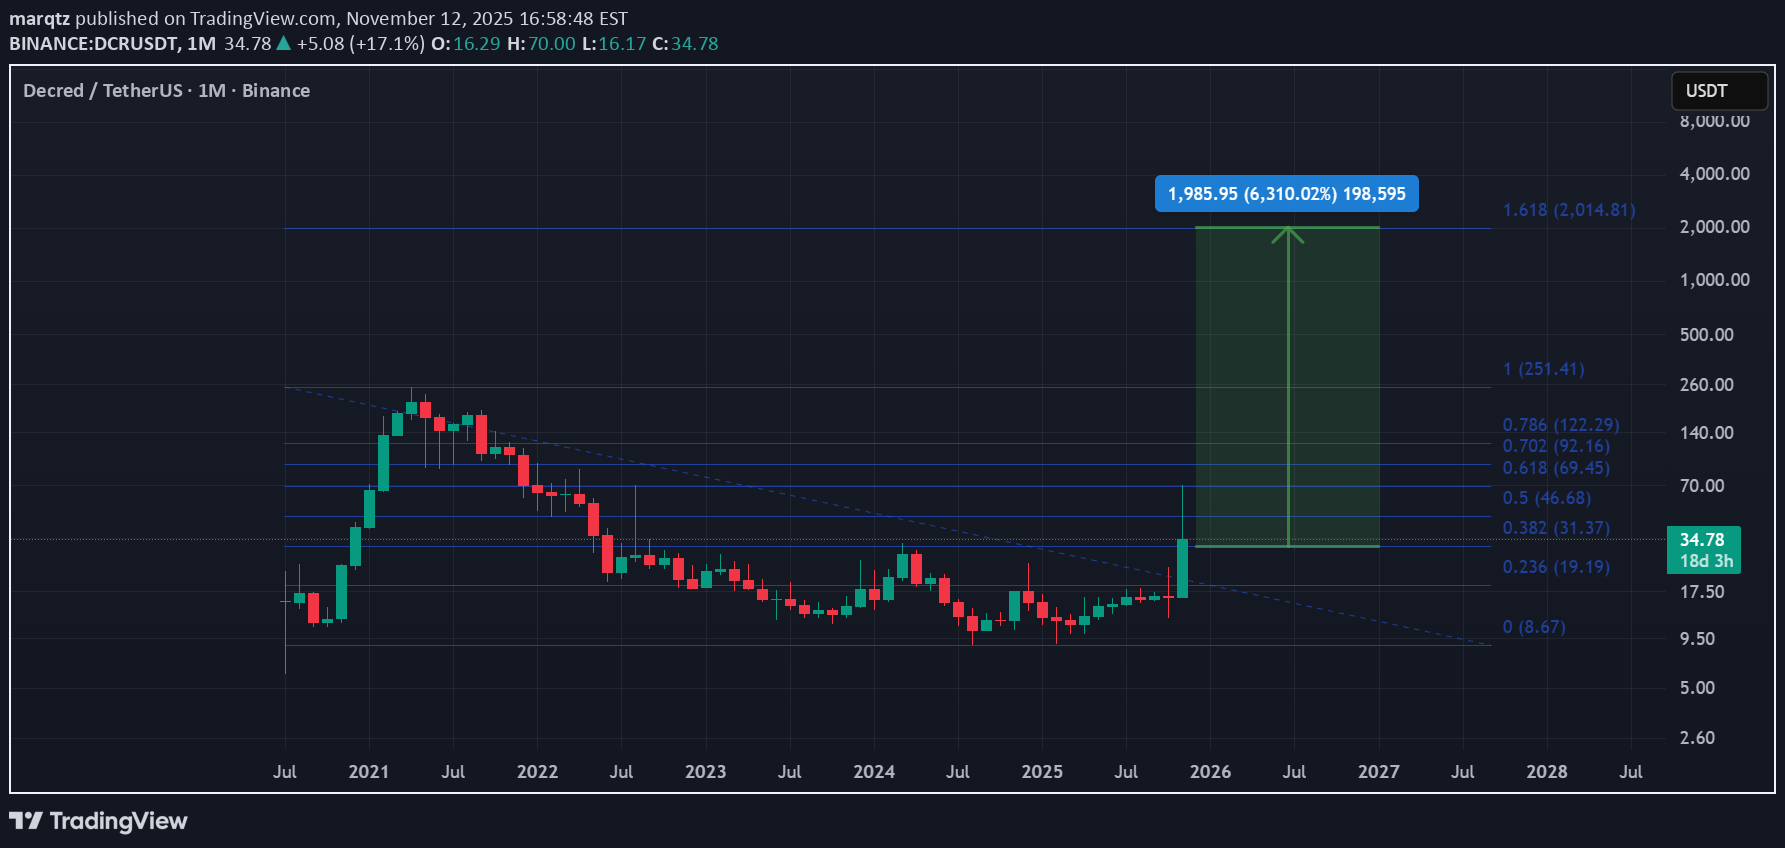
Decred Fib projection for the coming year. Just Hodl and wait patiently.
marqtz
آمادهسازی دکرِد (DCR) برای جهش بزرگ: آیا زمان خرید فرا رسیده است؟

Looks like Decred is ready for a huge race in the next hours. Let's see how it performs. This is not a financial advice. Do Your Own Research
WaveRiders2


asilturk
سرمایهگذاری روی DCR: ۲۰ دلار سود خالص در ۱۰ روز! (بازدهی شگفتانگیز ۱۲۴٪)
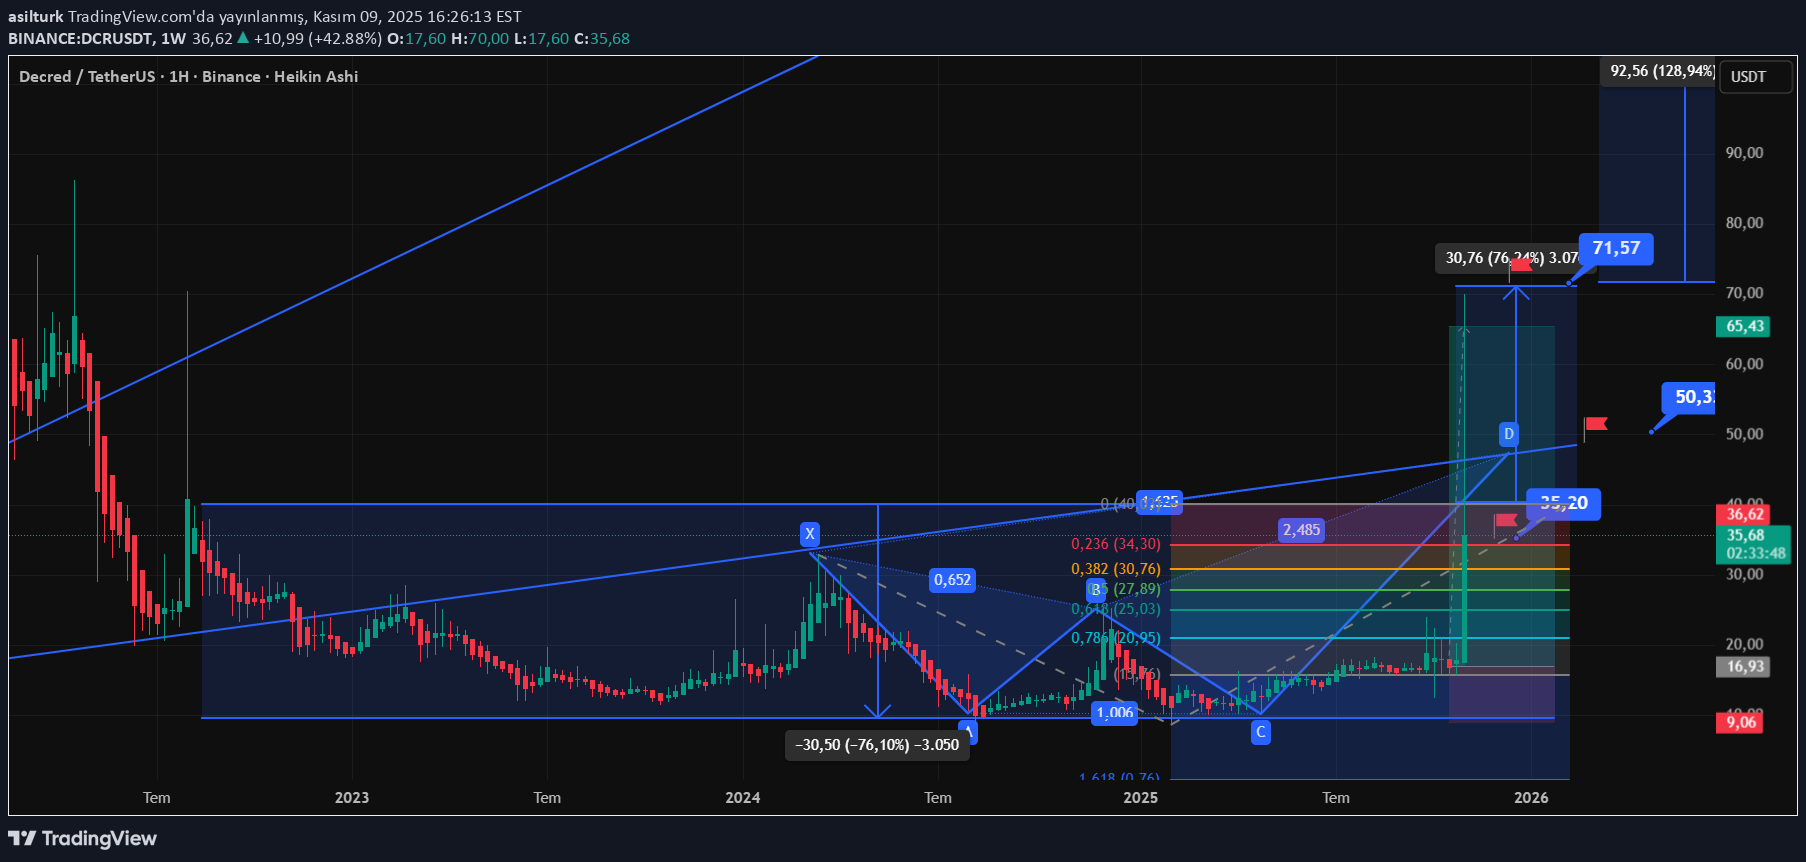
DCR, which we added to the portfolio at $16.50 on October 31, was exposed to correction and selling pressure from the $70 test and achieved the $35 target we stated in the chart. Over the past 10 days, DCR in the POW group continues to move in the $37 price band. I wish my investing friends a pleasant time.
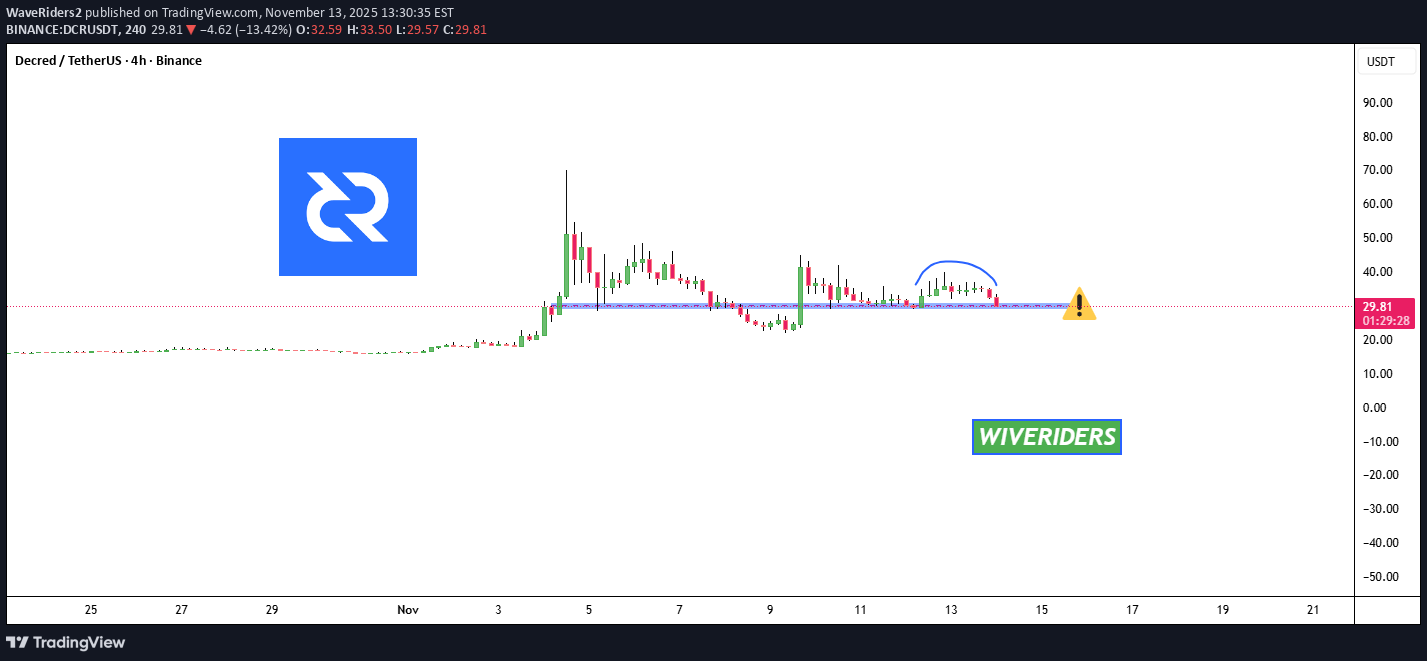
WaveRiders2


Atmaseer
کدام طرفی میرود؟ سیگنالهای حیاتی دوجکوین کش (DCR) در آستانه واکنش بزرگ!
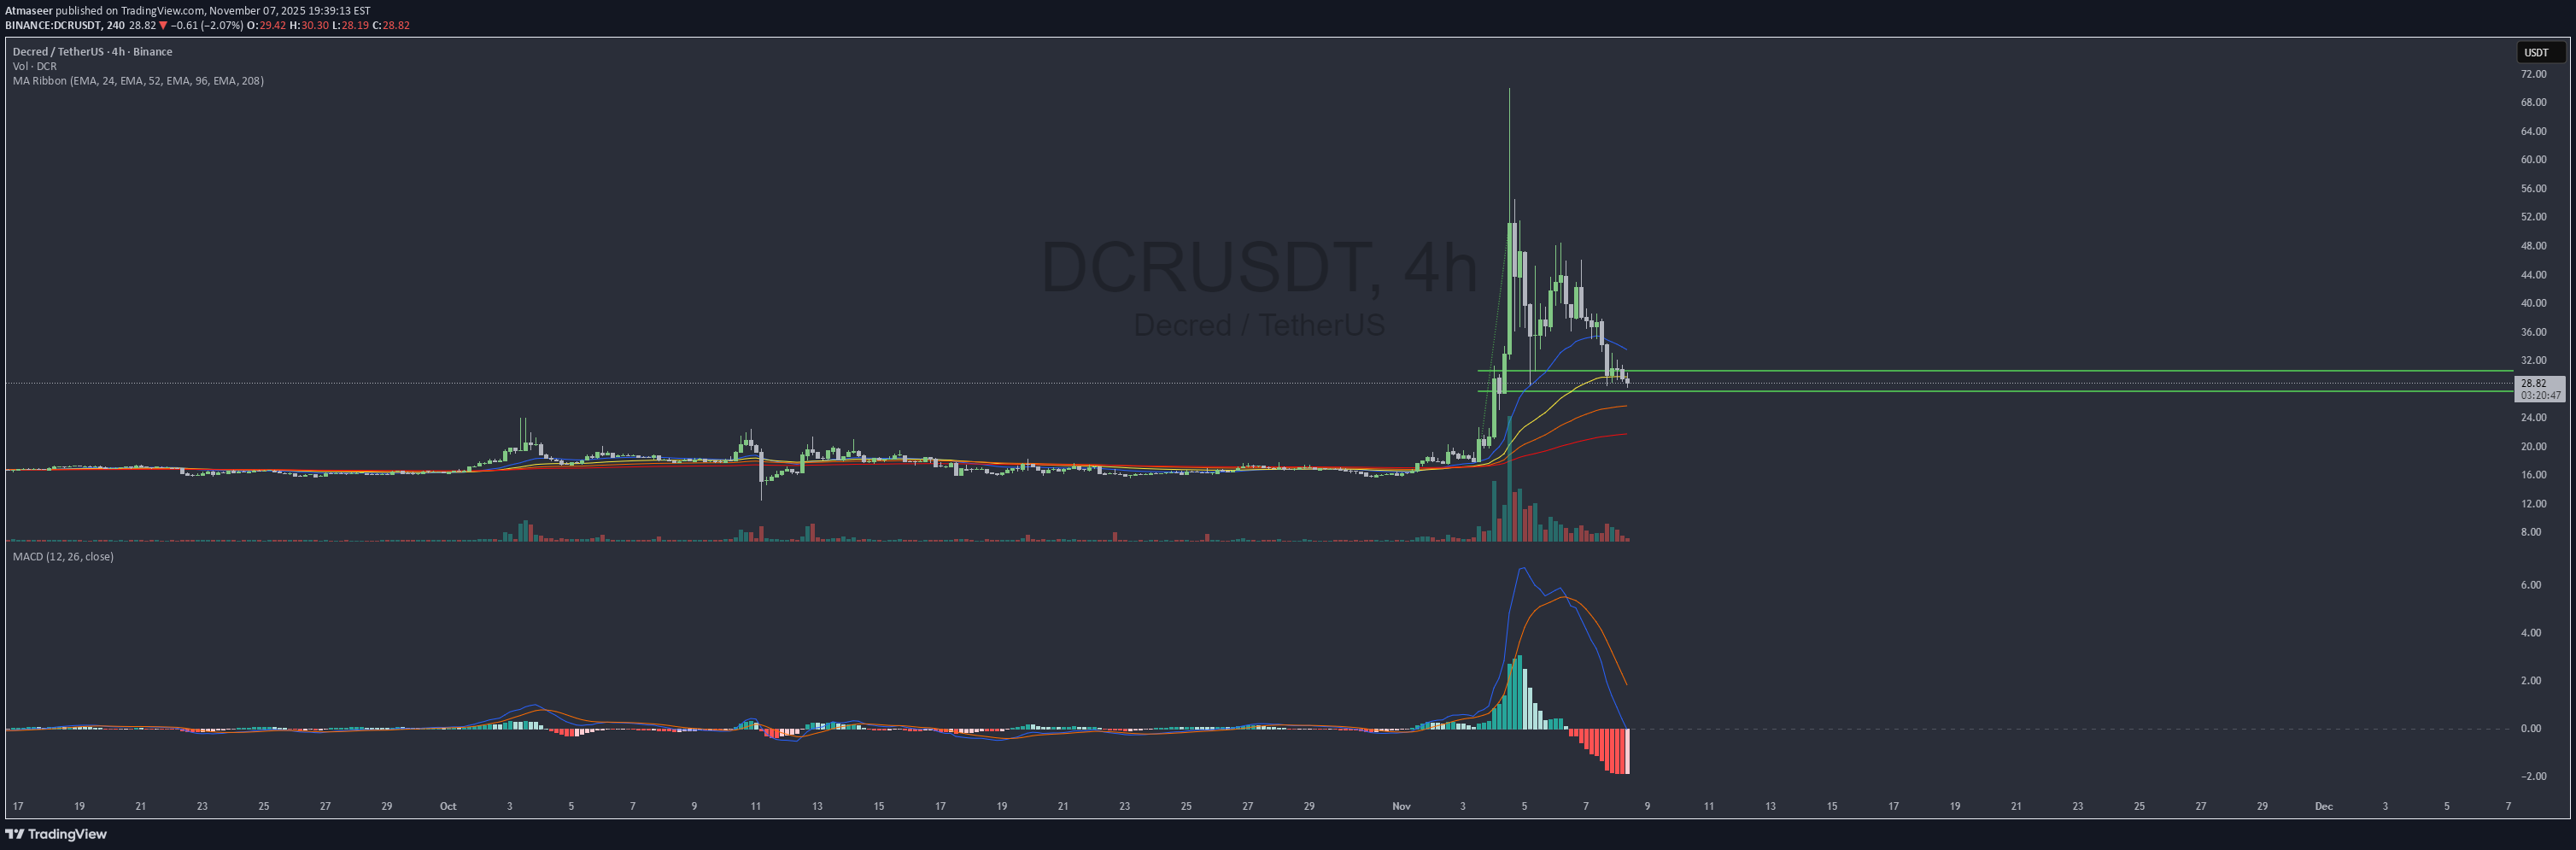
DCRUSDT 4H DCR has reached a key area of interest on the 4-hour timeframe, where multiple technical confluences suggest a potential reaction is imminent—whether minor or significant. 🔍 **Key Signals:** 1. **Resistance Zone** 2. **Fibonacci Retracement** 3. **Key EMA** 4. **MACD 0-Line**
Disclaimer
Any content and materials included in Sahmeto's website and official communication channels are a compilation of personal opinions and analyses and are not binding. They do not constitute any recommendation for buying, selling, entering or exiting the stock market and cryptocurrency market. Also, all news and analyses included in the website and channels are merely republished information from official and unofficial domestic and foreign sources, and it is obvious that users of the said content are responsible for following up and ensuring the authenticity and accuracy of the materials. Therefore, while disclaiming responsibility, it is declared that the responsibility for any decision-making, action, and potential profit and loss in the capital market and cryptocurrency market lies with the trader.