
CVX
Convex Finance
| تریدر | نوع سیگنال | حد سود/ضرر | زمان انتشار | مشاهده پیام |
|---|---|---|---|---|
No results found. | ||||
Price Chart of Convex Finance
سود 3 Months :
سیگنالهای Convex Finance
Filter
Sort messages by
Trader Type
Time Frame

CryptoAnalystSignal
#CVX/USDT : Long-Term Breakout Signals Massive Upside Potentia
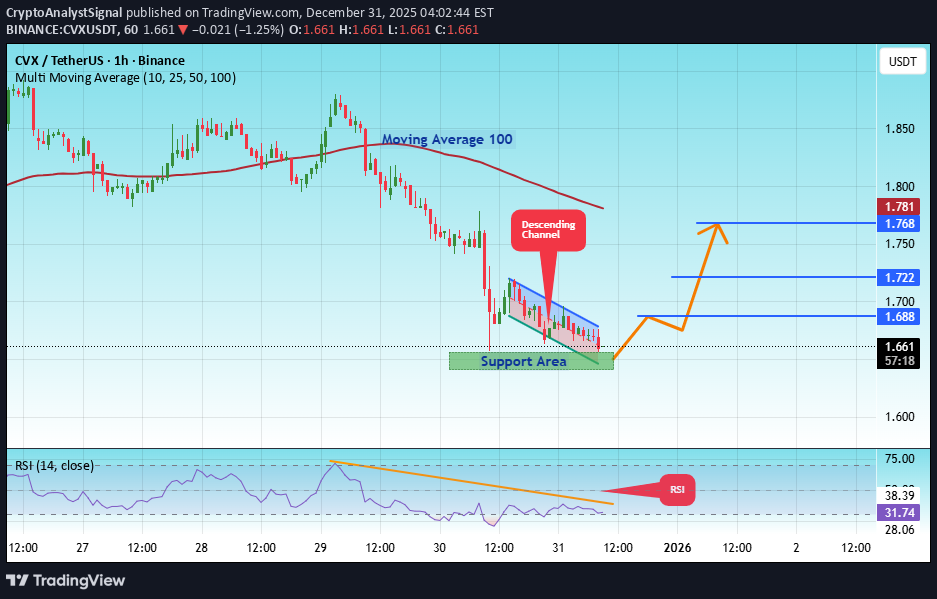
#CVX The price is moving in a descending channel on the 1-hour timeframe. It has reached the lower boundary and is heading towards breaking above it, with a retest of the upper boundary expected. We have a downtrend on the RSI indicator, which has reached near the lower boundary, and an upward rebound is expected. There is a key support zone in green at 1.64. The price has bounced from this zone multiple times and is expected to bounce again. We have a trend towards stability above the 100-period moving average, as we are moving close to it, which supports the upward movement. Entry price: 1.66 First target: 1.68 Second target: 1.72 Third target: 1.78 Stop loss: Below the support zone in green. Don't forget a simple thing: capital management. For inquiries, please leave a comment. Thank you.#CVX First target: 1.68 Reached Second target: 1.72 Reached Third target: 1.78 Reached

My cvx play

For my crypto port, instead of crv im gonna make a play on cvx. This is 100% allocation. At this point I'm picking 1 alt and just keeping simple. CRV has massive upside but CVX has 4x the voting power and is below its intrinsic value by a lot while CRV is not. Lastly CVX supply is 100% diluted while CRV still has release of tokens until 3 billion supply. The $55 all time high would require a market cap extremely less probable than CVX hitting my goals. Ty

Bithereum_io
آیا CVX در آستانه صعود انفجاری؟ اهداف قیمتی شگفتانگیز در انتظار دارند!
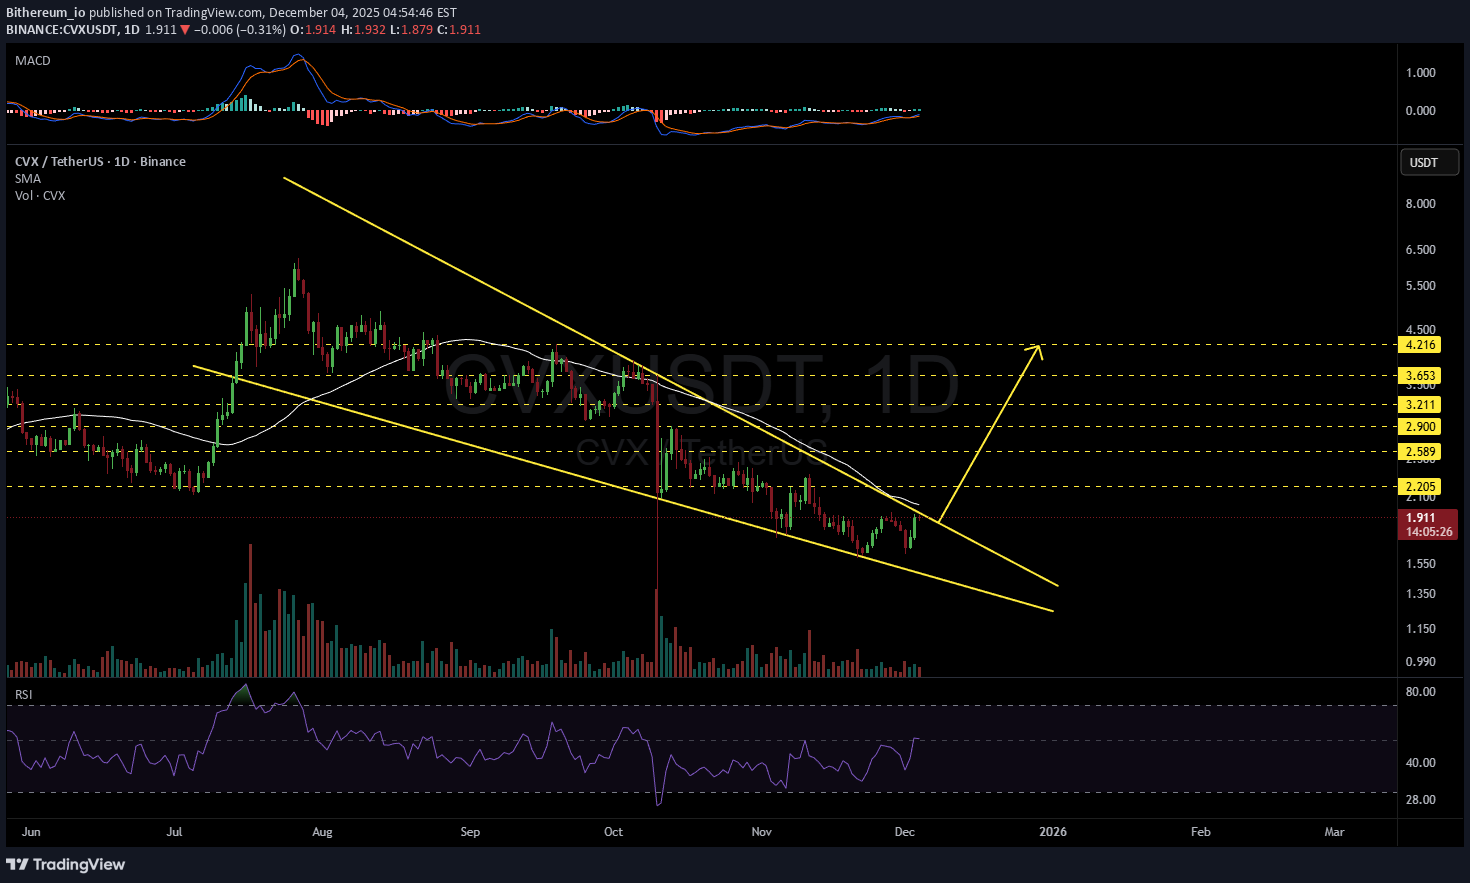
#CVX is moving inside a falling wedge pattern on the daily chart. In case of a breakout above the wedge resistance and the daily SMA50, the potential targets are: 🎯 $2.205 🎯 $2.589 🎯 $2.900 🎯 $3.211 🎯 $3.653 🎯 $4.216 ❌ Invalidation: a daily candle closing below the wedge. ⚠️ Always remember to use a tight stop-loss and maintain proper risk management.
CryptoAnalystSignal
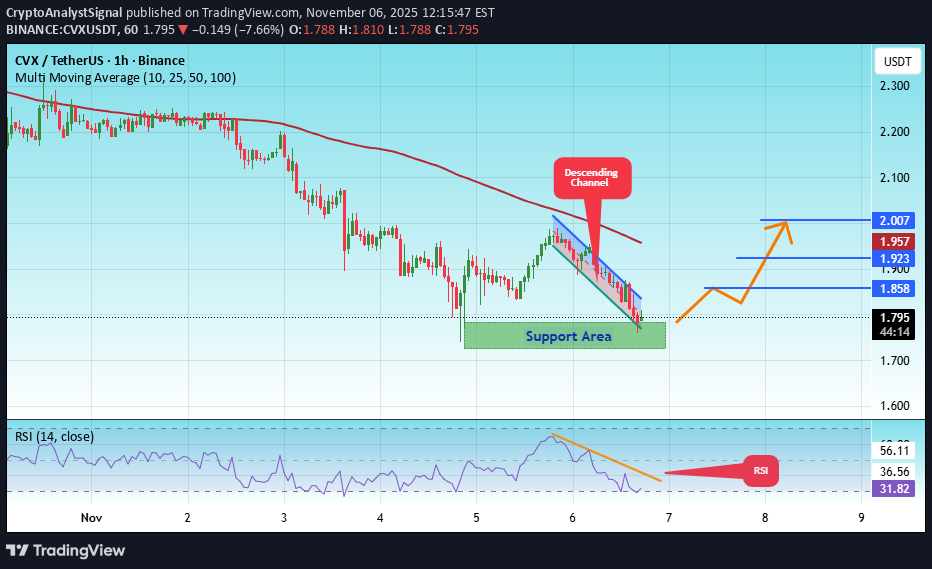
تحلیل تکنیکال CVX/USDT: سیگنال انفجار قیمت در انتظار شکست کانال نزولی!

#CVX The price is moving in a descending channel on the 1-hour timeframe and is expected to break out and continue upwards. We have a trend to stabilize above the 100-period moving average again. We have a downtrend on the RSI indicator, which supports an upward move if it breaks above it. We have a key support zone in green that pushed the price higher at 1.81. Entry price: 1.88 First target: 1.92 Second target: 2.00 Third target: 2.088 For risk management, don't forget your stop-loss and capital management. The stop-loss is below the support zone in green. Upon reaching the first target, take some profit and then change your stop-loss order to an entry order. For any questions, please comment. Thank you.#CVX First target: 1.92 Reached Second target: 2.00 Reached#CVX First target: 1.92 Reached Second target: 2.00 Reached Third target: 2.088 Reached
CryptoAnalystSignal
سیگنال انفجاری CVX: صعود قدرتمند در راه است؟ (با اهداف قیمتی جدید)
#CVX The price is moving within an ascending channel on the 1-hour timeframe and is adhering to it well. It is poised to break out strongly and retest the channel. We have a downtrend line on the RSI indicator that is about to break and retest, which supports the upward move. There is a key support zone in green at the price of 1.74, representing a strong support point. We have a trend to stabilize above the 100-period moving average. Entry price: 1.80 First target: 1.86 Second target: 1.92 Third target: 2.00 Don't forget a simple money management rule: Place your stop-loss order below the support zone in green. Once the first target is reached, save some money and then change your stop-loss order to an entry order. For any questions, please leave a comment. Thank you.#CVX First target: 1.86 Reached Second target: 1.92 Reached Third target: 2.00 Reached

yassoo-x2
تحلیل تکنیکال CVX/USDT: سیگنال صعود قوی با احتمال رسیدن به ۲.۲۵ دلار!
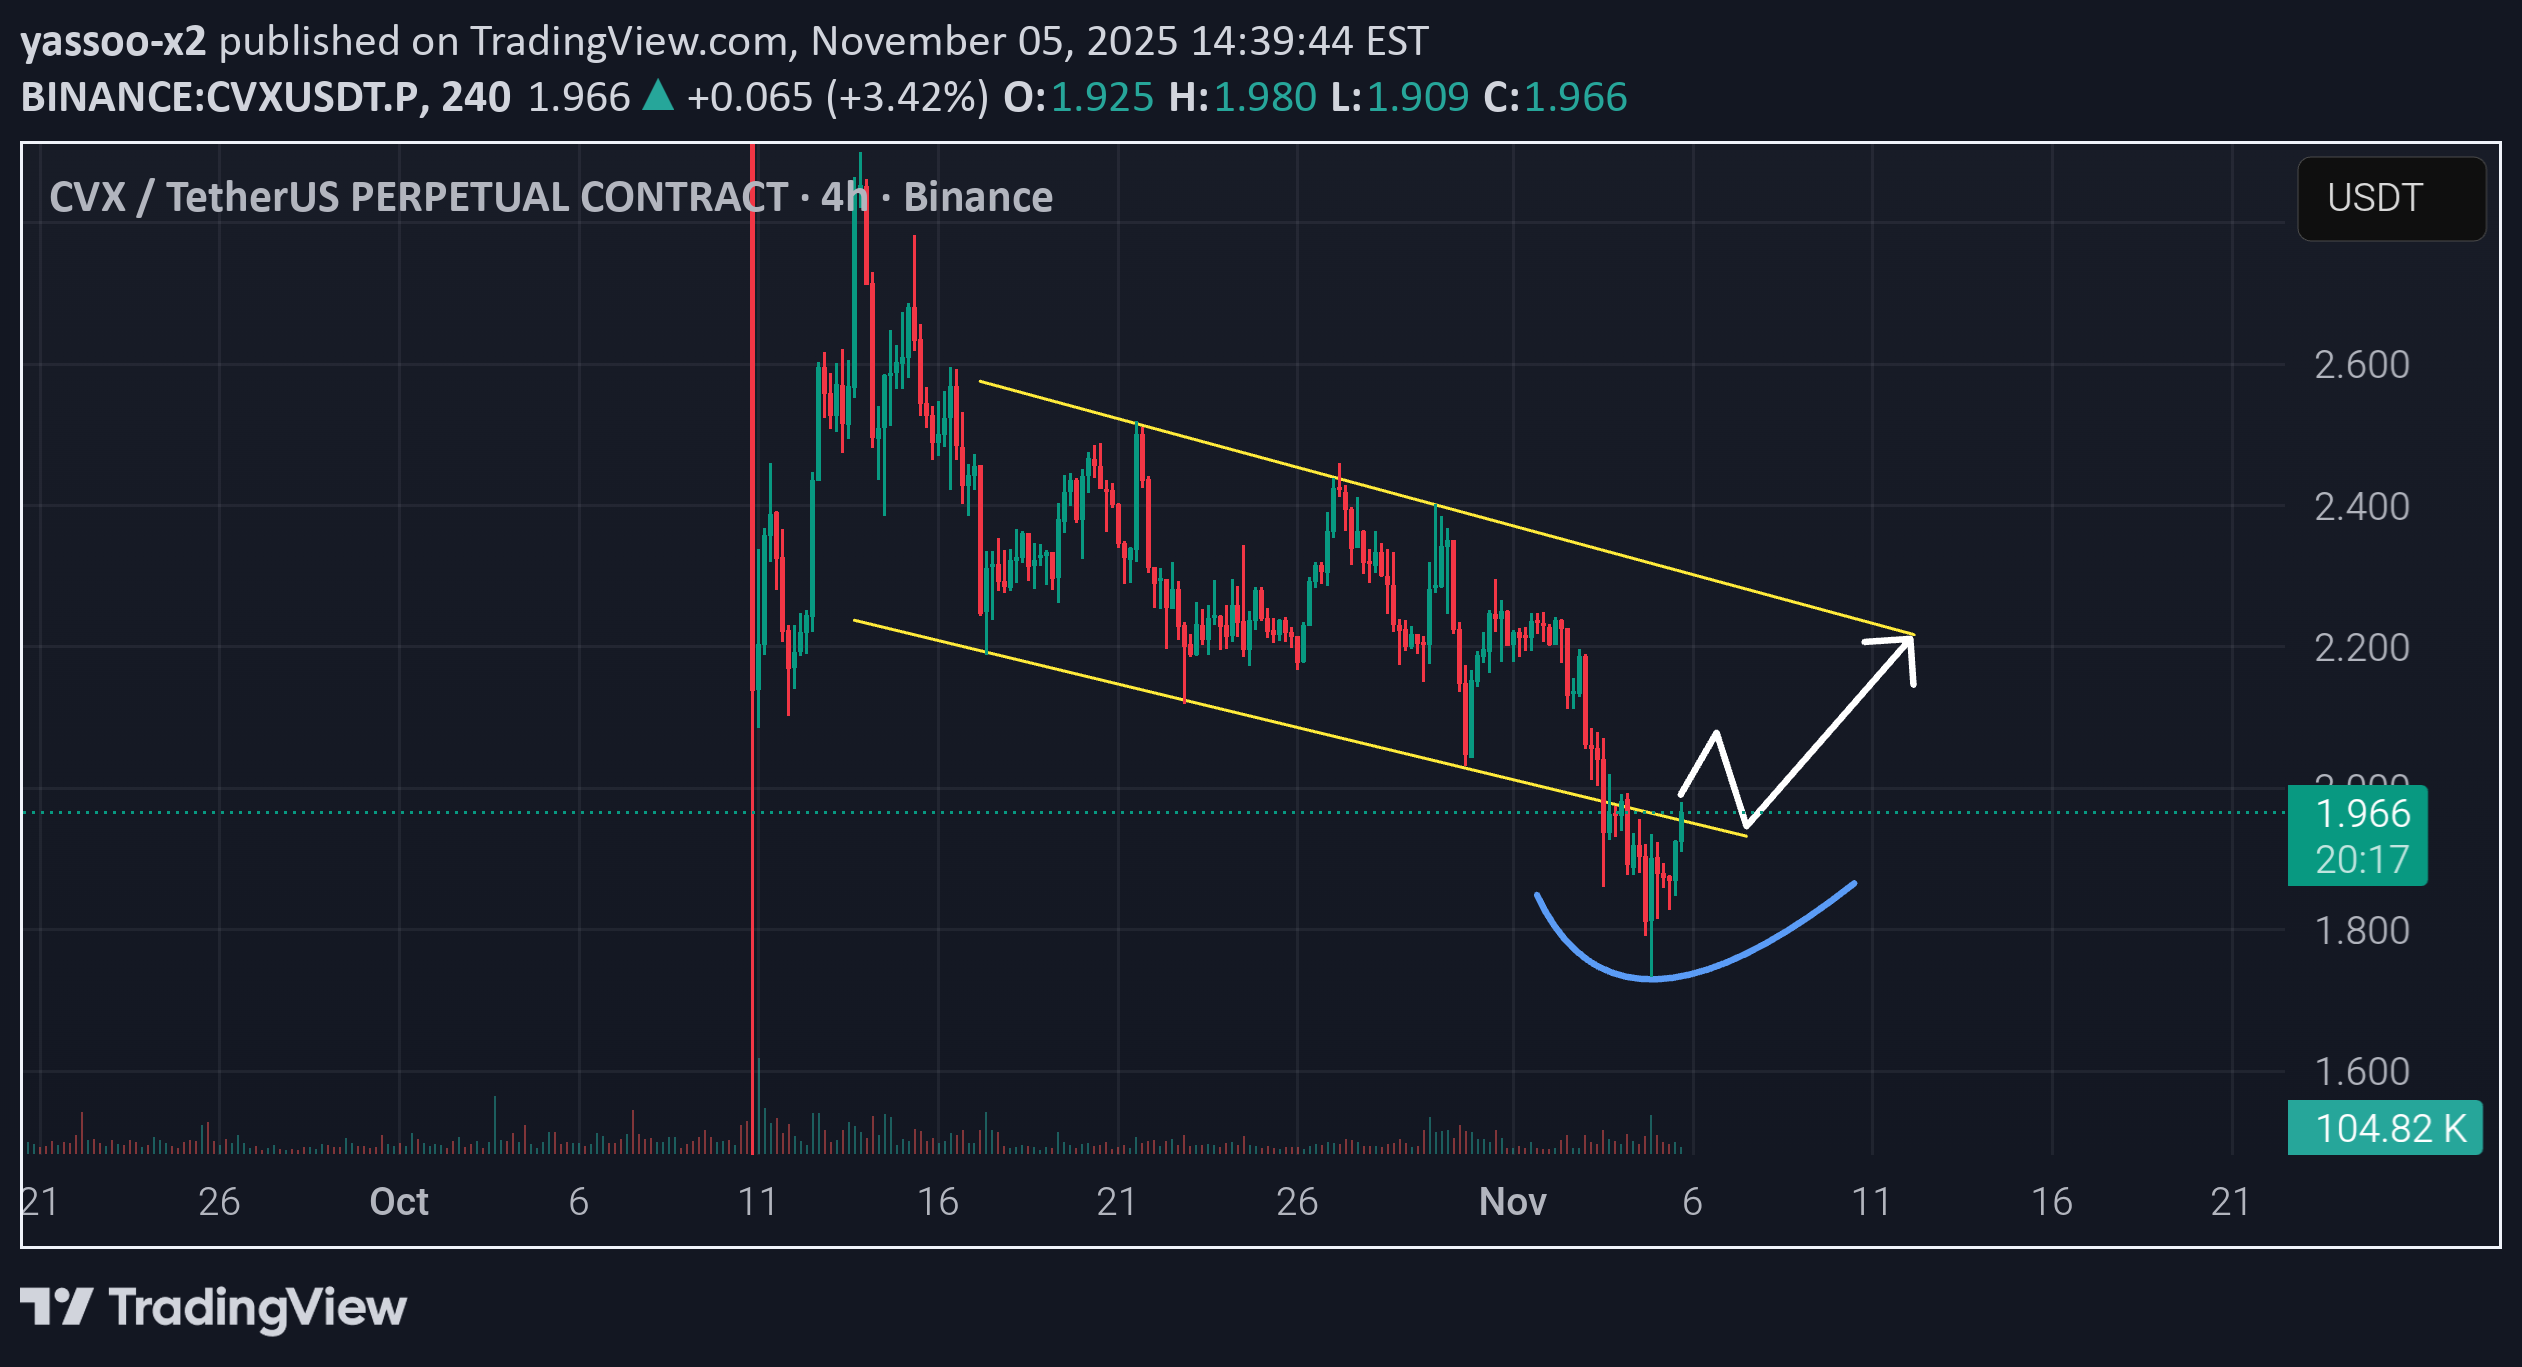
The price is forming a round bottom pattern after touching the lower boundary of the descending channel. Currently showing signs of reversal with increasing volume. If price breaks above the midline of the channel, a move toward 2.20–2.25 looks likely. Confirmation: 4H close above 2.00 Targets: 2.20 – 2.25 Support: 1.80 💡 Watching for breakout confirmation and volume continuation before entry.
CryptoAnalystSignal
تحلیل تکنیکال CVX: سیگنالهای شکست بزرگ برای جهش قیمتی عظیم!
#CVX The price is moving within a descending channel on the 1-hour frame, adhering well to it, and is heading for a strong breakout and retest. We have a bearish trend on the RSI indicator that is about to be broken and retested, which supports the upward breakout. There is a major support area in green at 2.24, representing a strong support point. We are heading for consolidation above the 100 moving average. Entry price: 2.28 First target: 2.30 Second target: 2.34 Third target: 2.38 Don't forget a simple matter: capital management. When you reach the first target, save some money and then change your stop-loss order to an entry order. For inquiries, please leave a comment. Thank you.#CVX First target: 2.30 Reached Second target: 2.34 Reached Third target: 2.38 Reached
CryptoAnalystSignal
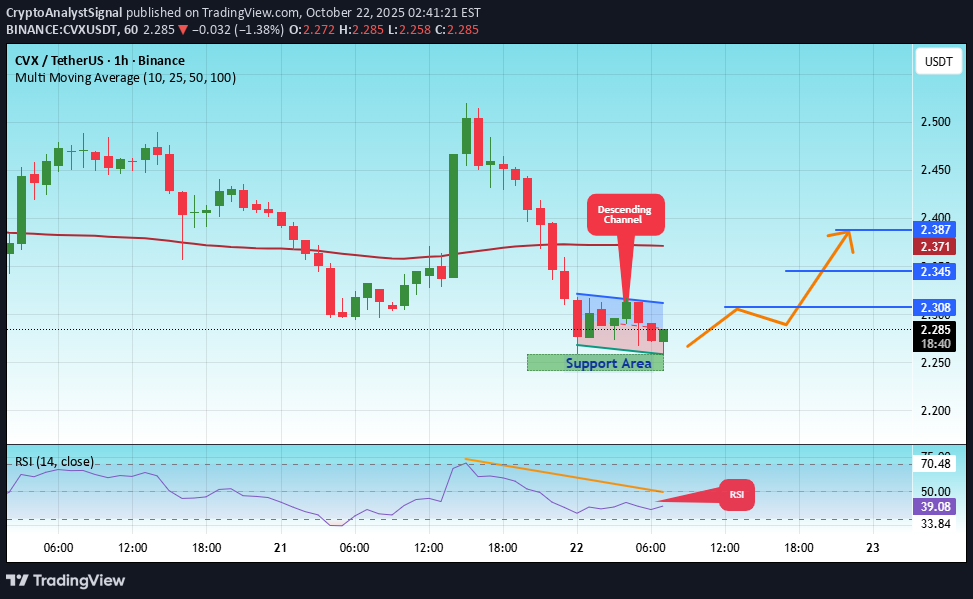
تحلیل تکنیکال CVX/USDT: سیگنال انفجاری صعودی و اهداف قیمتی هیجانانگیز!

#CVX The price is moving in a descending channel on the 1-hour frame and is expected to break and continue upward. We have a trend to stabilize above the 100 moving average once again. We have a downtrend on the RSI indicator that supports the upward move with a breakout. We have a major support area in green that pushed the price higher at 2.40. Entry price: 2.57. First target: 2.64. Second target: 2.75. Third target: 2.87. To manage risk, don't forget stop loss and capital management. When you reach the first target, save some profits and then change the stop order to an entry order. For inquiries, please comment. Thank you.

Happy_Killing
فرصت خرید طلایی: چرا CVX زیر ۳ دلار یک سرمایهگذاری عالی است؟

I believe CVX can form a higher low with this trend line acting as support at 3.10. If BTC continue it's uptrend to $130k and more there's high change it will mark a low on CVX and many others. This will be an opportunity to maybe enter at an interesting price for the beginning of a possible alt season once BTC reach a definitive new all time high for this cycle to close the year. Thank you.

Alpha-GoldFX
فرصت انفجار بزرگ CVX/USDT: الگوی گوه نزولی نویدبخش رالی ۹۰ درصدی!

CVXUSDT is showing a well-defined falling wedge pattern on the chart — a classic bullish reversal formation that often signals the end of a downtrend and the start of a strong upward move. The price has been consolidating within narrowing trendlines, suggesting that bearish momentum is weakening while buying pressure is gradually increasing. This setup, combined with consistent volume activity, indicates that a breakout could be imminent and may lead to a substantial rally in the coming sessions. With an expected gain of around 90% to 100%+, CVXUSDT has the potential to deliver a major bullish move once it breaks above the wedge resistance. Historically, similar setups in altcoins have triggered sharp rallies as traders and investors recognize the shift in trend. The good trading volume supports the likelihood of a strong follow-through if a breakout occurs, confirming growing market participation and confidence in this asset’s short-term outlook. Investor sentiment around CVXUSDT appears to be improving, with more attention coming from both technical traders and long-term holders. This combination of technical strength, market interest, and supportive volume makes CVXUSDT an attractive setup for traders looking to capitalize on a potential breakout opportunity. Watching for a decisive move above resistance could open the door for an impressive bullish wave. ✅ Show your support by hitting the like button and ✅ Leaving a comment below! (What is You opinion about this Coin) Your feedback and engagement keep me inspired to share more insightful market analysis with you!
Disclaimer
Any content and materials included in Sahmeto's website and official communication channels are a compilation of personal opinions and analyses and are not binding. They do not constitute any recommendation for buying, selling, entering or exiting the stock market and cryptocurrency market. Also, all news and analyses included in the website and channels are merely republished information from official and unofficial domestic and foreign sources, and it is obvious that users of the said content are responsible for following up and ensuring the authenticity and accuracy of the materials. Therefore, while disclaiming responsibility, it is declared that the responsibility for any decision-making, action, and potential profit and loss in the capital market and cryptocurrency market lies with the trader.