
CRV
Curve DAO Token
| تریدر | نوع سیگنال | حد سود/ضرر | زمان انتشار | مشاهده پیام |
|---|---|---|---|---|
خرید | حد سود: تعیین نشده حد ضرر: تعیین نشده | 12/6/2025 | ||
خرید | حد سود: تعیین نشده حد ضرر: تعیین نشده | 12/2/2025 | ||
 TRADEKING_1988Rank: 1051 | خرید | حد سود: تعیین نشده حد ضرر: تعیین نشده | 11/30/2025 |

Price Chart of Curve DAO Token
سود 3 Months :
خلاصه سیگنالهای Curve DAO Token
سیگنالهای Curve DAO Token
Filter
Sort messages by
Trader Type
Time Frame

CryptoAnalystSignal
#CRV/USDT breakout alert!
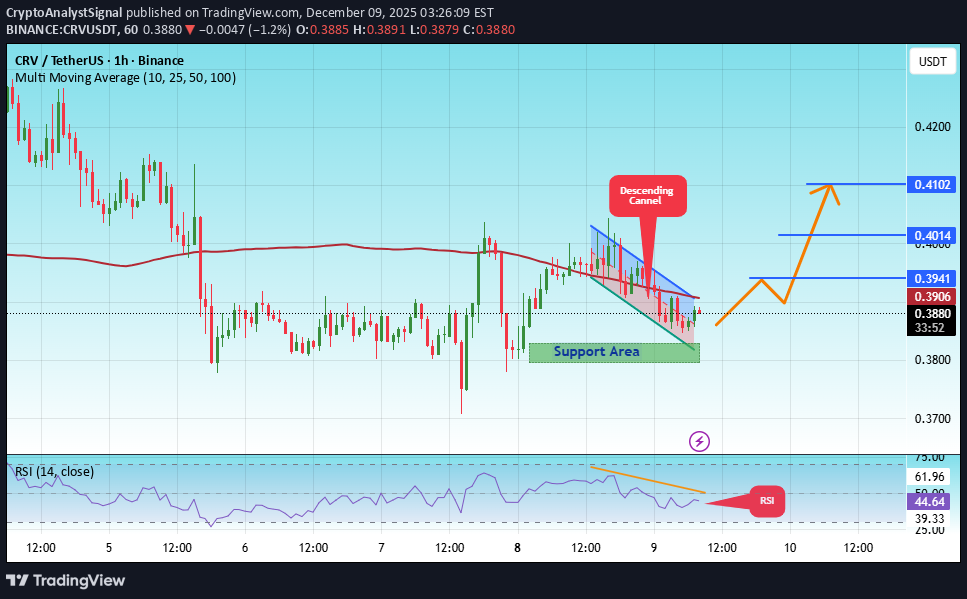
#CRV The price is moving in a descending channel on the 1-hour timeframe. It has reached the lower boundary and is heading towards breaking above it, with a retest of the upper boundary expected. We have a downtrend on the RSI indicator, which has reached near the lower boundary, and an upward rebound is expected. There is a key support zone in green at 0.3800. The price has bounced from this level multiple times and is expected to bounce again. We have a trend towards consolidation above the 100-period moving average, as we are moving close to it, which supports the upward movement. Entry price: 0.3880 First target: 0.3941 Second target: 0.4014 Third target: 0.4100 Don't forget a simple principle: money management. Place your stop-loss below the support zone in green. For any questions, please leave a comment. Thank you.
CryptoAnalystSignal
#CRV/USDT breakout alert!
#CRV The price is moving in a descending channel on the 1-hour timeframe. It has reached the lower boundary and is heading towards breaking above it, with a retest of the upper boundary expected. We have a downtrend on the RSI indicator, which has reached near the lower boundary, and an upward rebound is expected. There is a key support zone in green at 0.3800. The price has bounced from this level multiple times and is expected to bounce again. We have a trend towards consolidation above the 100-period moving average, as we are moving close to it, which supports the upward movement. Entry price: 0.3880 First target: 0.3941 Second target: 0.4014 Third target: 0.4100 Don't forget a simple principle: money management. Place your stop-loss below the support zone in green. For any questions, please leave a comment. Thank you.
تحلیل نمودار روزانه CRV: آیا این حمایت قوی، مسیر صعود انفجاری را رقم میزند؟
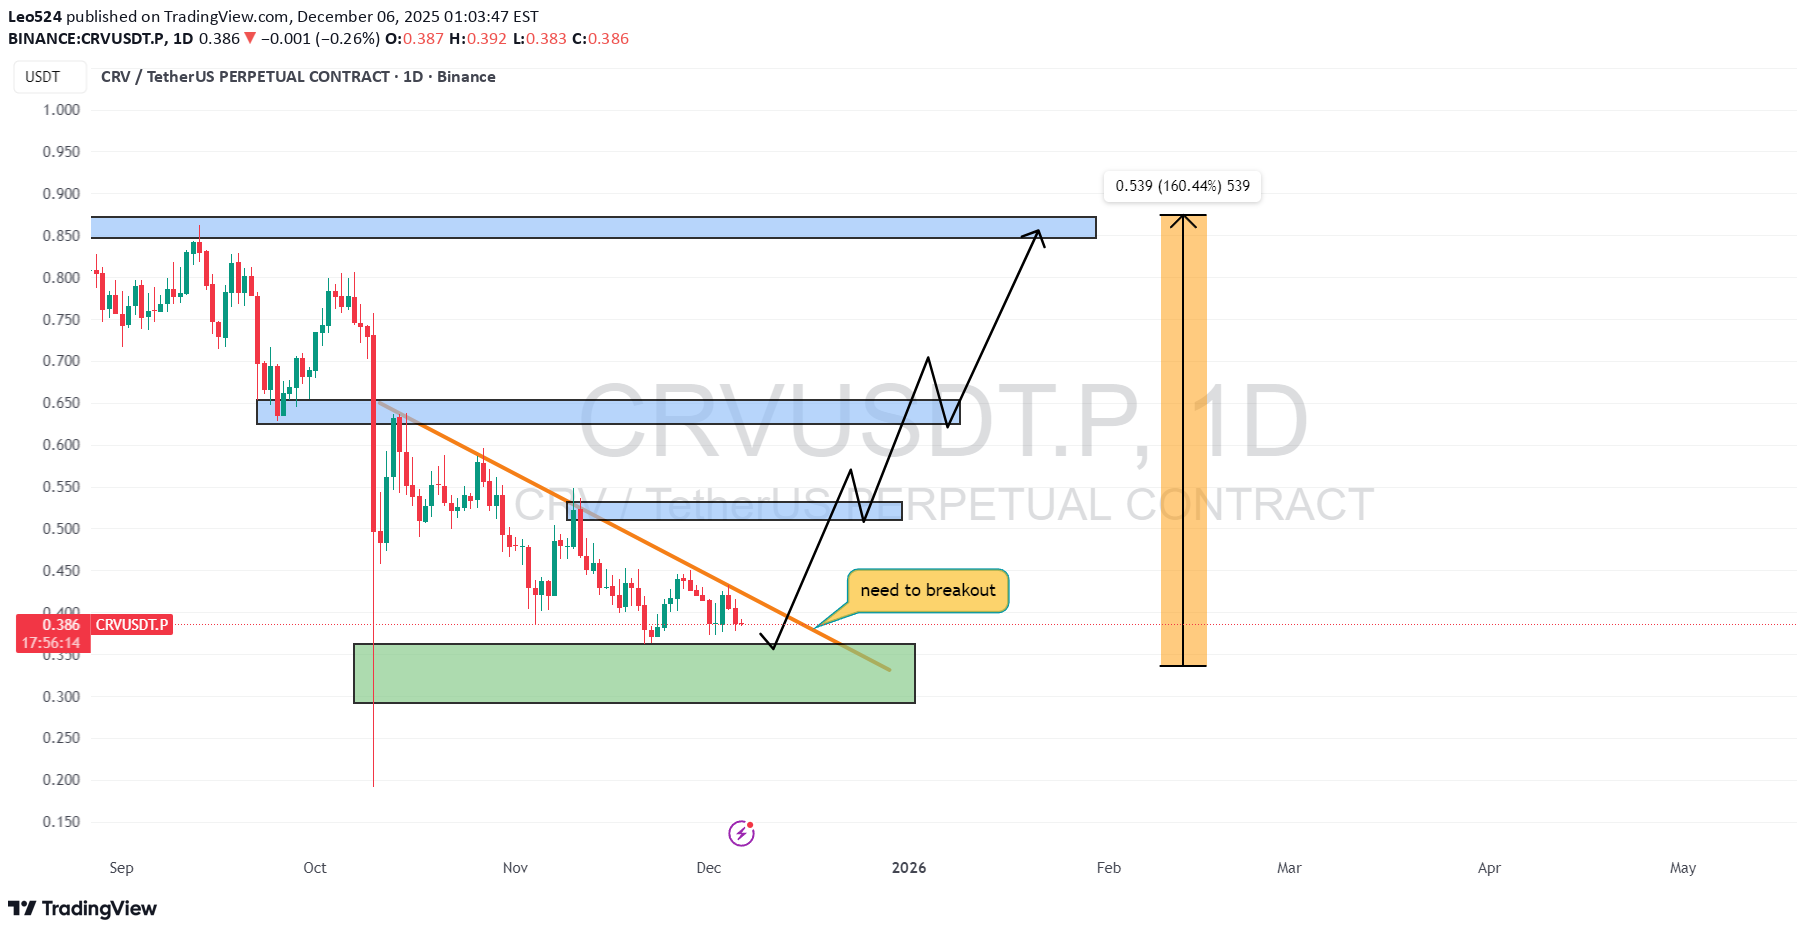
📌In the CRV 1D CHART, it has been rejected by the Trendline several times ✅ 📌 It is now near a strong support zone. If this support zone is hold and the trendline above is broken, I expect a strong price increase 🔥 📌For that, the support zone must be hold and the trendline above must be broken 🔥🚀

CryptoSanders9563
تحلیل هفتگی CRV/USDT: آیا کف قیمتی تشکیل میشود یا سقوط ادامه دارد؟
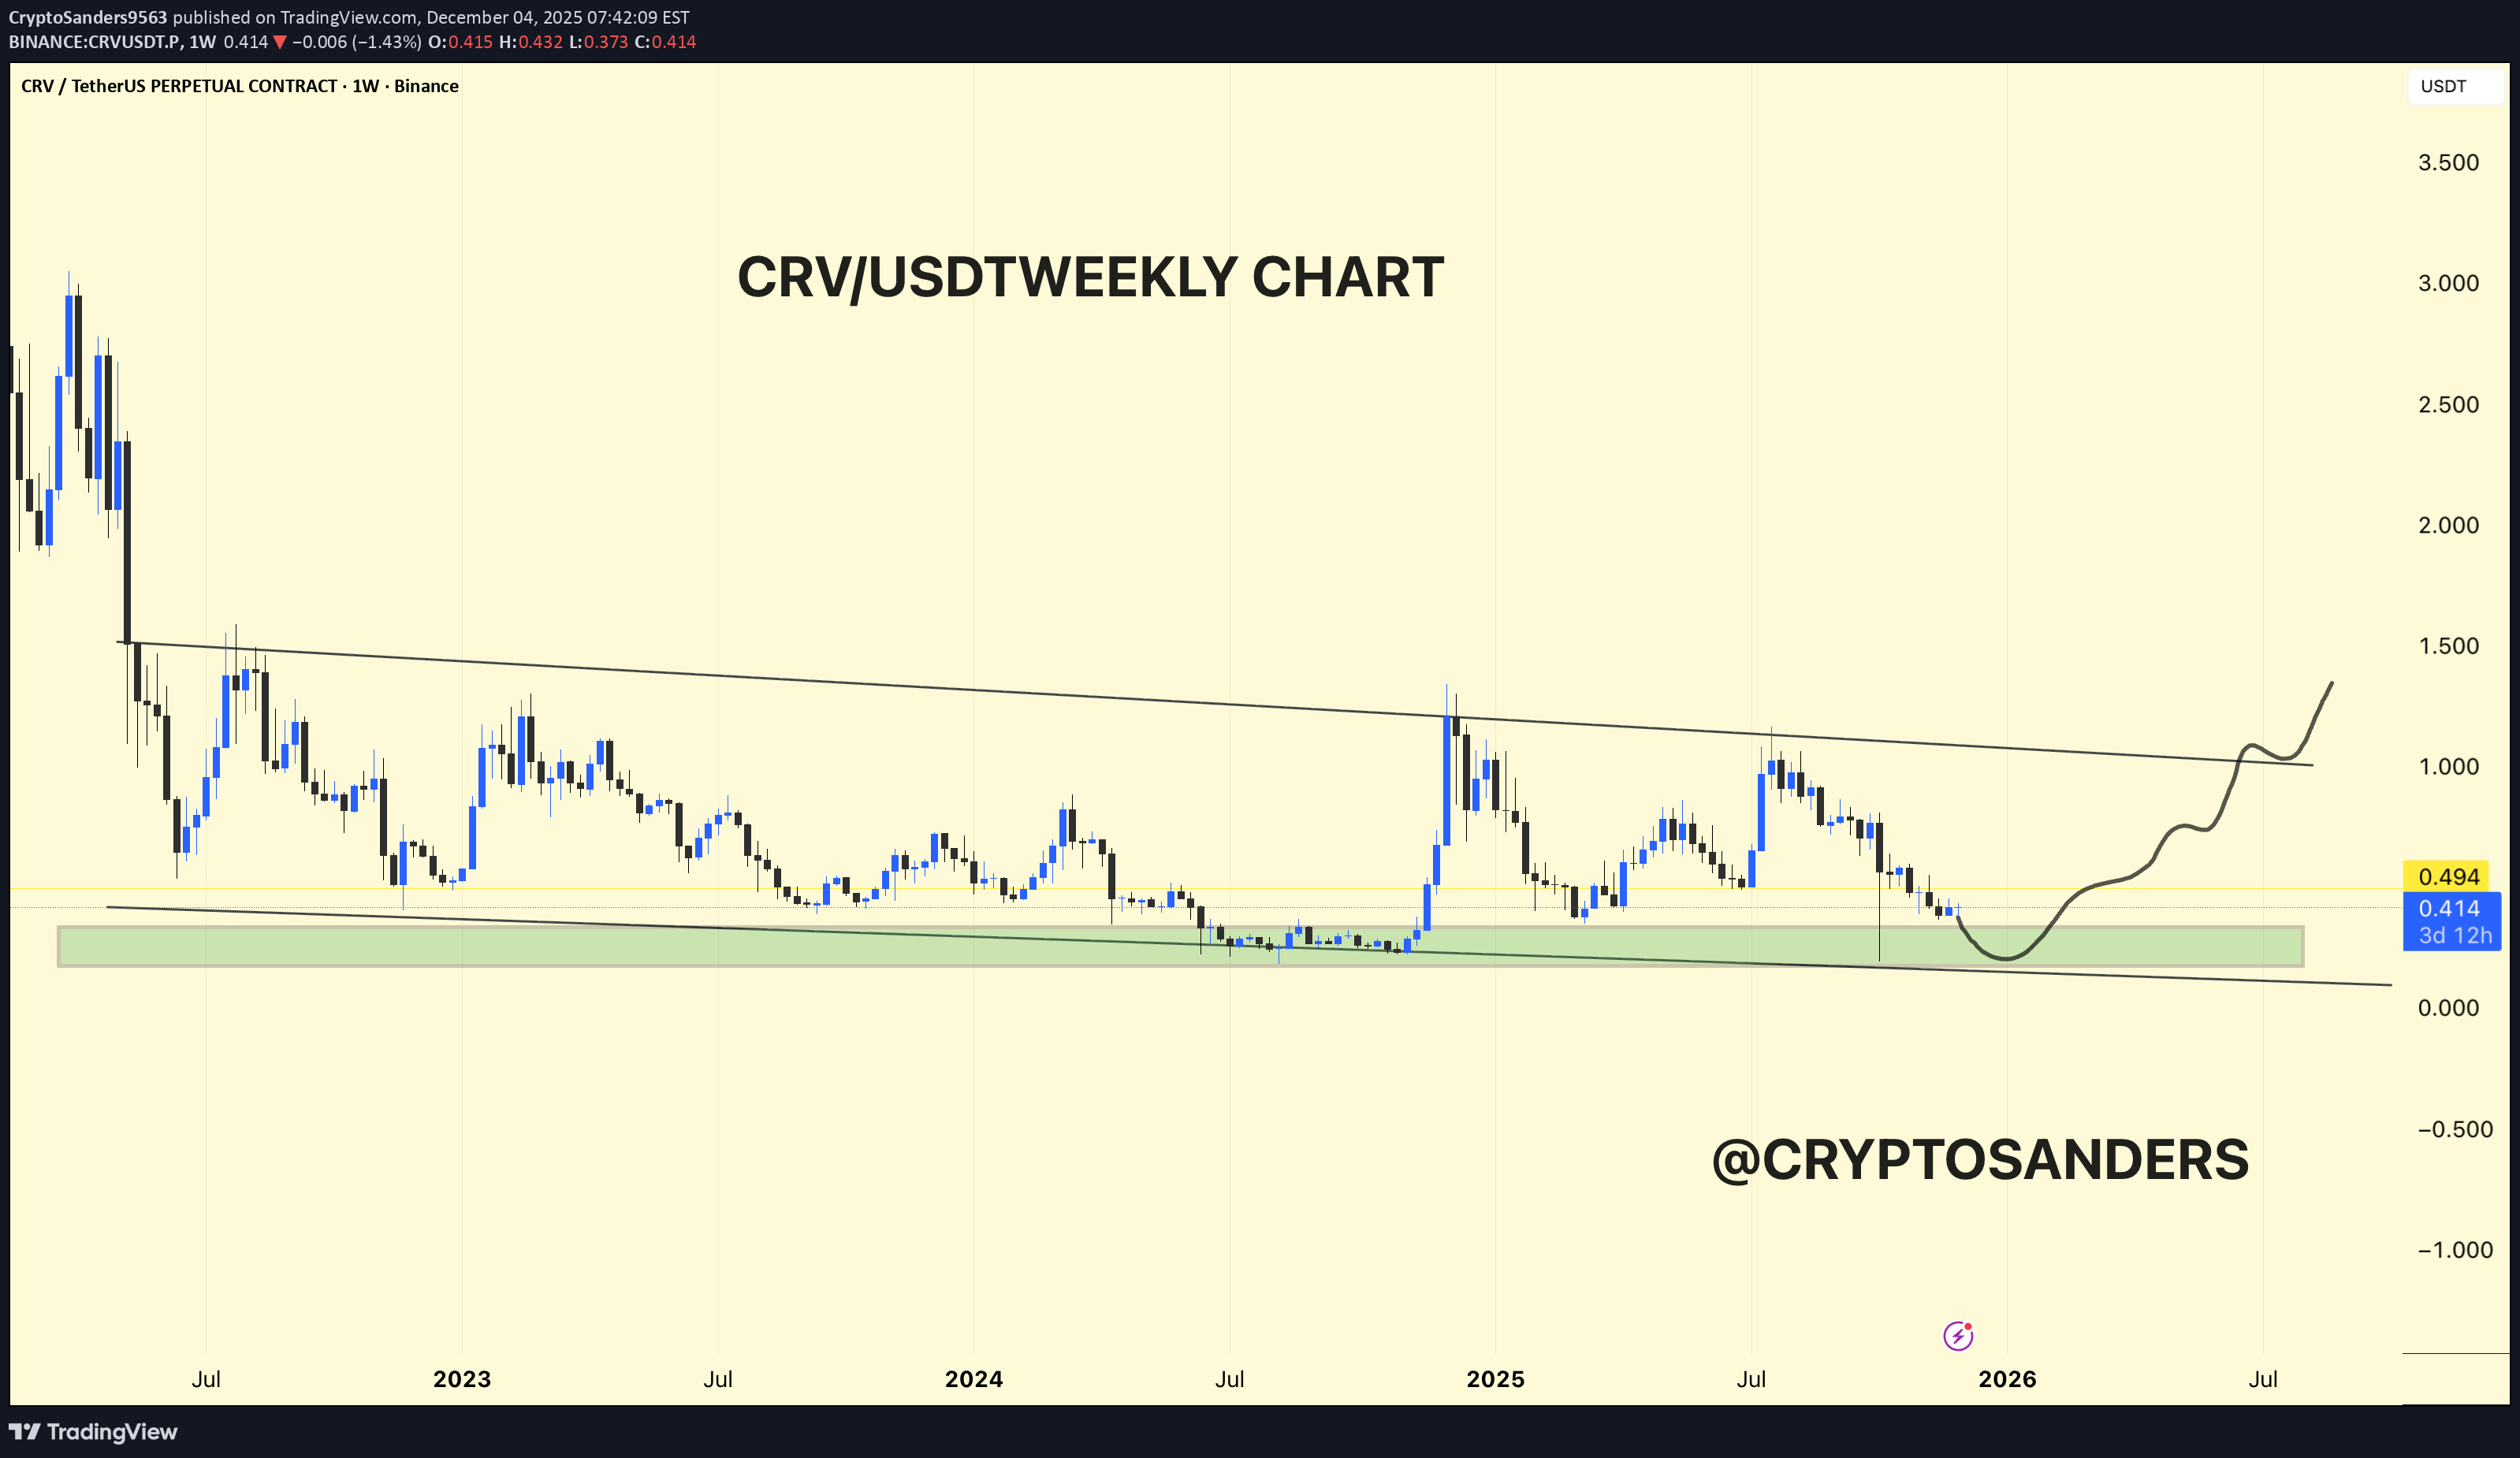
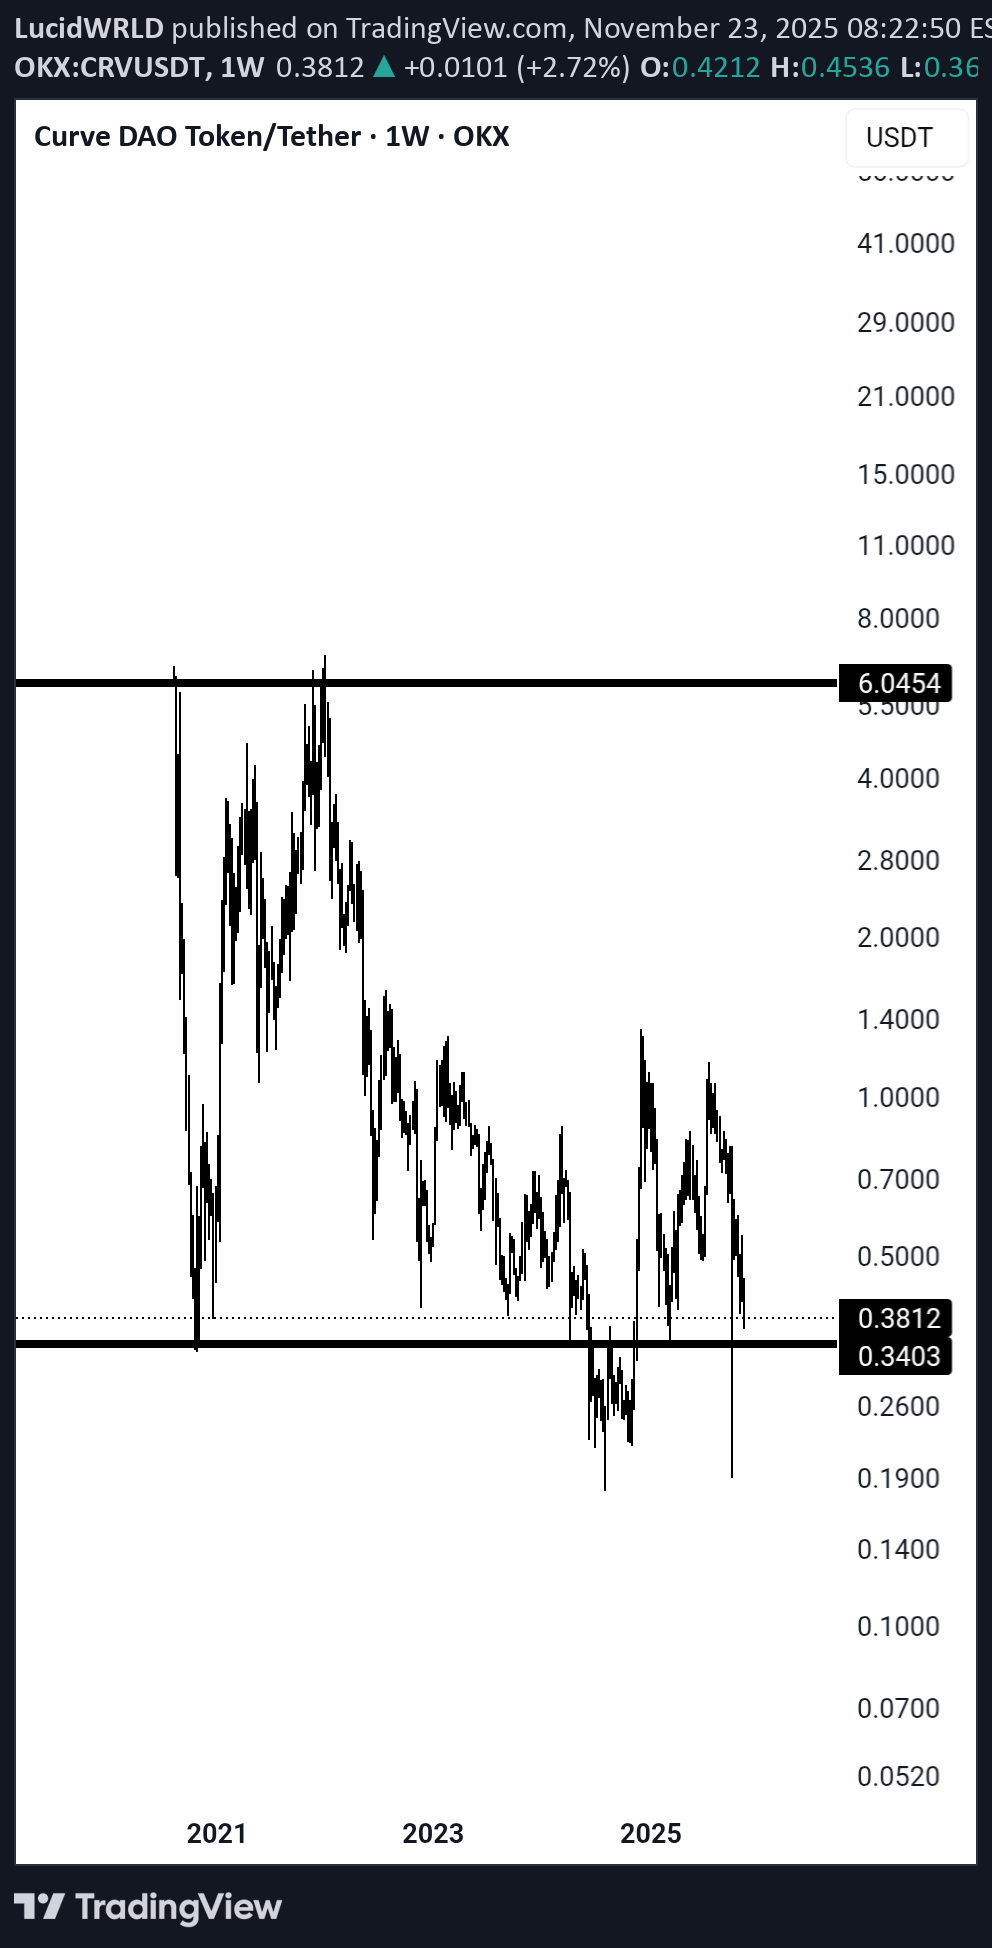
The weekly chart, CRV/USDT, is still in a long-term downtrend, but within a large accumulation support zone, where strong surges have previously occurred. The price has been following a large downward trendline since 2022, with each rally being rejected near that line and then retracing back towards the same horizontal green demand band around 0.35–0.45 USDT. The current weekly candles are again parked in this green zone, which has repeatedly acted as a floor over the past few years, suggesting a higher-timeframe accumulation or base rather than a new breakdown so far. The bullish view on the chart shows a rounded bottom forming at this support, followed by a potential move towards the downward trendline and then a breakout towards the 1.00–1.50 region if buyers can maintain momentum. The bearish risk is that a clean weekly close below the green zone will invalidate the base and make room for a new lower low, so this support acts as a key invalidation zone for any medium to long-term bias. DYOR | NFA
استراتژی انفجاری CRV: سه گام تا هدف ۱۴۰ سنت (با حد ضرر دقیق)
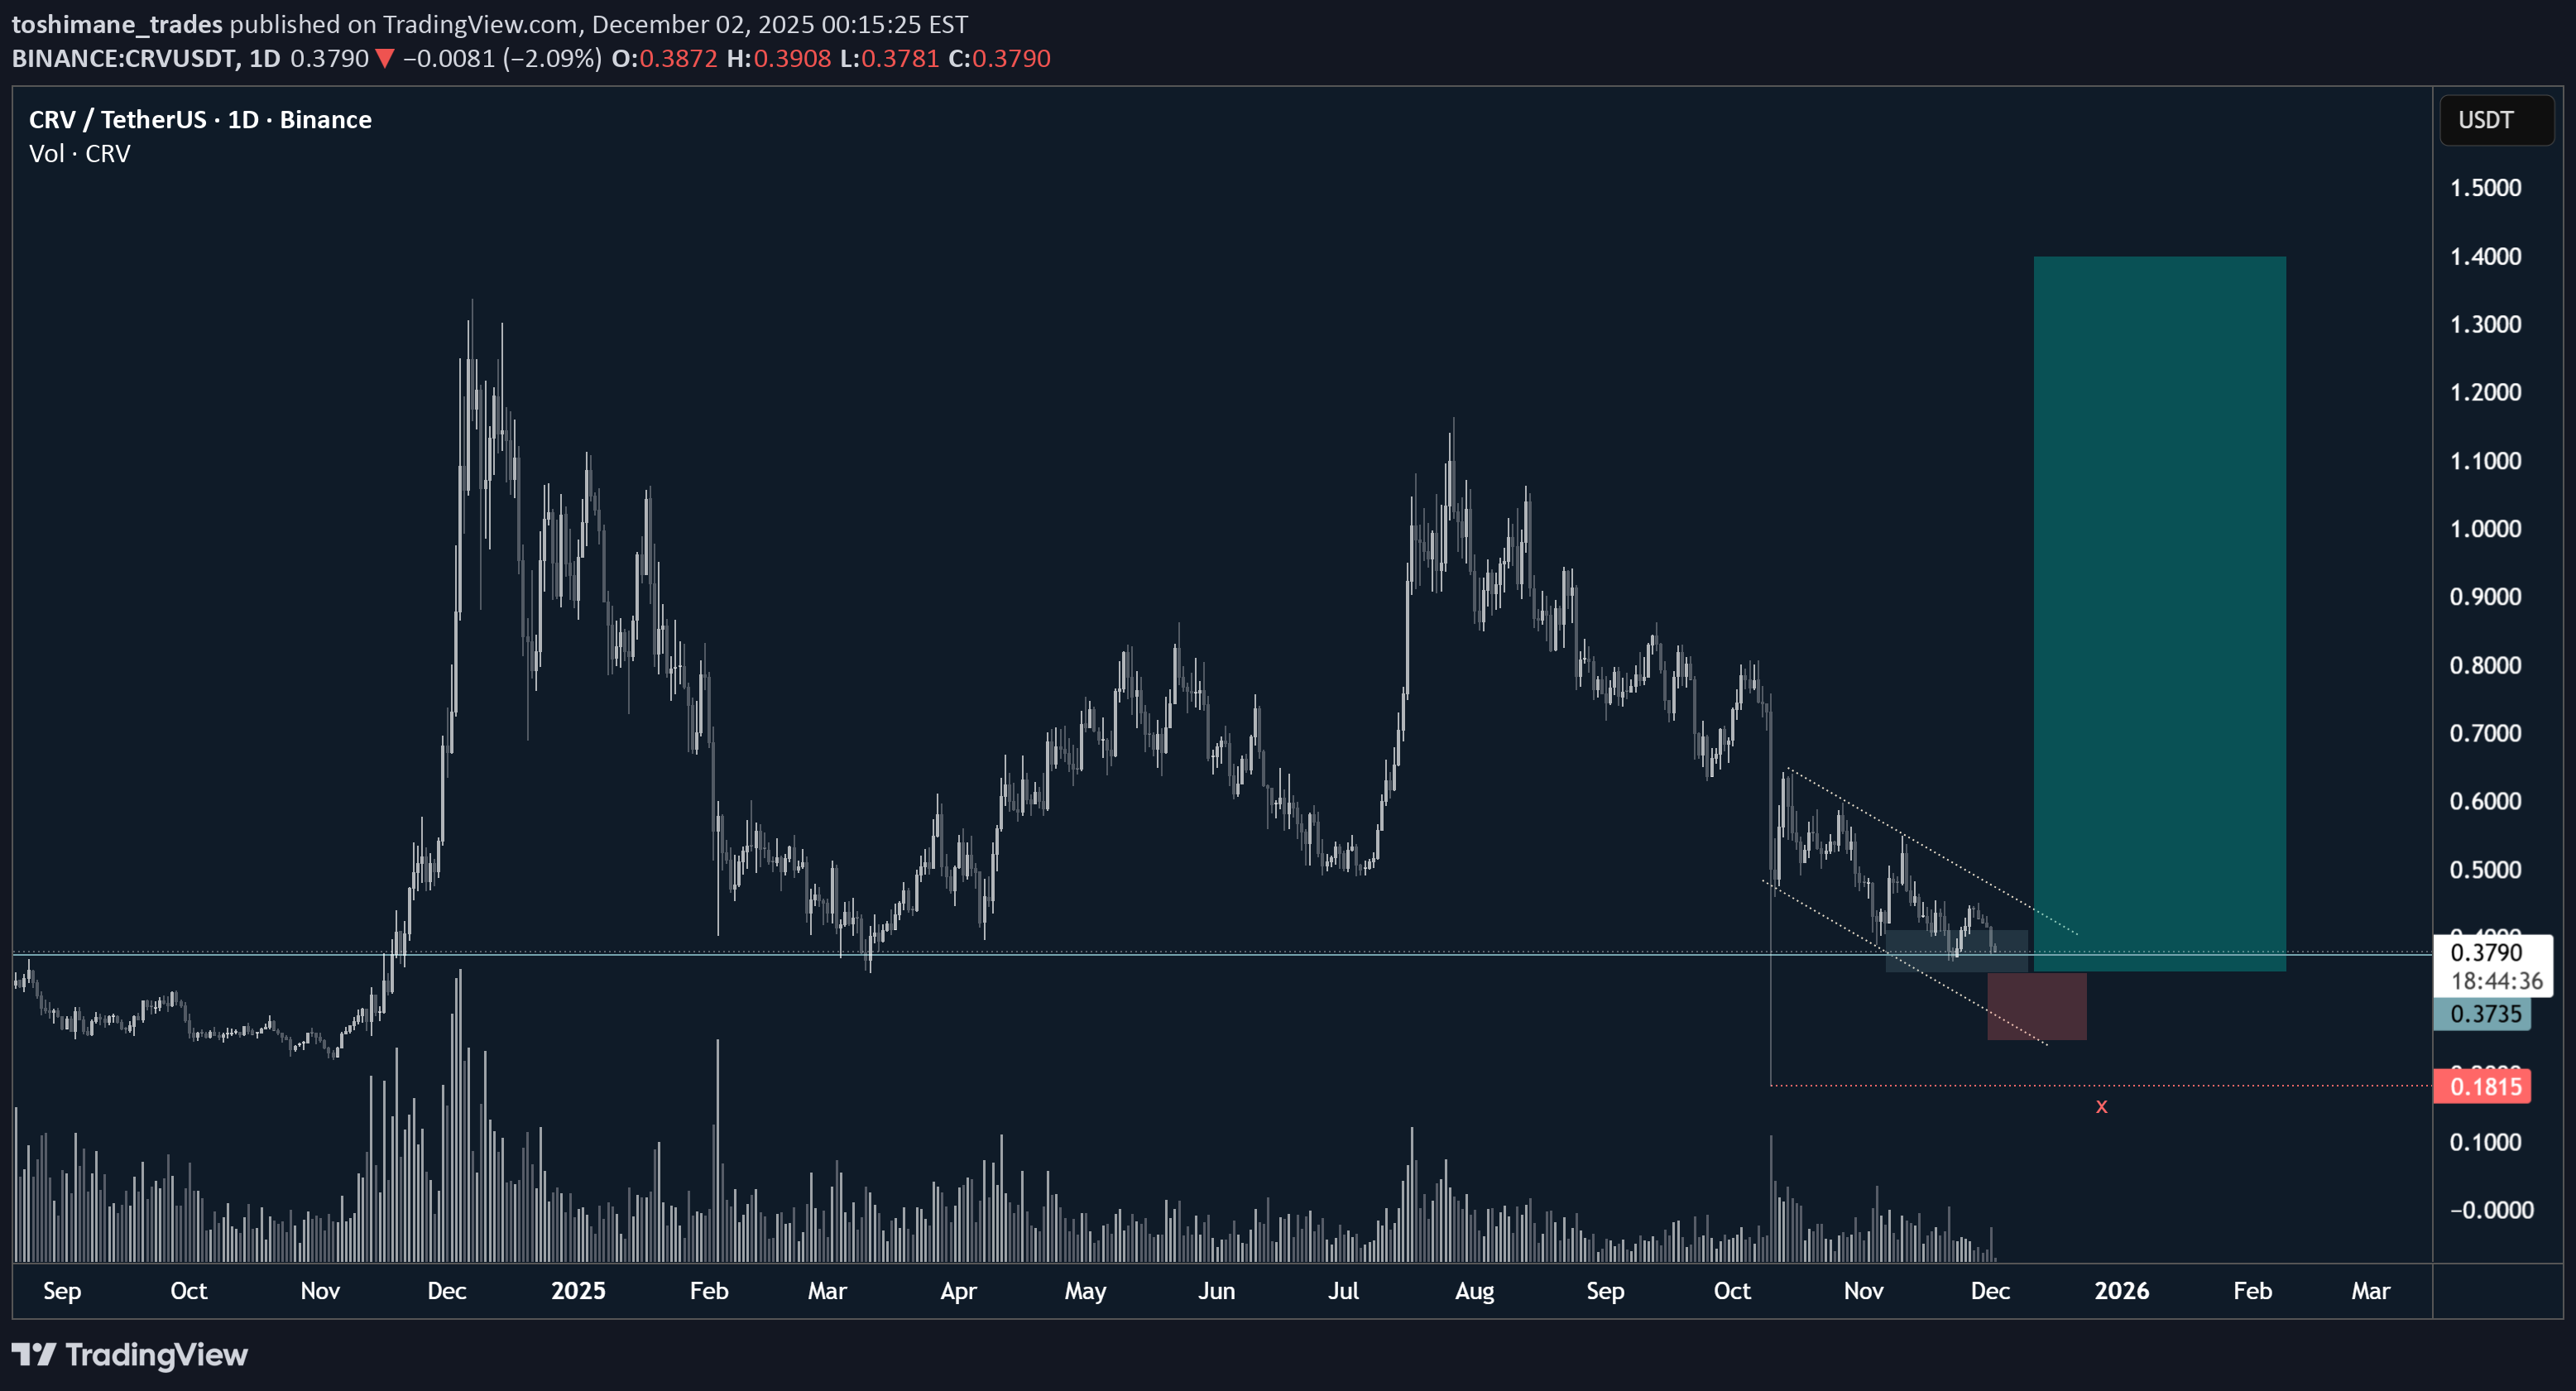
Power of 3 Setup Enter brief manipulation under .35 HTF support Reclaim .35 HTF support into expansion towards 1.4 target Invalidation / SL below wick low ~.18.38* HTF support
TRADEKING_1988
نقطه ورود طلایی CRV: حمایت قطعی پس از لمس فیبوناچی ۰.۶!

-Trendline retest Red -Fakeout green trendline -Liquidity taken and zone filled -Fib 0.6 allready touched so valid support

Bithereum_io
تحلیل تکنیکال CRV: فرصت خرید در محدوده حمایت یا انفجار قیمتی به سمت 0.73 دلار؟
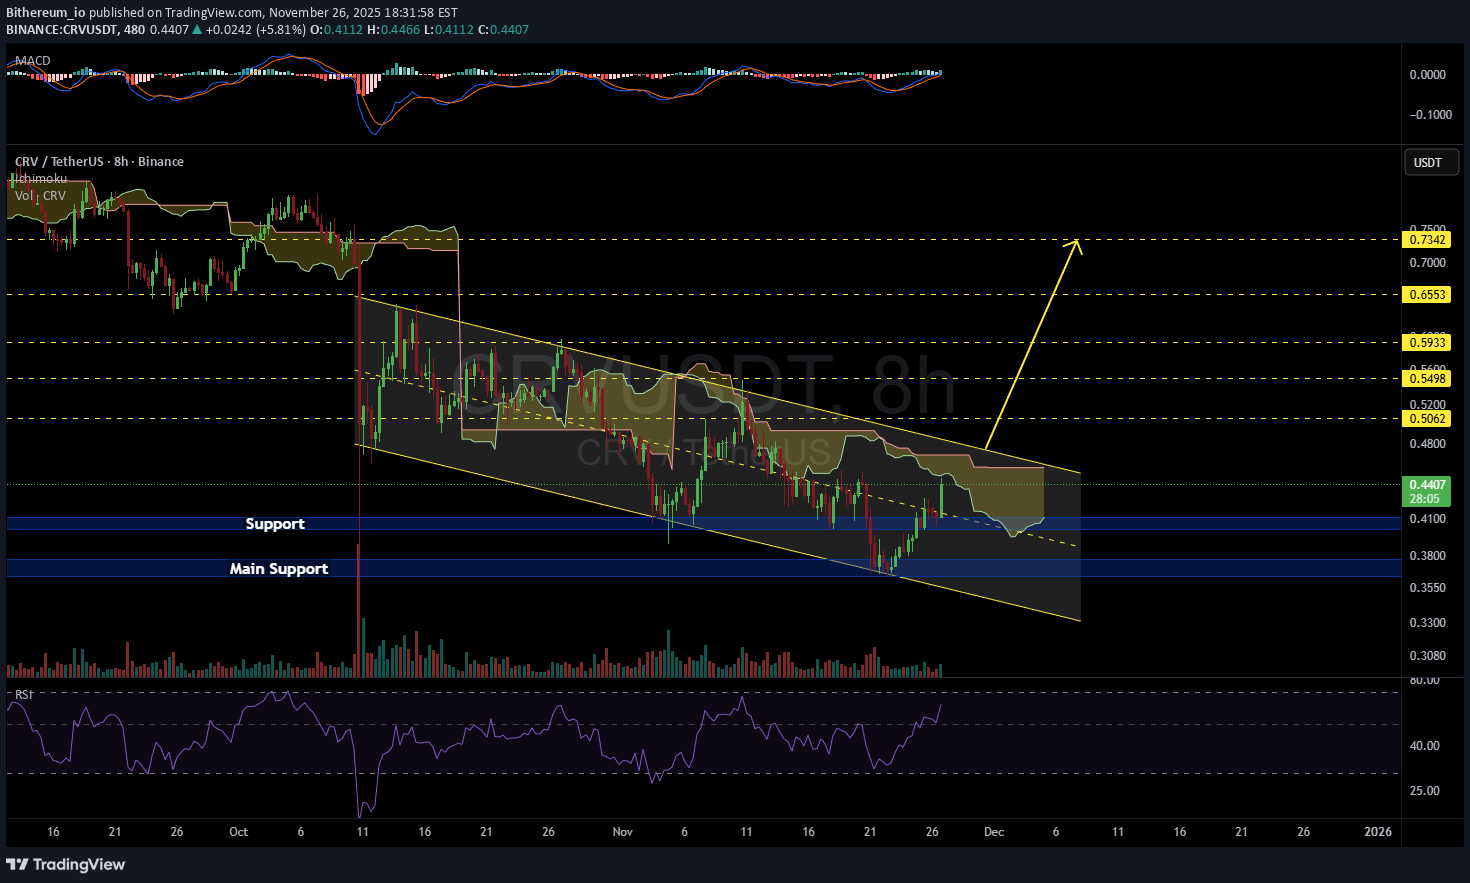
#CRV is moving inside a descending channel on the 8H timeframe and is currently facing the Ichimoku cloud. You can buy a small bag near the support zones shown on the chart. In case of a breakout above both the channel resistance and the Ichimoku cloud, the potential targets are: 🎯 $0.5062 🎯 $0.5498 🎯 $0.5933 🎯 $0.6553 🎯 $0.7342 ⚠️ Always remember to protect your capital with a proper stop-loss and disciplined risk management.

EhsanFibo
تحلیل CRV: آیا صعود متوقف میشود؟ هدف بعدی $0.4150!
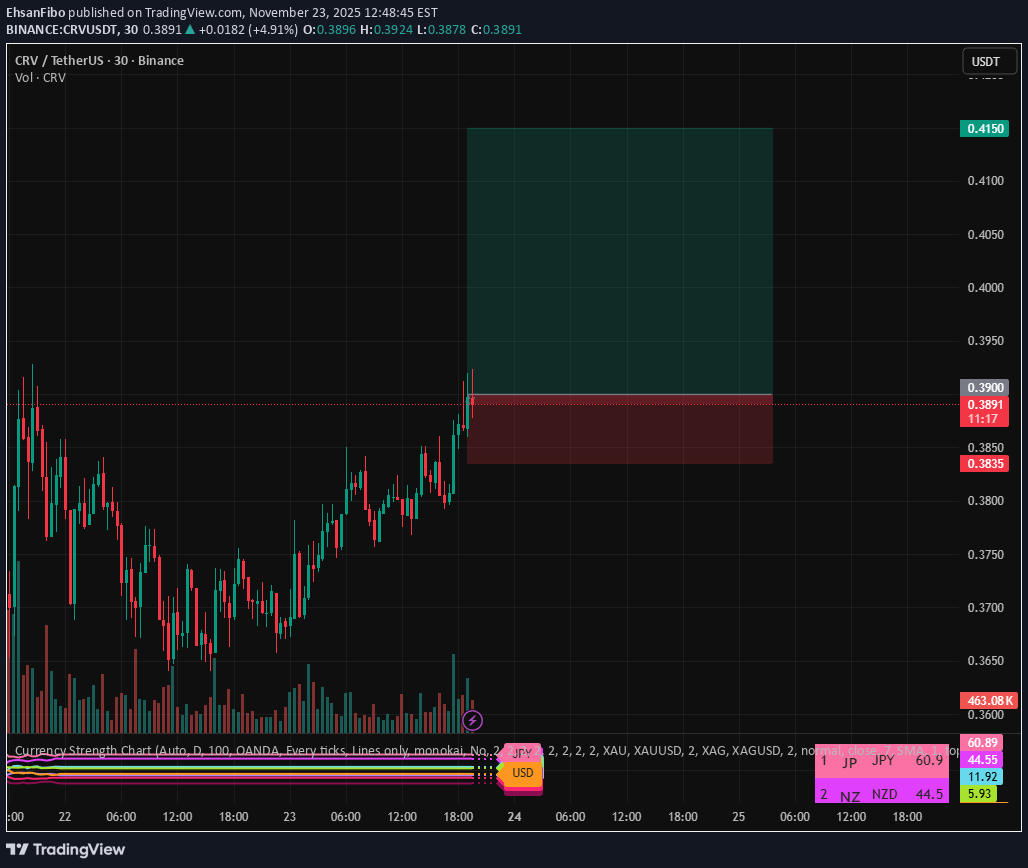
CRV/USDT Long: Targeting a move to $0.4150 after breaking key resistance around $0.3920. Reason: Confirmed Resistance-Turns-Support (RTS) pattern, offering a high-probability entry near the retest. Confirmation: The breakout was backed by above-average volume and a surge in bullish momentum.

LucidWRLD
خرید CRV در کف قیمت: مسیر صعودی تا ۶ دلار با استراتژی خرید و نگهداری ساده

CryptoHotep
پیشنهاد طلایی خرید CRV: آیا این بازی دیفای به اوج بازمیگردد؟
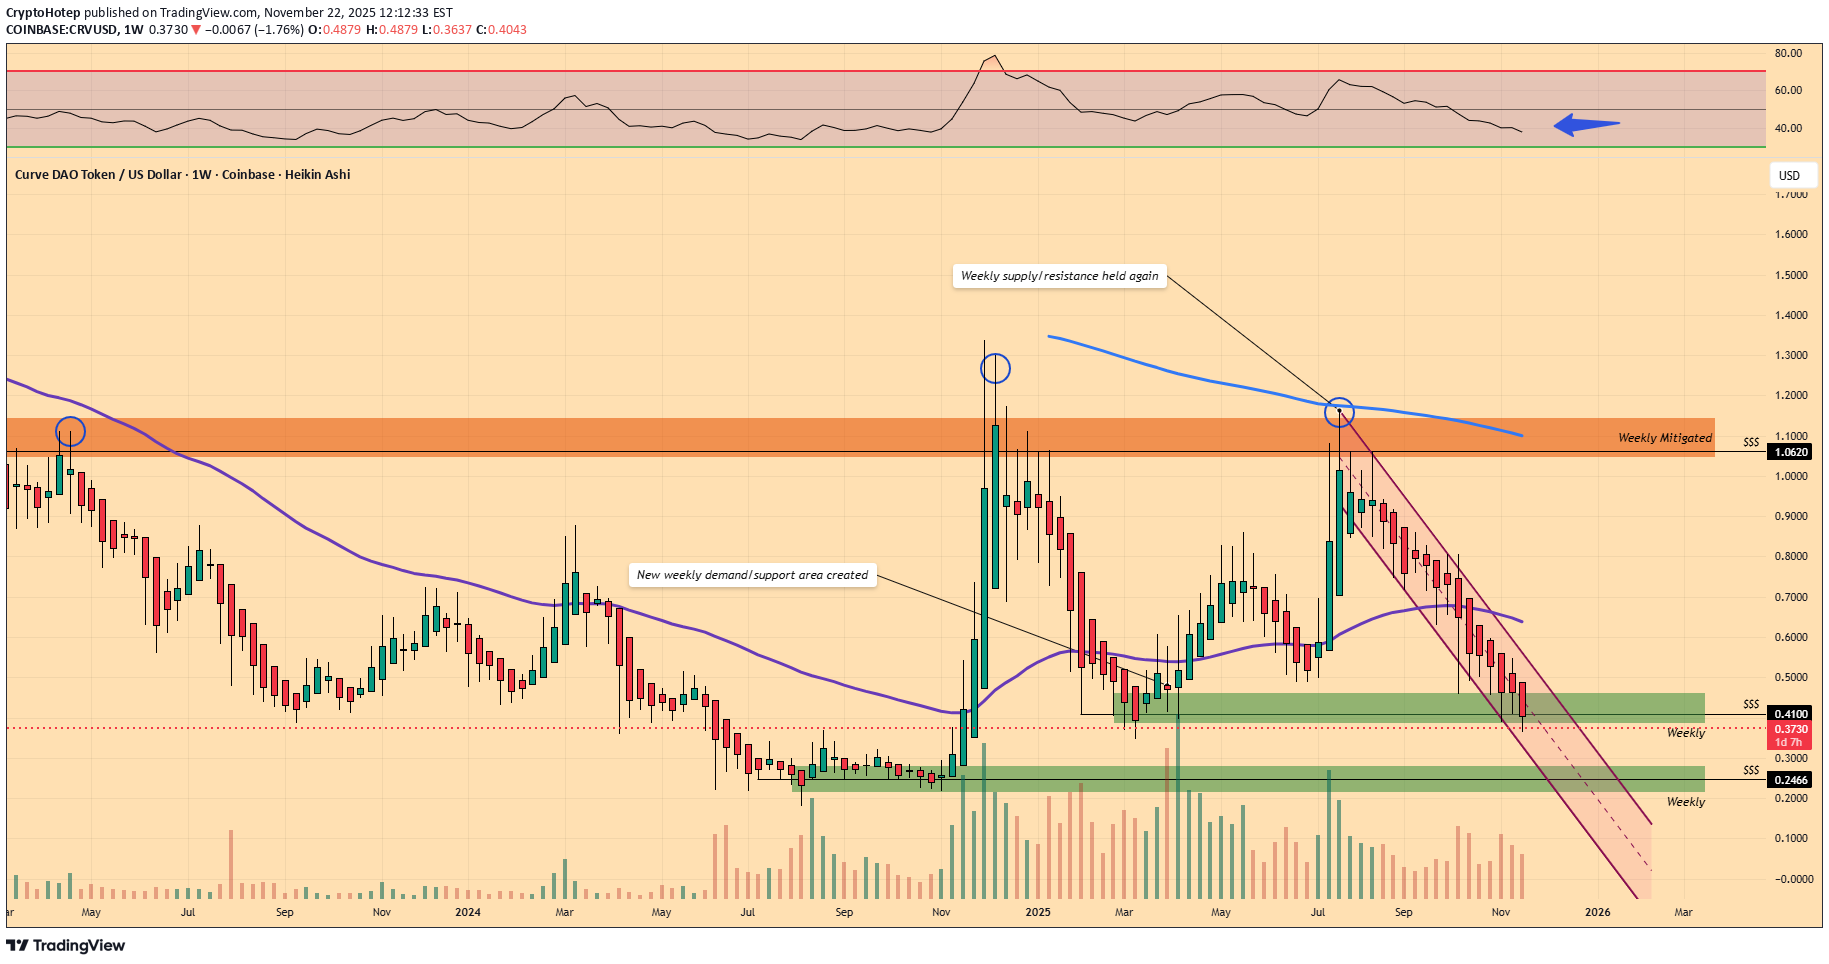
Called the move back in May and we are back (due to the weekly resistance/supply holding) retesting a fresh weekly demand/support zone trading below the 50MA. Hello old friend. ..still a good place to accumulate spot here (once I see buyers) for a quality project.
Disclaimer
Any content and materials included in Sahmeto's website and official communication channels are a compilation of personal opinions and analyses and are not binding. They do not constitute any recommendation for buying, selling, entering or exiting the stock market and cryptocurrency market. Also, all news and analyses included in the website and channels are merely republished information from official and unofficial domestic and foreign sources, and it is obvious that users of the said content are responsible for following up and ensuring the authenticity and accuracy of the materials. Therefore, while disclaiming responsibility, it is declared that the responsibility for any decision-making, action, and potential profit and loss in the capital market and cryptocurrency market lies with the trader.