
BB
BounceBit
| تریدر | نوع سیگنال | حد سود/ضرر | زمان انتشار | مشاهده پیام |
|---|---|---|---|---|
No results found. | ||||
Price Chart of BounceBit
سود 3 Months :
سیگنالهای BounceBit
Filter
Sort messages by
Trader Type
Time Frame

Ren_MomentumTrader
سیگنال BB/USDT: راز موفقیت در سطوح کلیدی (LMT v2.0)

Key Level Zone: 0.17500 - 0.18500 LMT v2.0 detected. The setup looks promising—price previously trended upward with rising volume and momentum, then retested this zone cleanly. This presents an excellent reward-to-risk opportunity if momentum continues to align. Introducing LMT (Levels & Momentum Trading) - Over the past 3 years, I’ve refined my approach to focus more sharply on the single most important element in any trade: the KEY LEVEL. - While HMT (High Momentum Trading) served me well—combining trend, momentum, volume, and structure across multiple timeframes—I realized that consistently identifying and respecting these critical price zones is what truly separates good trades from great ones. - That insight led to the evolution of HMT into LMT – Levels & Momentum Trading. Why the Change? (From HMT to LMT) Switching from High Momentum Trading (HMT) to Levels & Momentum Trading (LMT) improves precision, risk control, and confidence by: - Clearer Entries & Stops: Defined key levels make it easier to plan entries, stop-losses, and position sizing—no more guesswork. - Better Signal Quality: Momentum is now always checked against a support or resistance zone—if it aligns, it's a stronger setup. - Improved Reward-to-Risk: All trades are anchored to key levels, making it easier to calculate and manage risk effectively. - Stronger Confidence: With clear invalidation points beyond key levels, it's easier to trust the plan and stay disciplined—even in tough markets. Whenever I share a signal, it’s because: - A high‐probability key level has been identified on a higher timeframe. - Lower‐timeframe momentum, market structure and volume suggest continuation or reversal is imminent. - The reward‐to‐risk (based on that key level) meets my criteria for a disciplined entry. ***Please note that conducting a comprehensive analysis on a single timeframe chart can be quite challenging and sometimes confusing. I appreciate your understanding of the effort involved. Important Note: The Role of Key Levels - Holding a key level zone: If price respects the key level zone, momentum often carries the trend in the expected direction. That’s when we look to enter, with stop-loss placed just beyond the zone with some buffer. - Breaking a key level zone: A definitive break signals a potential stop‐out for trend traders. For reversal traders, it’s a cue to consider switching direction—price often retests broken zones as new support or resistance. My Trading Rules (Unchanged) Risk Management - Maximum risk per trade: 2.5% - Leverage: 5x Exit Strategy / Profit Taking - Sell at least 70% on the 3rd wave up (LTF Wave 5). - Typically sell 50% during a high‐volume spike. - Move stop‐loss to breakeven once the trade achieves a 1.5:1 R:R. - Exit at breakeven if momentum fades or divergence appears. The market is highly dynamic and constantly changing. LMT signals and target profit (TP) levels are based on the current price and movement, but market conditions can shift instantly, so it is crucial to remain adaptable and follow the market's movement. If you find this signal/analysis meaningful, kindly like and share it. Thank you for your support~ Sharing this with love! From HMT to LMT: A Brief Version History HM Signal : Date: 17/08/2023 - Early concept identifying high momentum pullbacks within strong uptrends - Triggered after a prior wave up with rising volume and momentum - Focused on healthy retracements into support for optimal reward-to-risk setups HMT v1.0: Date: 18/10/2024 - Initial release of the High Momentum Trading framework - Combined multi-timeframe trend, volume, and momentum analysis. - Focused on identifying strong trending moves high momentum HMT v2.0: Date: 17/12/2024 - Major update to the Momentum indicator - Reduced false signals from inaccurate momentum detection - New screener with improved accuracy and fewer signals HMT v3.0: Date: 23/12/2024 - Added liquidity factor to enhance trend continuation - Improved potential for momentum-based plays - Increased winning probability by reducing entries during peaks HMT v3.1: Date: 31/12/2024 - Enhanced entry confirmation for improved reward-to-risk ratios HMT v4.0: Date: 05/01/2025 - Incorporated buying and selling pressure in lower timeframes to enhance the probability of trending moves while optimizing entry timing and scaling HMT v4.1: Date: 06/01/2025 - Enhanced take-profit (TP) target by incorporating market structure analysis HMT v5 : Date: 23/01/2025 - Refined wave analysis for trending conditions - Incorporated lower timeframe (LTF) momentum to strengthen trend reliability - Re-aligned and re-balanced entry conditions for improved accuracy HMT v6 : Date : 15/02/2025 - Integrated strong accumulation activity into in-depth wave analysis HMT v7 : Date : 20/03/2025 - Refined wave analysis along with accumulation and market sentiment HMT v8 : Date : 16/04/2025 - Fully restructured strategy logic HMT v8.1 : Date : 18/04/2025 - Refined Take Profit (TP) logic to be more conservative for improved win consistency LMT v1.0 : Date : 06/06/2025 - Rebranded to emphasize key levels + momentum as the core framework LMT v2.0 Date: 11/06/2025 - Fully restructured lower timeframe (LTF) momentum logic

Cryptojobs
تحلیل تکنیکال قوی: آیا حرکت صعودی جدید BB آغاز شده است؟

BB - morning view vs now ... 🔥 11% up already, is it just getting started?? 👀 TA & FA are solid🚀

GOLDCASINO
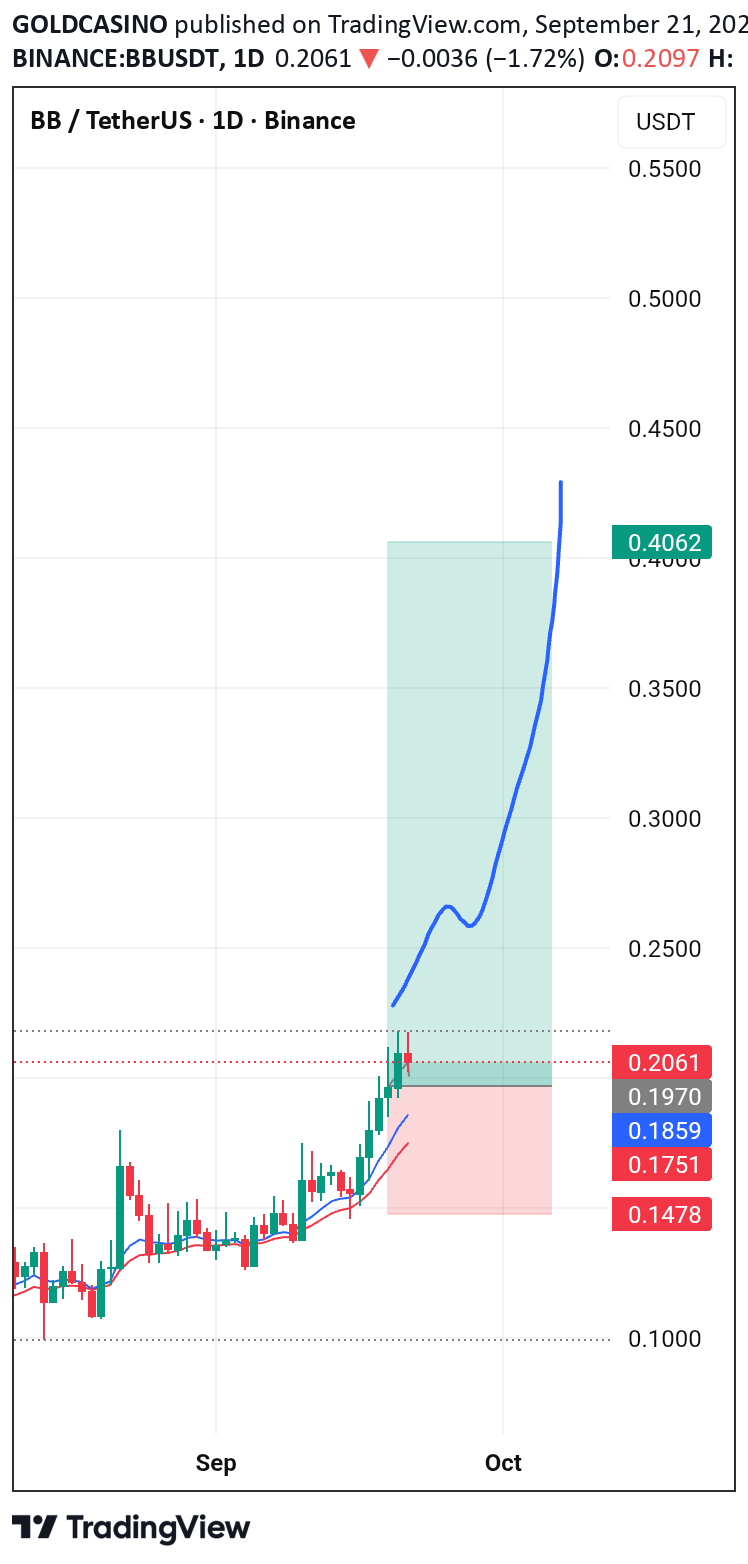
#BBUSDT looks promising for a spot buy with potential for 2x-3x gains in 3-4 weeks. A breakout above $0.23 could push the price towards $0.40 , $0.60 and. Manage your risk

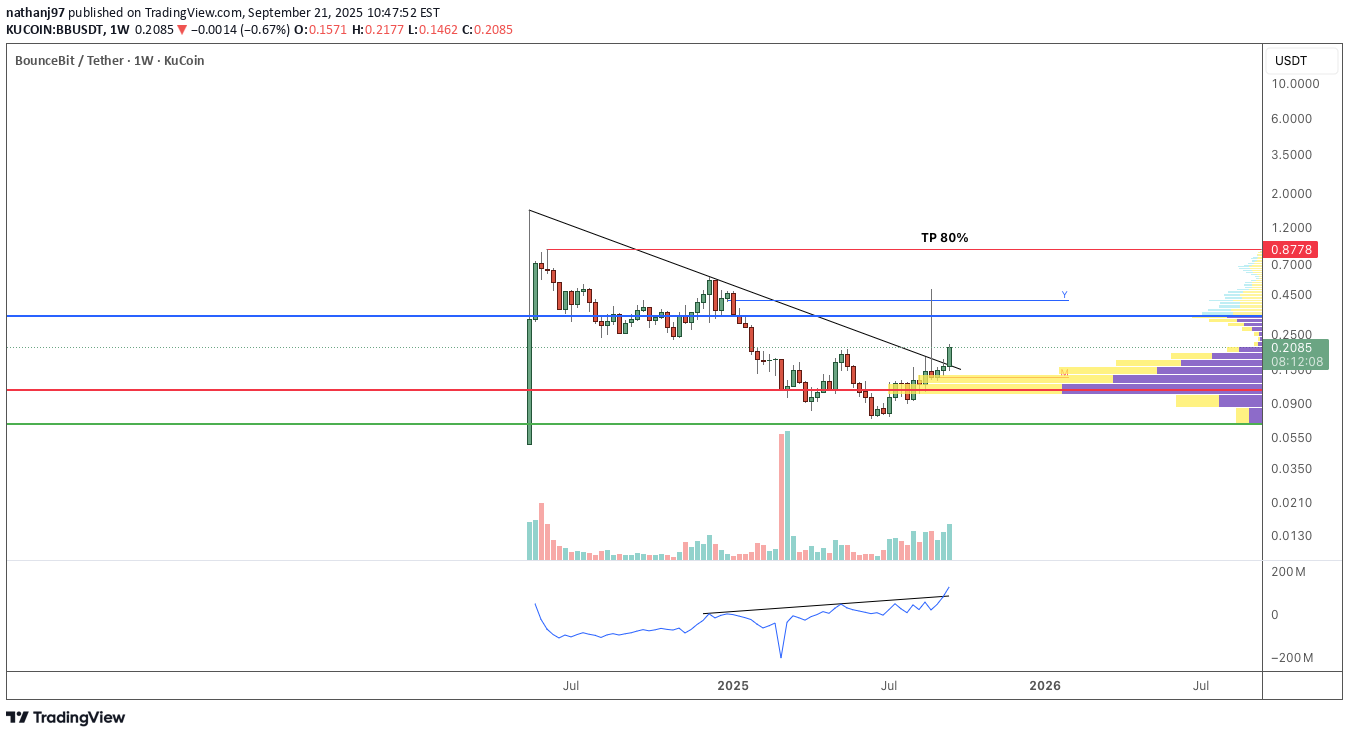
nathanj97

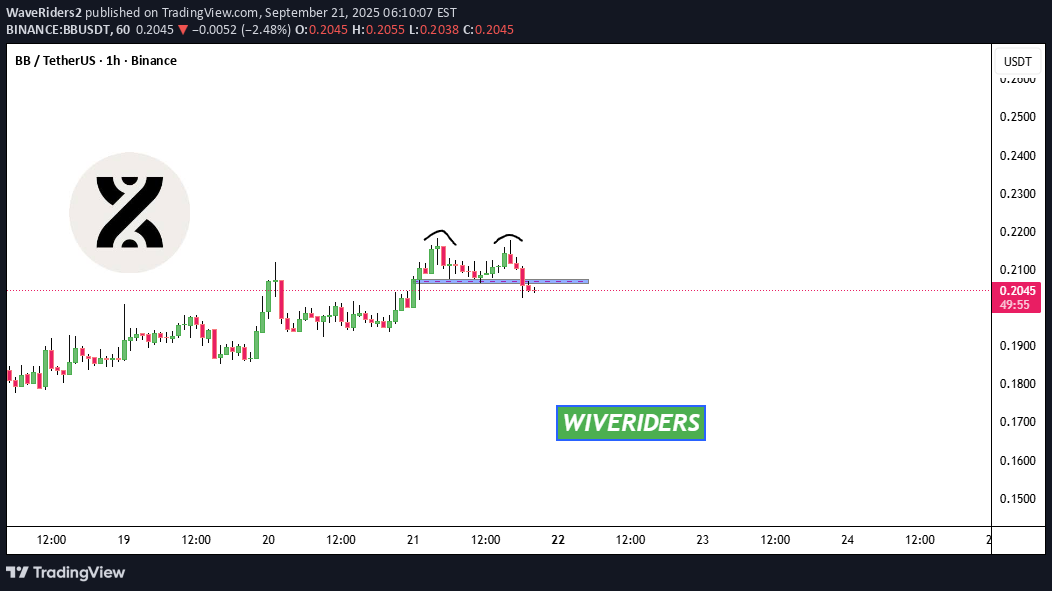
WaveRiders2

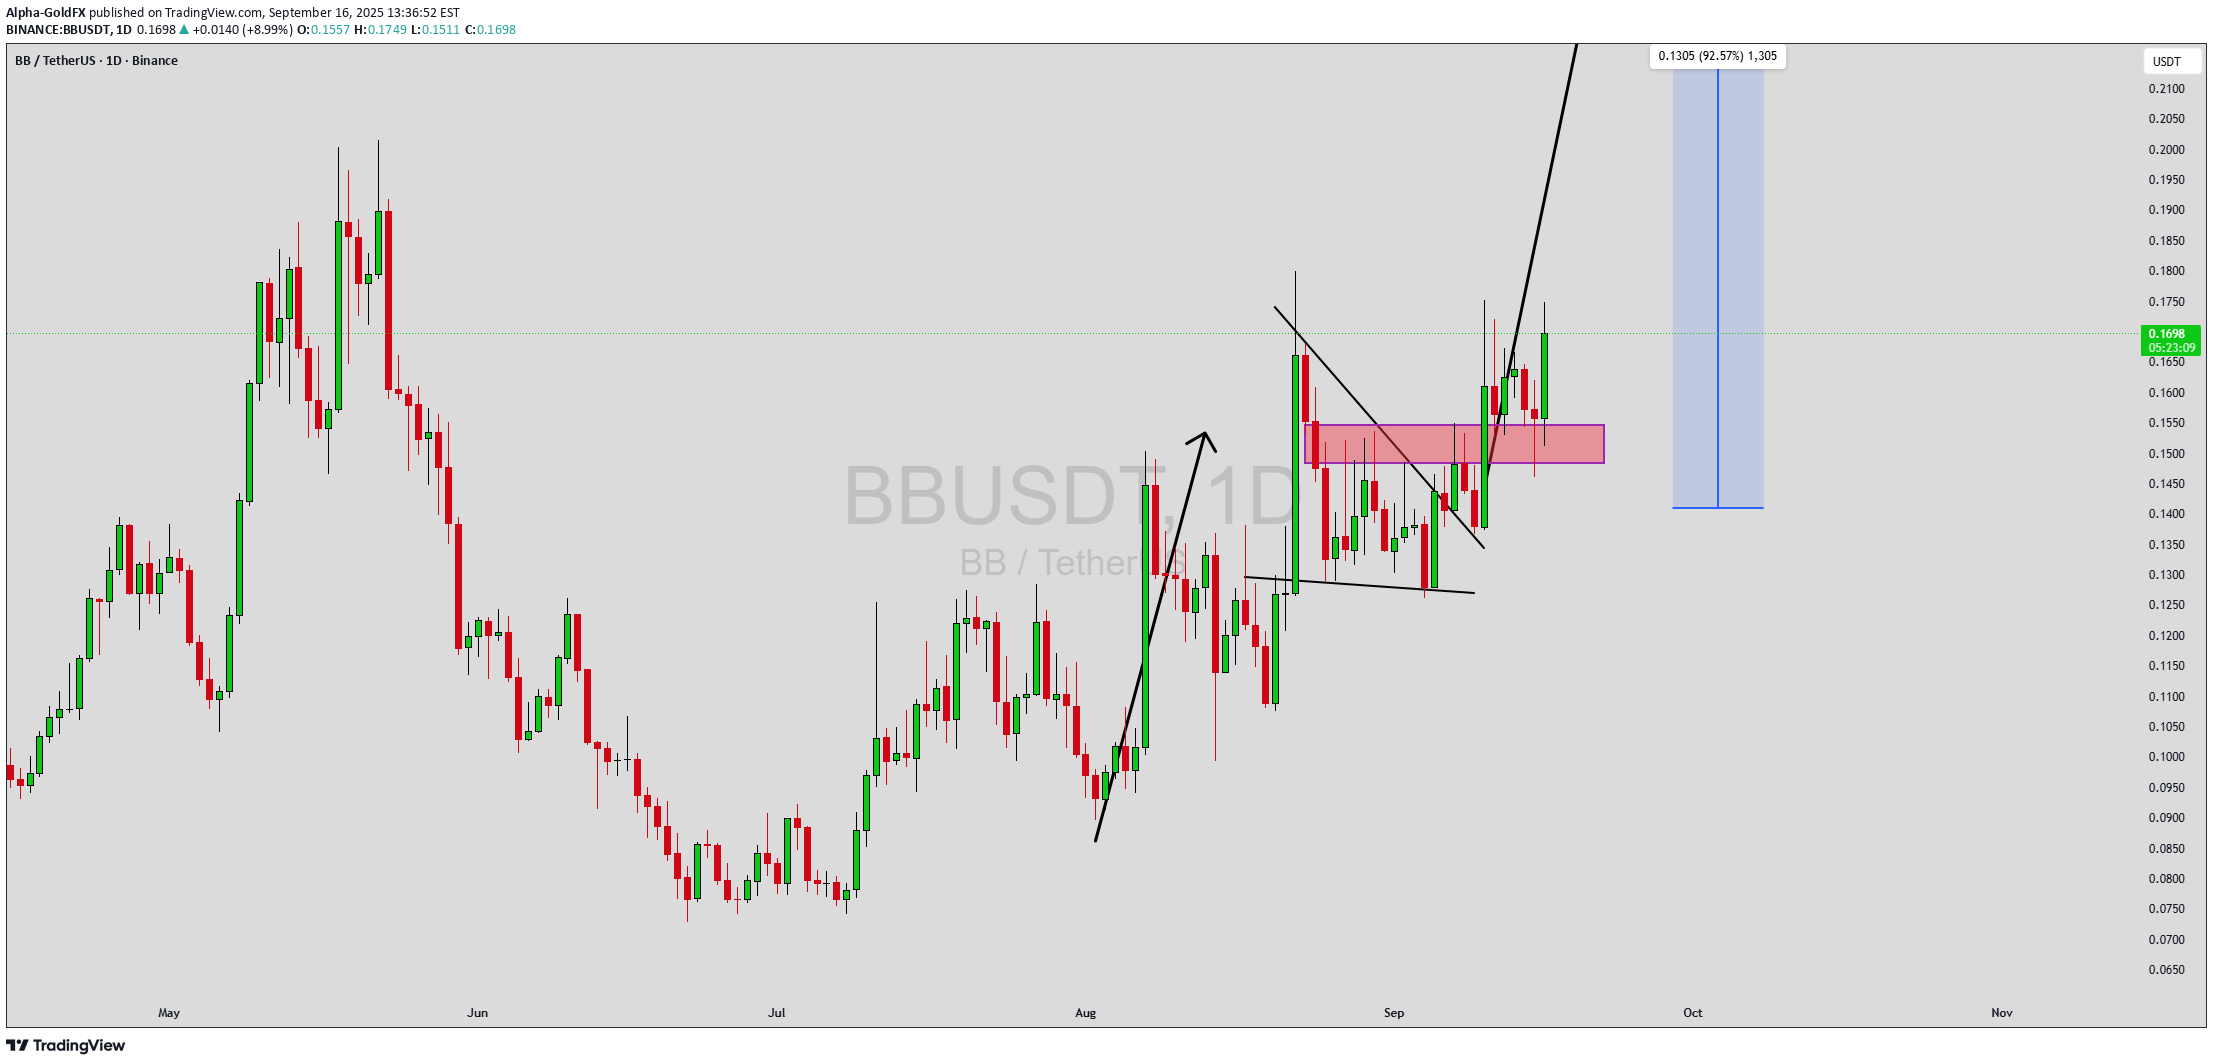
Alpha-GoldFX
BBUSDT is showing a powerful bullish wave pattern, which often signals the start of a strong upward momentum phase. The price structure suggests that buyers are steadily gaining control, pushing the market toward higher resistance zones. With good trading volume supporting this move, the setup looks favorable for an extended rally. The combination of pattern formation and volume activity highlights strong participation from market players. Current projections point to a potential gain of 80% to 90%+, making BBUSDT one of the more attractive opportunities in the market right now. Such wave patterns are typically driven by momentum traders and investors positioning themselves ahead of larger market expansions. The breakout momentum can accelerate once key resistance levels are cleared, opening the path for rapid price appreciation. Investor interest in BBUSDT is also increasing, as shown by rising liquidity and consistent accumulation phases. This growing demand may provide the fuel for a sustained uptrend in the coming sessions. If momentum continues, BBUSDT could outperform many other pairs and deliver significant short to mid-term returns. ✅ Show your support by hitting the like button and ✅ Leaving a comment below! (What is You opinion about this Coin) Your feedback and engagement keep me inspired to share more insightful market analysis with you!

ZEUS_Market_Alerts
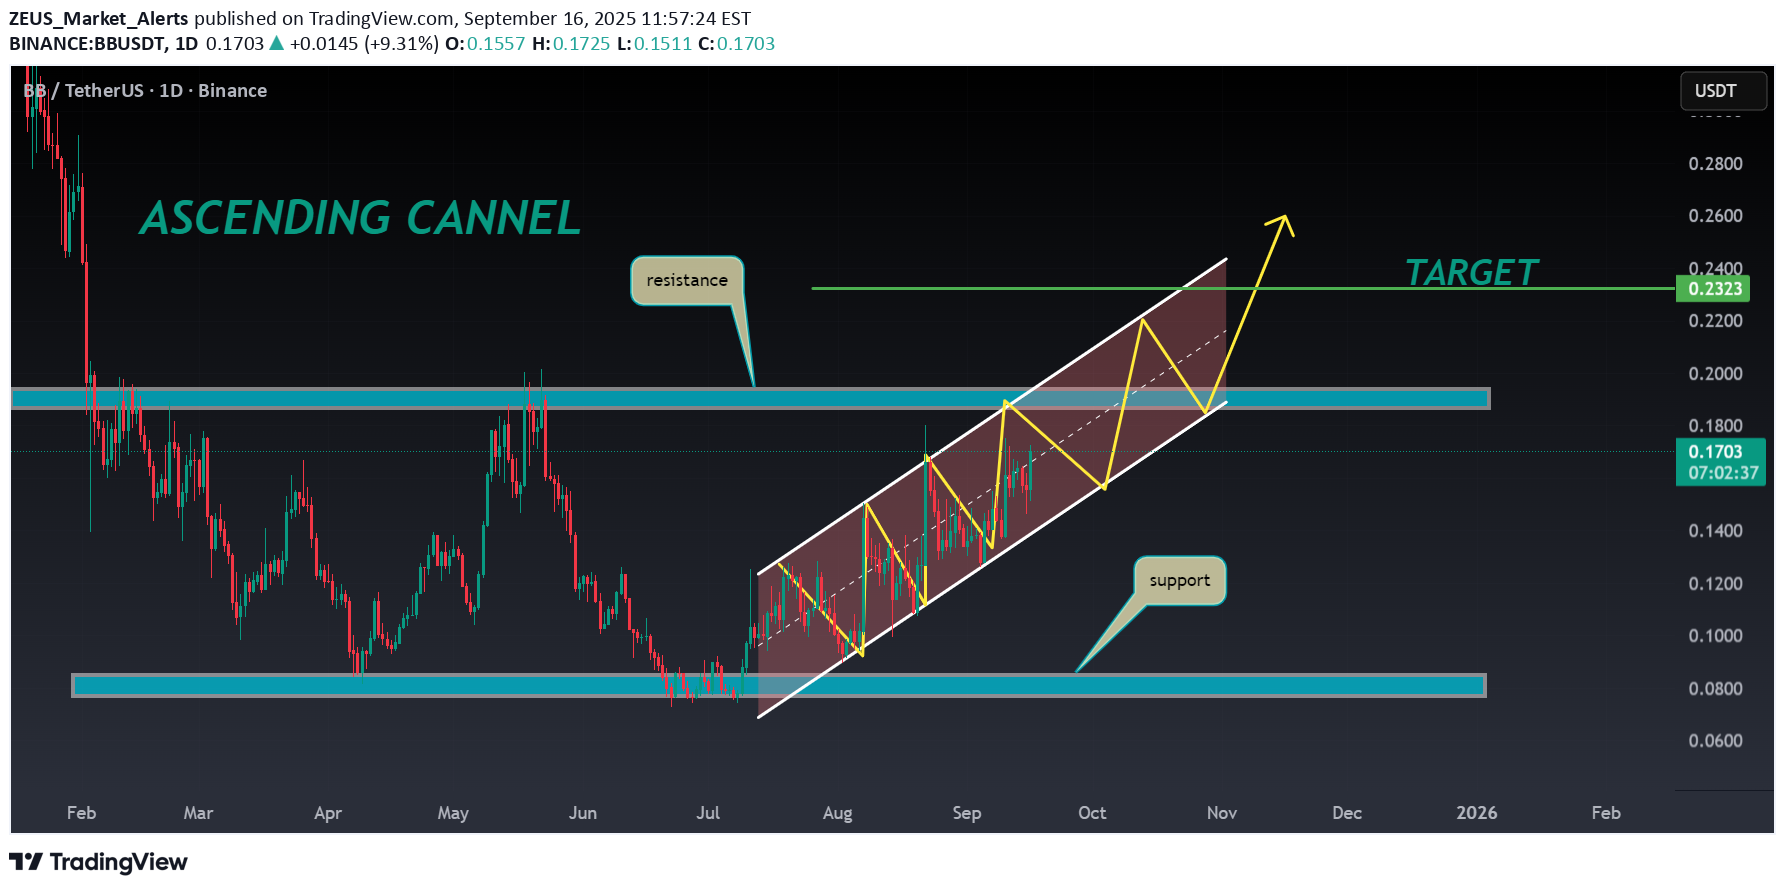
🔆#BB Analysis : Channel Following ⛔️⛔️ As we can see that #BB is following ascending channel on daily time frame. We can see a bullish formation here. And if it trade with good volume then we can see a proper bullish move in #BB 📈📈 Also there is an instant resistance zone and if it breaks with good volume when we would see a huge movement 🔖 Current Price: $0.1714 ⏳ Target Price: $0.2323 ⁉️ What to do? - Keep your eyes on the chart, observe trading volume and stay accustom to market moves.🚀💸 #BB #Cryptocurrency #ChartPattern #DYOR

unichartz
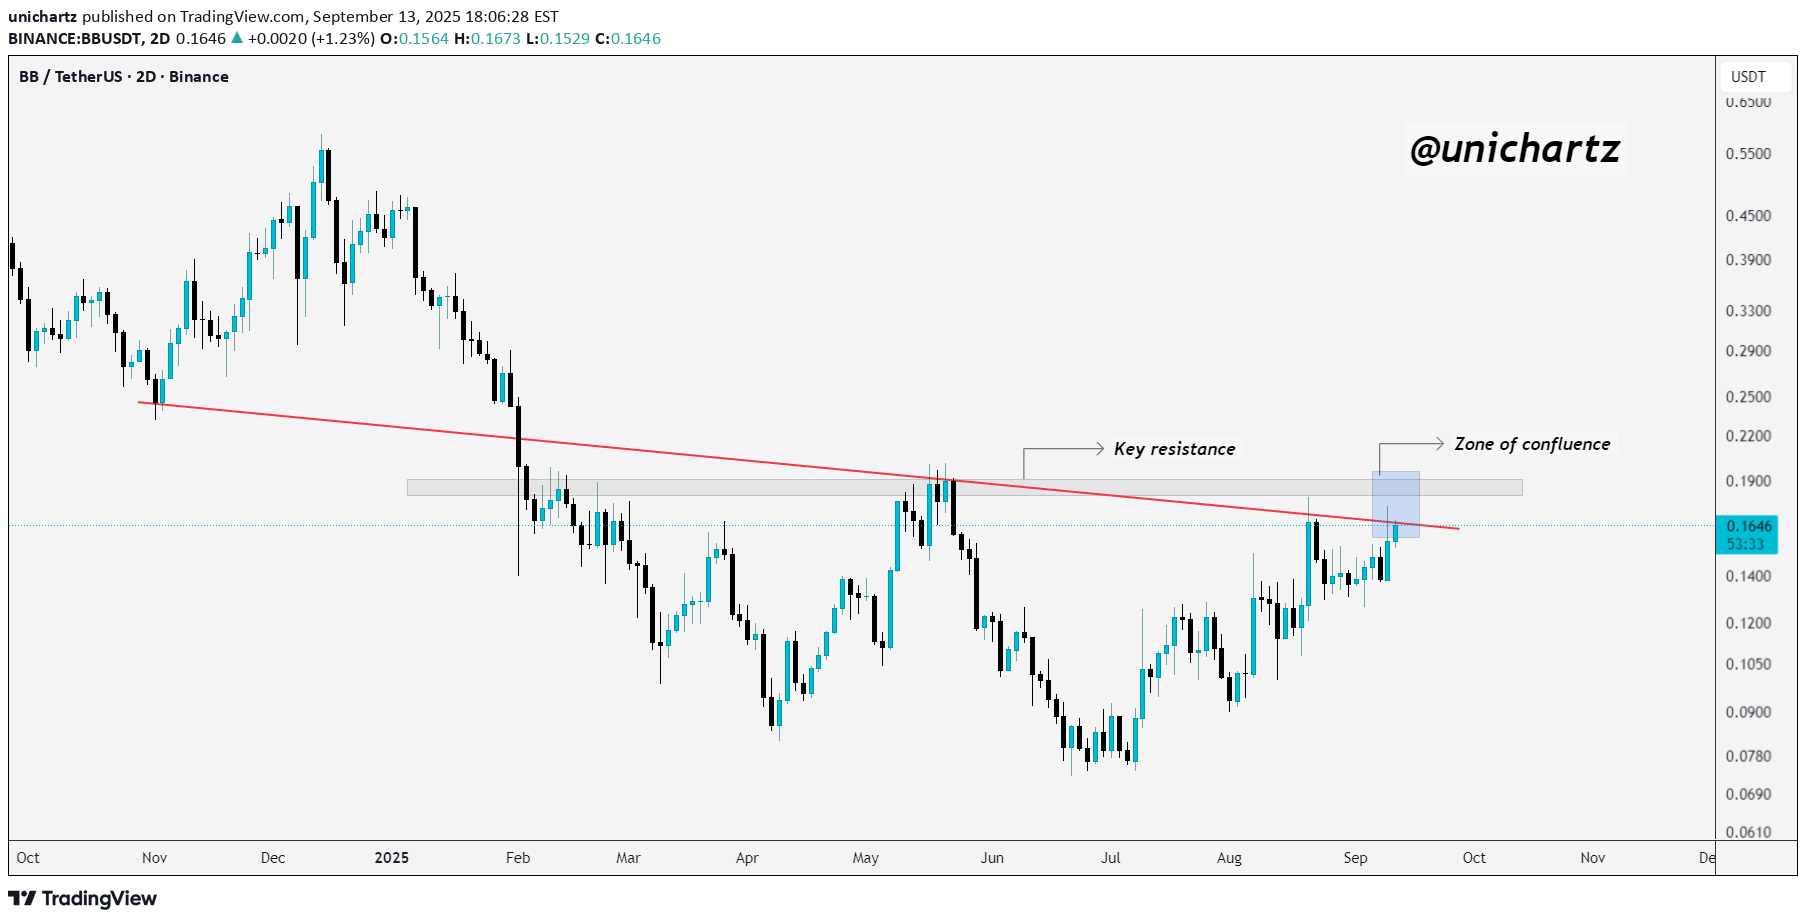
B BB/USDT is right at a crucial confluence zone where the downtrend resistance and horizontal supply overlap. Buyers have been pushing price higher, but this area is acting as a real test. If BB manages to break and close above this zone with strength, it could fuel a strong rally as momentum shifts in favor of the bulls. On the other hand, failure to clear this resistance might lead to another rejection, keeping price stuck in the range. In simple words: this is the make-or-break moment, watch closely for a breakout confirmation before calling the next big move.
Alpha-GoldFX
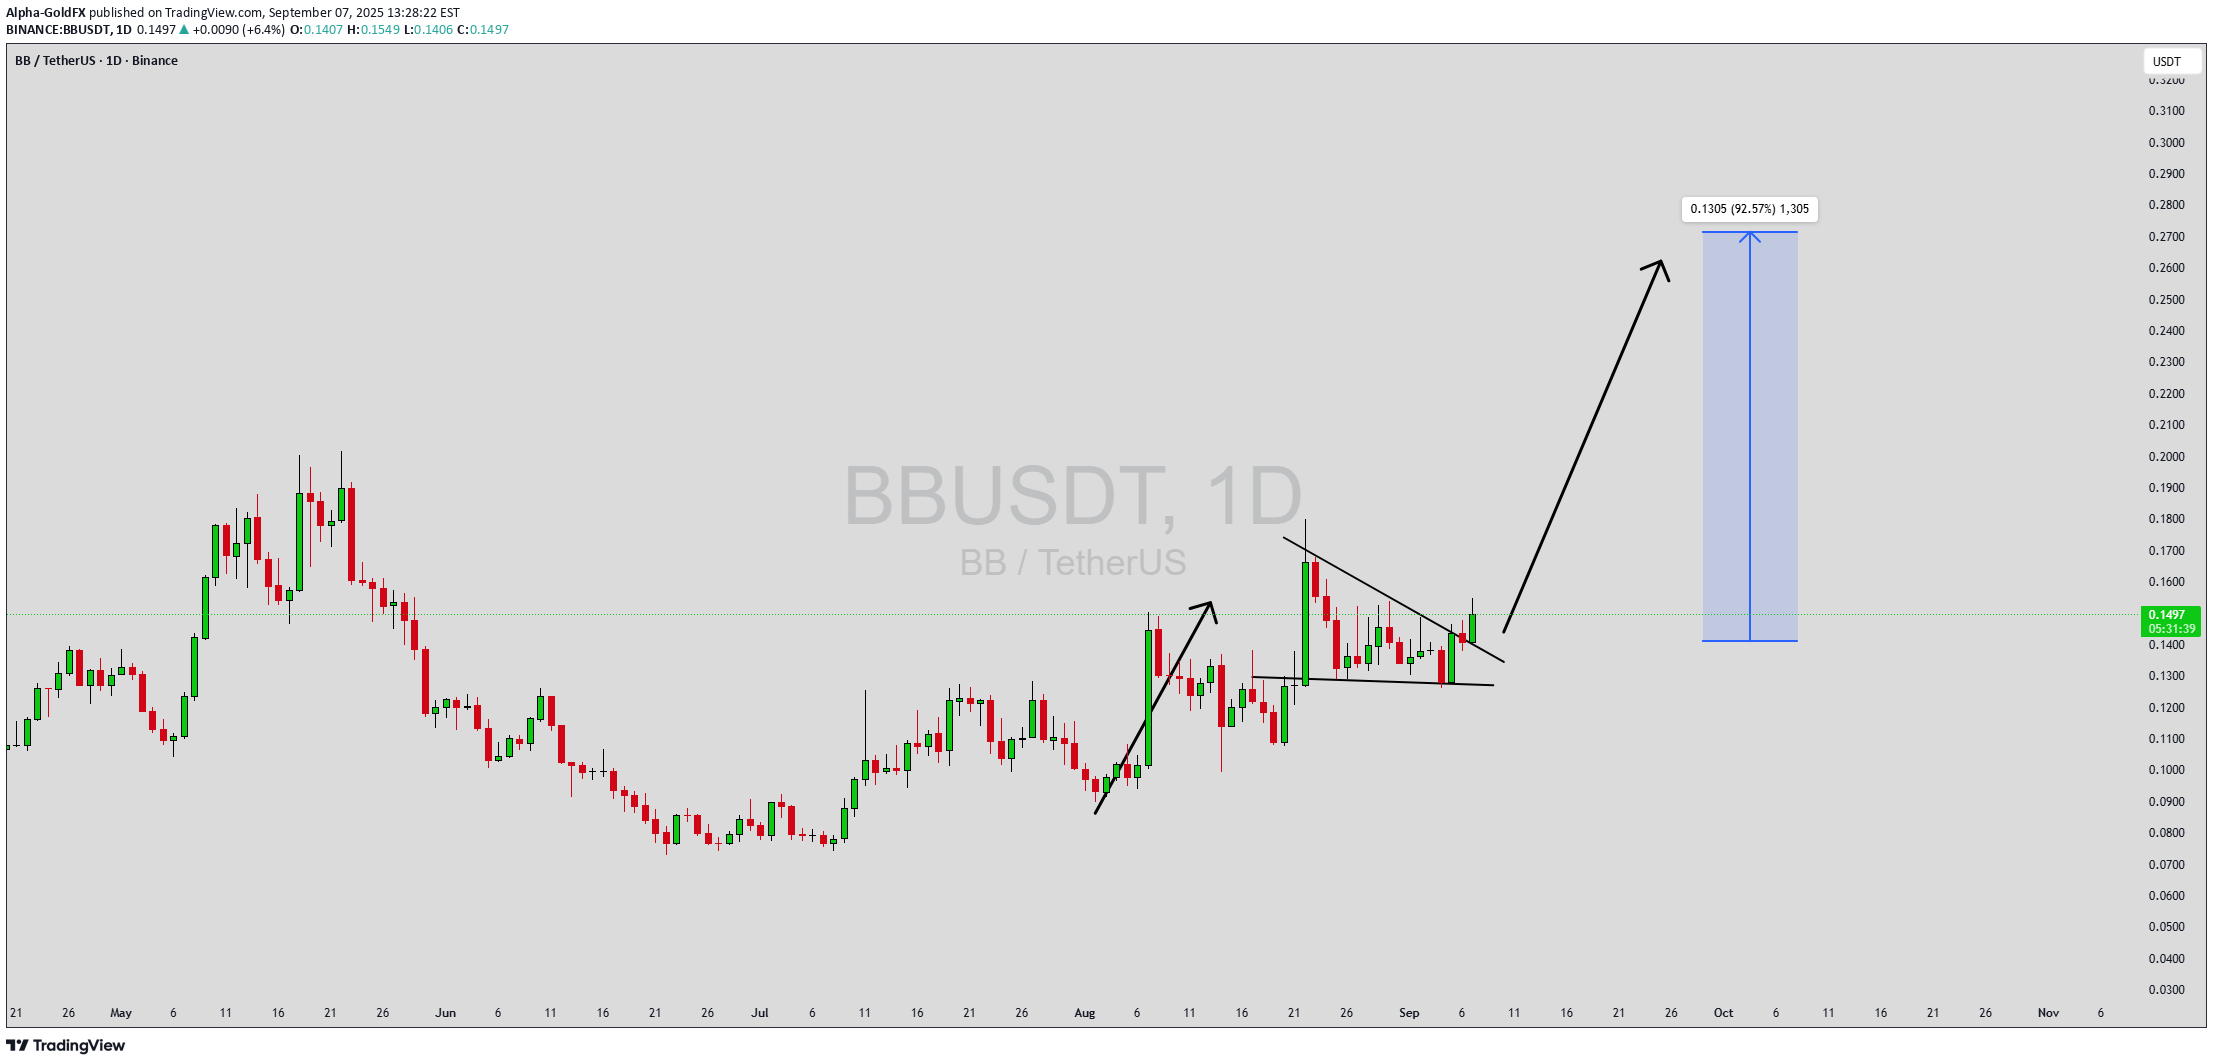
BBUSDT is currently displaying a bullish setup as it forms a falling wedge pattern, a classic reversal structure that often precedes significant upward momentum. This formation, coupled with strong buying interest, suggests that the market could be preparing for a major breakout move. With volume showing healthy participation, the technical picture supports an optimistic scenario, potentially driving the pair toward an 80% to 90% gain in the coming sessions. The recent trading activity highlights that investors are accumulating positions at key support levels, showing confidence in the strength of the project. A breakout above the wedge resistance could open the path to higher price zones, with market sentiment likely pushing BBUSDT into a strong rally phase. This aligns with the overall bullish tone observed across altcoins, where patterns like falling wedges are signaling trend reversals. Investor interest in BBUSDT is steadily increasing, which further validates the bullish outlook. The consistent inflow of volume strengthens the probability of sustained price action once the breakout gains momentum. Such setups tend to attract both short-term traders looking for quick gains and long-term holders expecting larger price expansions. In conclusion, BBUSDT is shaping up as a strong bullish opportunity with its falling wedge breakout potential, solid volume, and rising investor interest. If momentum continues, the coin could deliver a powerful upside move of 80% to 90%+, making it one of the attractive setups to keep on the radar. ✅ Show your support by hitting the like button and ✅ Leaving a comment below! (What is You opinion about this Coin) Your feedback and engagement keep me inspired to share more insightful market analysis with you!
Alpha-GoldFX
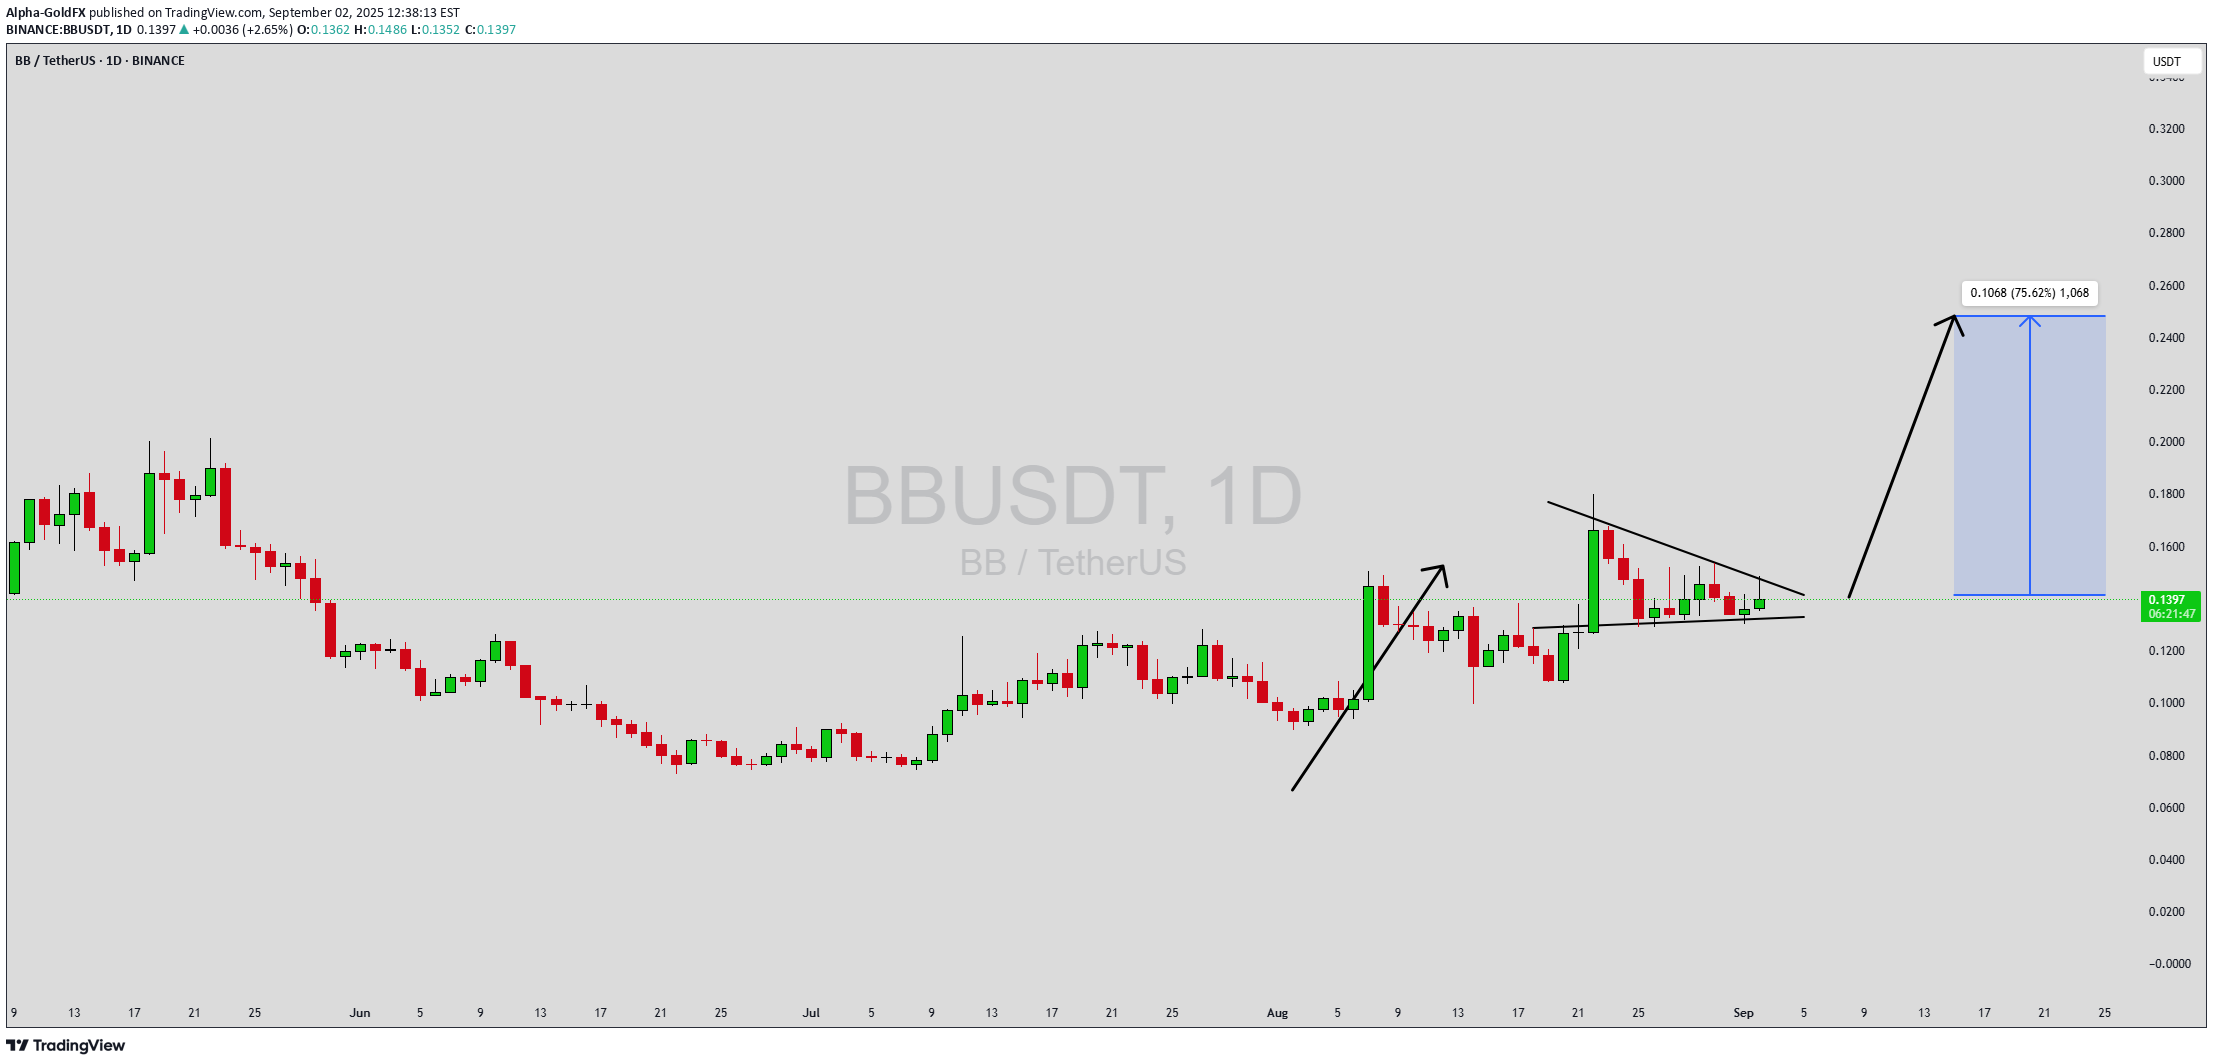
BBUSDT is currently shaping a bullish pennant pattern, which is often viewed as a continuation signal after a strong upward move. This formation usually reflects a period of consolidation before price resumes its upward trajectory. With good trading volume confirming market participation, the potential for a breakout is strong, and the projected target points toward a gain of around 60% to 70%+. Such a setup highlights an exciting opportunity for traders who follow technical breakouts in the crypto market. The bullish pennant suggests that market participants are accumulating positions while waiting for the next impulsive move. The narrowing range indicates a build-up of momentum, and once resistance is cleared, it can lead to a swift rally. Historically, this pattern has proven effective in signaling powerful bullish moves, which makes BBUSDT an attractive setup for short to medium-term strategies. Investor interest in this project is also increasing, with rising engagement signaling confidence in the potential upside. As technical indicators align with solid market sentiment, BBUSDT could be preparing for a significant rally. Traders should watch closely for confirmation of a breakout, as it may signal the start of a strong bullish continuation phase. ✅ Show your support by hitting the like button and ✅ Leaving a comment below! (What is You opinion about this Coin) Your feedback and engagement keep me inspired to share more insightful market analysis with you!
Disclaimer
Any content and materials included in Sahmeto's website and official communication channels are a compilation of personal opinions and analyses and are not binding. They do not constitute any recommendation for buying, selling, entering or exiting the stock market and cryptocurrency market. Also, all news and analyses included in the website and channels are merely republished information from official and unofficial domestic and foreign sources, and it is obvious that users of the said content are responsible for following up and ensuring the authenticity and accuracy of the materials. Therefore, while disclaiming responsibility, it is declared that the responsibility for any decision-making, action, and potential profit and loss in the capital market and cryptocurrency market lies with the trader.