
ASTR
Astar
| تریدر | نوع سیگنال | حد سود/ضرر | زمان انتشار | مشاهده پیام |
|---|---|---|---|---|
No results found. | ||||
Price Chart of Astar
سود 3 Months :
سیگنالهای Astar
Filter
Sort messages by
Trader Type
Time Frame

Alpha-GoldFX
هشدار صعودی بزرگ: آیا آستروسافت (ASTR) آماده انفجار 60 درصدی است؟ (الگوی گوه نزولی)

ASTRUSDT is forming a well-defined falling wedge pattern on the chart, a bullish setup that often signals an upcoming reversal after a period of downward consolidation. The narrowing price action suggests that sellers are losing momentum while buyers are gradually stepping in. This setup becomes even more convincing with the presence of good trading volume, which indicates that investors are accumulating positions in anticipation of a potential breakout. If the resistance trendline is breached, ASTRUSDT could experience a sharp move upward, with gains estimated in the 50% to 60% range. The falling wedge is one of the most reliable bullish reversal patterns, and ASTRUSDT’s price structure fits it perfectly. Each dip has been met with increasing buying pressure, showing that the market sentiment is shifting from bearish to bullish. A confirmed breakout above the wedge could trigger a significant rally, supported by strong investor interest and improving market liquidity. Traders are closely watching this zone for a breakout confirmation to ride the next bullish wave. Investor activity around ASTRUSDT has been rising, reflecting growing optimism in the project’s fundamentals and the broader crypto recovery trend. With technical indicators aligning for a bullish reversal and volume supporting the move, ASTRUSDT may soon enter a new phase of momentum-driven growth. This setup presents an attractive opportunity for traders looking to capitalize on a mid-term rally as the market regains strength. ✅ Show your support by hitting the like button and ✅ Leaving a comment below! (What is You opinion about this Coin) Your feedback and engagement keep me inspired to share more insightful market analysis with you!
Alpha-GoldFX
مثلث کاهشی آسترا (ASTRUSDT): سیگنال انفجار صعودی ۵۰ درصدی؟

ASTRUSDT is forming a well-defined falling wedge pattern on the chart, a bullish setup that often signals an upcoming reversal after a period of downward consolidation. The narrowing price action suggests that sellers are losing momentum while buyers are gradually stepping in. This setup becomes even more convincing with the presence of good trading volume, which indicates that investors are accumulating positions in anticipation of a potential breakout. If the resistance trendline is breached, ASTRUSDT could experience a sharp move upward, with gains estimated in the 50% to 60% range. The falling wedge is one of the most reliable bullish reversal patterns, and ASTRUSDT’s price structure fits it perfectly. Each dip has been met with increasing buying pressure, showing that the market sentiment is shifting from bearish to bullish. A confirmed breakout above the wedge could trigger a significant rally, supported by strong investor interest and improving market liquidity. Traders are closely watching this zone for a breakout confirmation to ride the next bullish wave. Investor activity around ASTRUSDT has been rising, reflecting growing optimism in the project’s fundamentals and the broader crypto recovery trend. With technical indicators aligning for a bullish reversal and volume supporting the move, ASTRUSDT may soon enter a new phase of momentum-driven growth. This setup presents an attractive opportunity for traders looking to capitalize on a mid-term rally as the market regains strength. ✅ Show your support by hitting the like button and ✅ Leaving a comment below! (What is You opinion about this Coin) Your feedback and engagement keep me inspired to share more insightful market analysis with you!

CryptoWithJames
تحلیل ASTR: سیگنال انفجار ۸۰٪ از الگوی گُوِه نزولی!

#ASTR UPDATE ASTR Technical Setup Pattern: Bullish falling wedge pattern Current Price: $0.075 Target Price: $0.135 Target % Gain: 80.27% ASTR is breaking out of a falling wedge pattern on the 1D timeframe. Current price is $0.075 with a target near $0.135, showing about 80% potential upside. The breakout highlights renewed bullish momentum with structure favoring further continuation. Always use proper risk management. Time Frame: 1D Risk Management Tip: Always use proper risk management.

Bithereum_io
آستر (ASTR) روی لبه انفجار! آیا این مثلث نزولی شکسته میشود و به این اهداف قیمتی میرسد؟

#ASTR is trading within a descending triangle on the daily chart and is on the verge of breaking out above the triangle resistance and the daily SMA200. If that happens, the potential targets are: 🎯 $0.02736 🎯 $0.03176 🎯 $0.03532 🎯 $0.03888 🎯 $0.04395 🎯 $0.05040 ⚠️ Always remember to use a tight stop-loss and maintain proper risk management.

MyCryptoParadise
Is ASTR About to Break Out or Break Down? Don’t Miss It
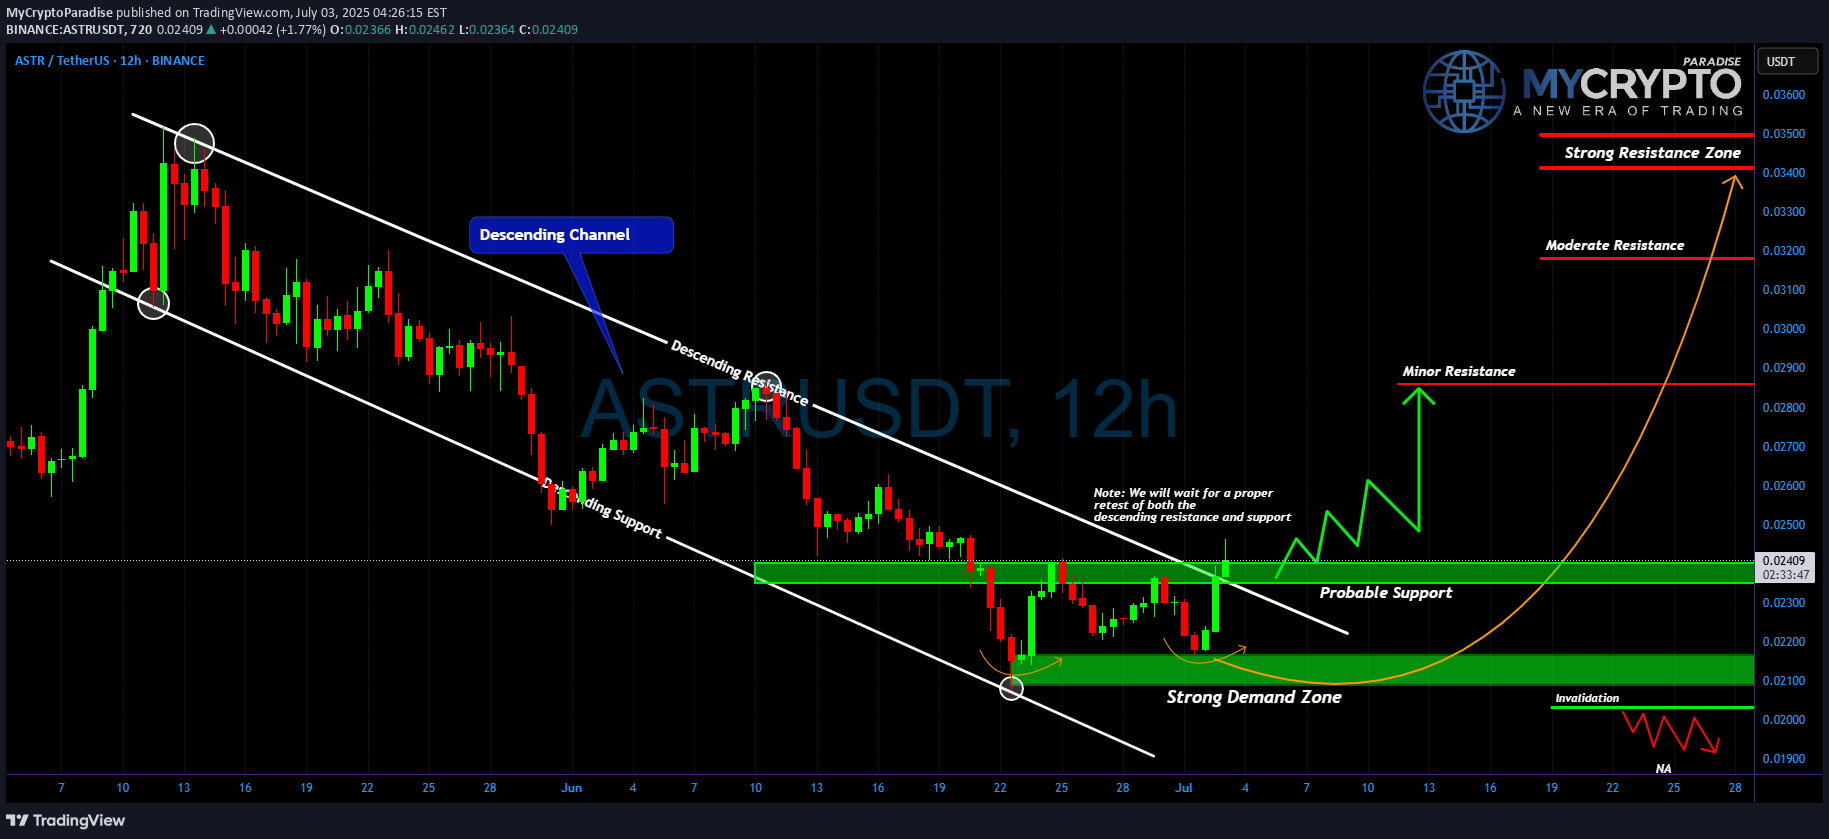
Yello Paradisers! Are you positioned correctly, or will you once again find yourself on the wrong side of the market when the real move begins? If you’ve been with us, you know we’ve been waiting for this kind of setup with patience, and now it's time to pay attention. 💎#ASTR/USDT has been moving inside a clean descending channel, respecting both the upper resistance and lower support lines consistently. However, recent price action suggests a potential shift in momentum. After tapping into the strong demand zone between 0.0200 and 0.0215, the price has shown multiple sharp rejections from the lows, indicating that buyers are quietly stepping in. 💎Currently, the price is attempting to break out of the descending structure. We are closely watching how it reacts around the 0.0240 area, which is now acting as probable support. A successful retest of this level would be a significant structural shift, and it opens up the path to retest 0.0280 our first minor resistance. If momentum continues to build and that level breaks, the doors are wide open toward the 0.0310–0.0320 zone, with the final strong resistance sitting around 0.0345. 💎On the flip side, invalidation occurs if the price fails to hold above 0.0210. A clean break below that level could send #ASTR back toward 0.0190, nullifying the current bullish setup. Until then, we remain cautiously optimistic, waiting for the market to confirm direction before committing fully. Stay sharp, Paradisers. The market is about to pick a side and we’ll be on the right one. MyCryptoParadise iFeel the success🌴💎Just as predicted #ASTRUSDT is nicely following our analysis with a 24.30% gain and still looking good. What do you think about these developments?

Trades_for_Traders
SPOT ASTR LONG 12.06.2025

Pinning after exhaustion of sales. 💰I enter at the market price. I'll let you know when I record it manually. ‼️Risk per trade: 2% of the allocated funds for spot trading.Thank you!

stanleycrypto_1
$ASTRUSDT Breakout Setup

$ASTRU is attempting a breakout from its downtrend on the 6H chart. Price is pushing above the descending trendline, supported by a bullish MACD crossover. If the breakout holds, the next target is around $0.035061, with a stop below $0.025490. Momentum looks promising for further upside.

UmutTrades
ASTRUSDT | Don’t Let the Altcoin Euphoria Fool You

I know it’s tempting to believe every altcoin will rally just because the majors are flying. But ASTRUSDT isn’t giving us that story yet.The [color=red]red boxes[/color] are acting as firm resistance levels. If price reclaims and retests them, we can reframe them as support. Until then, I remain cautious.Most traders get trapped here, expecting miracles from weak structures. That’s how portfolios bleed slowly.“I will not insist on my short idea. If the levels suddenly break upwards and do not give a downward break in the low time frame, I will not evaluate it. If they break upwards with volume and give a retest, I will look long.”If you’re with me, you’re thinking differently. And that’s what separates consistent winners from the crowd.📌I keep my charts clean and simple because I believe clarity leads to better decisions.📌My approach is built on years of experience and a solid track record. I don’t claim to know it all but I’m confident in my ability to spot high-probability setups.📌If you would like to learn how to use the heatmap, cumulative volume delta and volume footprint techniques that I use below to determine very accurate demand regions, you can send me a private message. I help anyone who wants it completely free of charge.🔑I have a long list of my proven technique below:🎯 ZENUSDT.P: Patience & Profitability | %230 Reaction from the Sniper Entry🐶 DOGEUSDT.P: Next Move🎨 RENDERUSDT.P: Opportunity of the Month💎 ETHUSDT.P: Where to Retrace🟢 BNBUSDT.P: Potential Surge📊 BTC Dominance: Reaction Zone🌊 WAVESUSDT.P: Demand Zone Potential🟣 UNIUSDT.P: Long-Term Trade🔵 XRPUSDT.P: Entry Zones🔗 LINKUSDT.P: Follow The River📈 BTCUSDT.P: Two Key Demand Zones🟩 POLUSDT: Bullish Momentum🌟 PENDLEUSDT.P: Where Opportunity Meets Precision🔥 BTCUSDT.P: Liquidation of Highly Leveraged Longs🌊 SOLUSDT.P: SOL's Dip - Your Opportunity🐸 1000PEPEUSDT.P: Prime Bounce Zone Unlocked🚀 ETHUSDT.P: Set to Explode - Don't Miss This Game Changer🤖 IQUSDT: Smart Plan⚡️ PONDUSDT: A Trade Not Taken Is Better Than a Losing One💼 STMXUSDT: 2 Buying Areas🐢 TURBOUSDT: Buy Zones and Buyer Presence🌍 ICPUSDT.P: Massive Upside Potential | Check the Trade Update For Seeing Results🟠 IDEXUSDT: Spot Buy Area | %26 Profit if You Trade with MSB 📌 USUALUSDT: Buyers Are Active + %70 Profit in Total🌟 FORTHUSDT: Sniper Entry +%26 Reaction🐳 QKCUSDT: Sniper Entry +%57 Reaction📊 BTC.D: Retest of Key Area Highly Likely📊 XNOUSDT %80 Reaction with a Simple Blue Box!📊 BELUSDT Amazing %120 Reaction!📊 Simple Red Box, Extraordinary ResultsI stopped adding to the list because it's kinda tiring to add 5-10 charts in every move but you can check my profile and see that it goes on..

Nyskohuz
ASTR/USDT 1W

🌱 ASTR ⁀➷ #AstarNetwork. Macro chart Another 🌴 Intermediate Target - $0.20 🍃 Macro Target 1 - $0.30 🍃 Macro Target 2 - $0.53 🍃 Macro Target 3 - $0.86 - Not financial advice, trade with caution. #Crypto #AstarNetwork #ASTR #Investment ✅ Stay updated on market news and developments that may influence the price of Astar Network. Positive or negative news can significantly impact the cryptocurrency's value. ✅ Exercise patience and discipline when executing your trading plan. Avoid making impulsive decisions driven by emotions, and adhere to your strategy even during periods of market volatility. ✅ Remember that trading always involves risk, and there are no guarantees of profit. Conduct thorough research, analyze market conditions, and be prepared for various scenarios. Trade only with funds you can afford to lose and avoid excessive risk-taking.

iMoneyTeam
ASTR Buy/Long Setup (12H)

Two major trigger lines have been broken, and the price is currently sitting at a key level. A bullish CH (Change of Character) is visible on the chart. If the demand zone holds, the price may move toward the targets marked on the chart. A daily candle closing below the invalidation level will invalidate this analysis. Do not enter the position without capital management and stop setting Comment if you have any questions thank you
Disclaimer
Any content and materials included in Sahmeto's website and official communication channels are a compilation of personal opinions and analyses and are not binding. They do not constitute any recommendation for buying, selling, entering or exiting the stock market and cryptocurrency market. Also, all news and analyses included in the website and channels are merely republished information from official and unofficial domestic and foreign sources, and it is obvious that users of the said content are responsible for following up and ensuring the authenticity and accuracy of the materials. Therefore, while disclaiming responsibility, it is declared that the responsibility for any decision-making, action, and potential profit and loss in the capital market and cryptocurrency market lies with the trader.