
ANKR
Ankr
| تریدر | نوع سیگنال | حد سود/ضرر | زمان انتشار | مشاهده پیام |
|---|---|---|---|---|
No results found. | ||||
Price Chart of Ankr
سود 3 Months :
سیگنالهای Ankr
Filter
Sort messages by
Trader Type
Time Frame

Kapitalist01
تحلیل زمانی بازار: استراتژی معاملاتی سریع و لحظهای (بدون توصیه سرمایهگذاری)
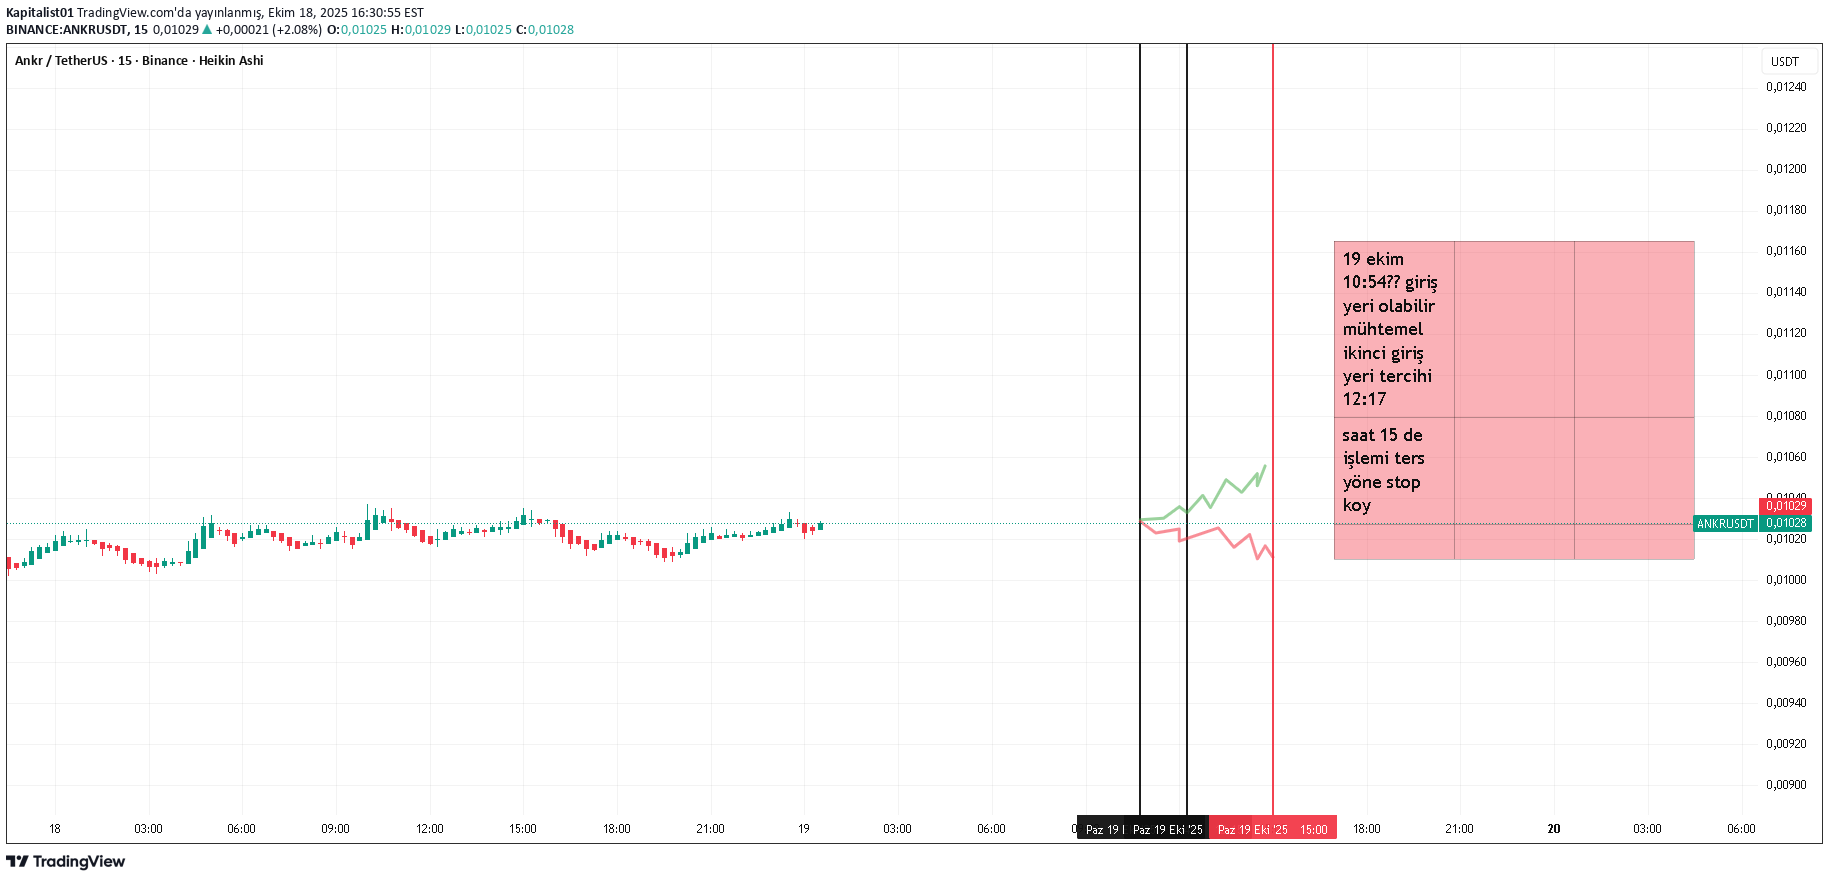
for short term futures market It is not investment advice. With stop on minute chart Watch for a minute or two for the trading direction and join the direction in which the two-minute zone is passed. If the first entry time does not work, use the second one. If it works, continue until 15:00. note to self

weslad
رالی ۳۴۰۰ درصدی آنکر (ANKR): آیا این کف قیمتی برای انفجار بزرگ است؟

ANKR is finalizing a WXY corrective structure, completing near a strong accumulation zone (0.00474-0.00675). A breakout from this wedge could trigger a major bullish cycle with targets around $0.21291 with a potential 3,400% rally from current levels. Price remains valid for this setup as long as it stays above 0.00474USDT. Any close below invalidates the bullish outlook. Smart money is likely accumulating here the next impulse may surprise the market. What’s your take on ANKR’s structure? Like, Comment and Share.

mahesh56a
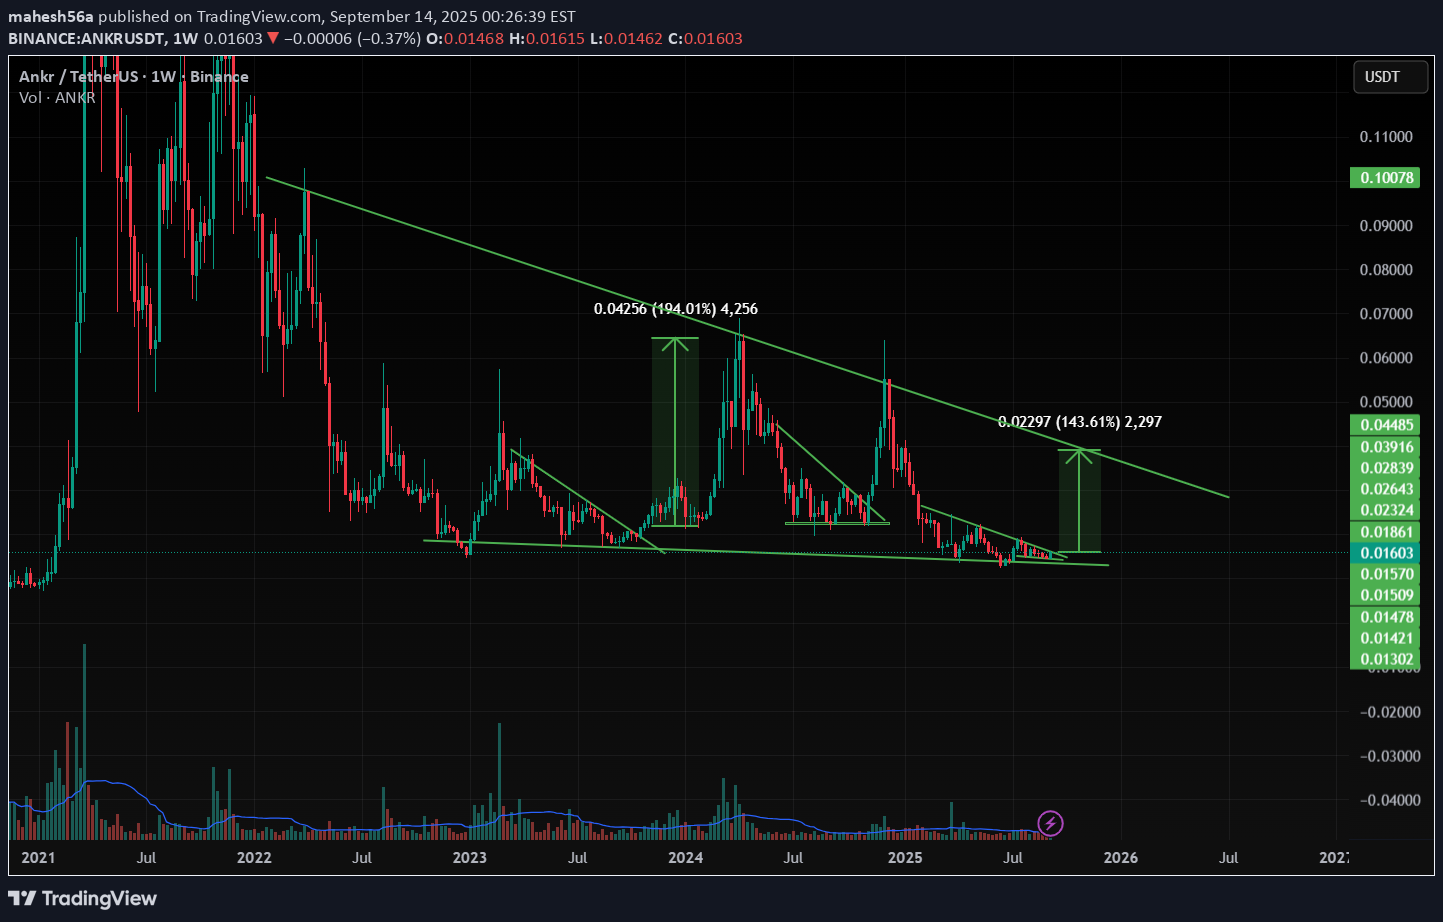
ANKR is moving inside the Triangle pattern and when it comes to support and breaks a pattern then it is very much possible to give very good move. and at the same time Bitcoin dominance is decreasing and altcoins dominance is started increasing , so look on all the altcoins. and follow proper risk management , it has very good chances to move UP side but first we have to protect the down side , where risk management comes into game .

Hamdi_chrt
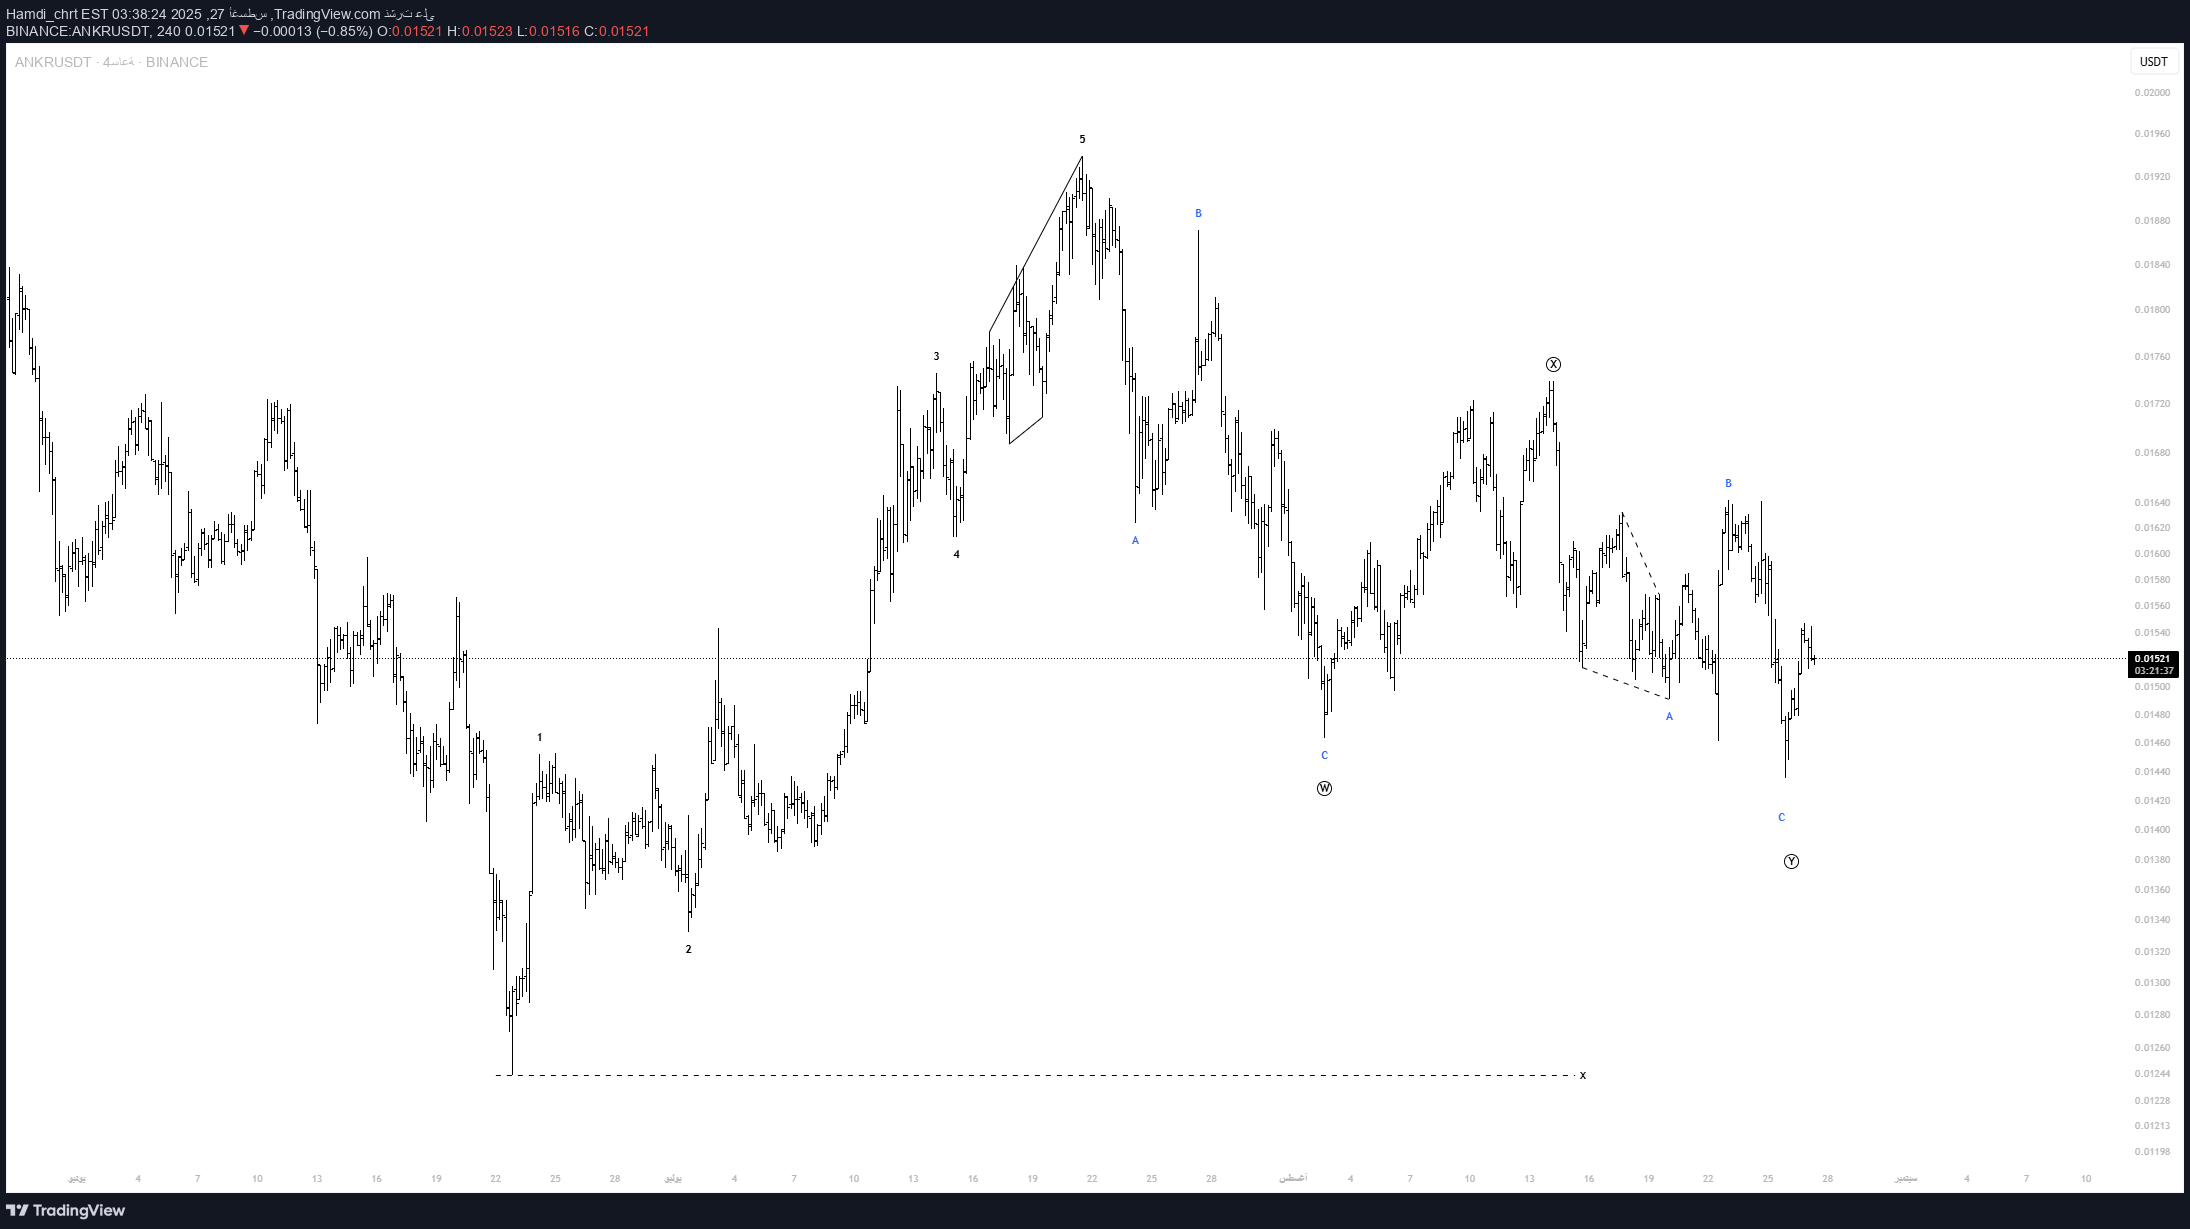
It appears to me that the correction of the type of Double Zaqzaq is very close to its completion

HPotter

Good moment for try to Buy ANKR with risk\reward 1:1. We are have big flat channel and now moving up from down to up. In the current moment to broke the middle line and I hope still moving up. Will see...

CobraVanguard

ankr has completed and broken the ascending triangle in the 4h timeframe, The price is currently supported well, which can increase the price. I expect the price to rise to around 0.017 . Stay Awesome , CobraVanguard
KurdForexTrader

in my opinion this is a good trade with a good r/r hope hit the tp consider this is my trade not your trade and i just like to share my trades with worldi close it at the entry point i changed my mind now its bullish

CryptoNuclear

🧠 Analysis Overview: ANKR is showing strong signs of a potential macro reversal after bouncing off its historical demand zone around 0.017–0.019 USDT. This zone has proven to be a significant accumulation area in past cycles — fueling major rallies in both 2021 and 2023. The recent reaction at this level could mark the beginning of a substantial bullish leg in the mid-to-long term. 🔍 Pattern & Structure Breakdown: ✅ Demand Zone Re-Tested: This zone has been tested multiple times over the years and continues to attract buying interest, signaling institutional accumulation. ✅ Potential Weekly Double Bottom: Price has formed a clear double bottom with a strong bullish rejection candle, indicating buyers are stepping back in. ✅ Macro Accumulation Range: For nearly two years, ANKR has been ranging between 0.018 – 0.21 USDT. It’s currently at the bottom of that range, providing a high risk-reward opportunity. ✅ Fibonacci Extension Targets: Well-defined horizontal resistances (in yellow) suggest clear roadmap targets for bullish continuation — ranging from 0.024 to 0.216. 🚀 Bullish Scenario (HIGH PROBABILITY SETUP): Ideal Entry Zone: 0.018–0.020 USDT Initial Breakout Confirmation: Above 0.02437 Progressive Targets: 0.03067 – minor resistance 0.04253 – previous swing high 0.06191 – historical supply 0.09808 – 0.12196 – prior distribution zone 0.16708 – 0.21662 – cycle top targets 🎯 Potential Upside: 200% – 1000%+ 📈 Trend Reversal Confirmed: Once weekly higher-highs are established ⚠️ Bearish Scenario (RISK MANAGEMENT): Breakdown below 0.01800 could trigger: 0.01200 (intermediate support) 0.00700 – 0.00446 (macro-level supports) ❗️Bearish Bias Valid: On weekly close below 0.01700 with strong selling volume 🧭 Conclusion: > ANKR is currently at a critical macro support zone with a technically sound reversal setup. For swing traders and mid-term investors, this is a strategic area to monitor for potential trend shift. Tight risk, massive reward. 📌 Strategy Recommendation: Use DCA (dollar-cost averaging) in the demand zone Place conservative stop-loss below 0.01700 Watch for breakout with volume above 0.02437 to confirm bullish reversal #ANKR #ANKRUSDT #CryptoReversal #AltcoinSetup #WeeklyChart #SwingTrade #AccumulationZone #TechnicalAnalysis #LowCapAltcoin #FibonacciTargets

ShMohsin

CP 0.01863Buy: 0.017 0.019Sell: 0.0218 SL: 0.0171x2 ratio Strong project Very low valueOnly Spot Trading with STOP LOSS.

trpiyasa

به نظر من Ankr در نقطه شروع یک صعود قرار دارد. اجازه دهید صبر کنیم و ببینیم. این به هیچ وجه توصیه سرمایه گذاری نیست.
Disclaimer
Any content and materials included in Sahmeto's website and official communication channels are a compilation of personal opinions and analyses and are not binding. They do not constitute any recommendation for buying, selling, entering or exiting the stock market and cryptocurrency market. Also, all news and analyses included in the website and channels are merely republished information from official and unofficial domestic and foreign sources, and it is obvious that users of the said content are responsible for following up and ensuring the authenticity and accuracy of the materials. Therefore, while disclaiming responsibility, it is declared that the responsibility for any decision-making, action, and potential profit and loss in the capital market and cryptocurrency market lies with the trader.