
ALT
Altlayer
| تریدر | نوع سیگنال | حد سود/ضرر | زمان انتشار | مشاهده پیام |
|---|---|---|---|---|
No results found. | ||||
Price Chart of Altlayer
سود 3 Months :
سیگنالهای Altlayer
Filter
Sort messages by
Trader Type
Time Frame

Leo524
$ALT 1H CHART UPDATE

📌This is a 1 hour chart, so this is a short-term view of $ALT. 📌I’m using Elliott Wave theory to understand the move. Right now, Wave 3 is already completed on the chart. 📌After every strong Wave 3, price usually pulls back to form Wave 4. This pullback is normal, not a bad sign. 📌The green box on the chart is the support zone. 👉 Wave 4 must hold this zone. 📌If price holds this support and does not break below it, then we can expect the next move up as Wave 5 🚀 📌Simple explanation for beginners: ➡️ Drop = Wave 4 (healthy correction) ➡️ Hold support = strength ➡️ Next push up = Wave 5

Bithereum_io
آلت کوین ALT در آستانه انفجار؟ اهداف قیمتی شگفتانگیز پس از خروج از الگوی مثلث نزولی!
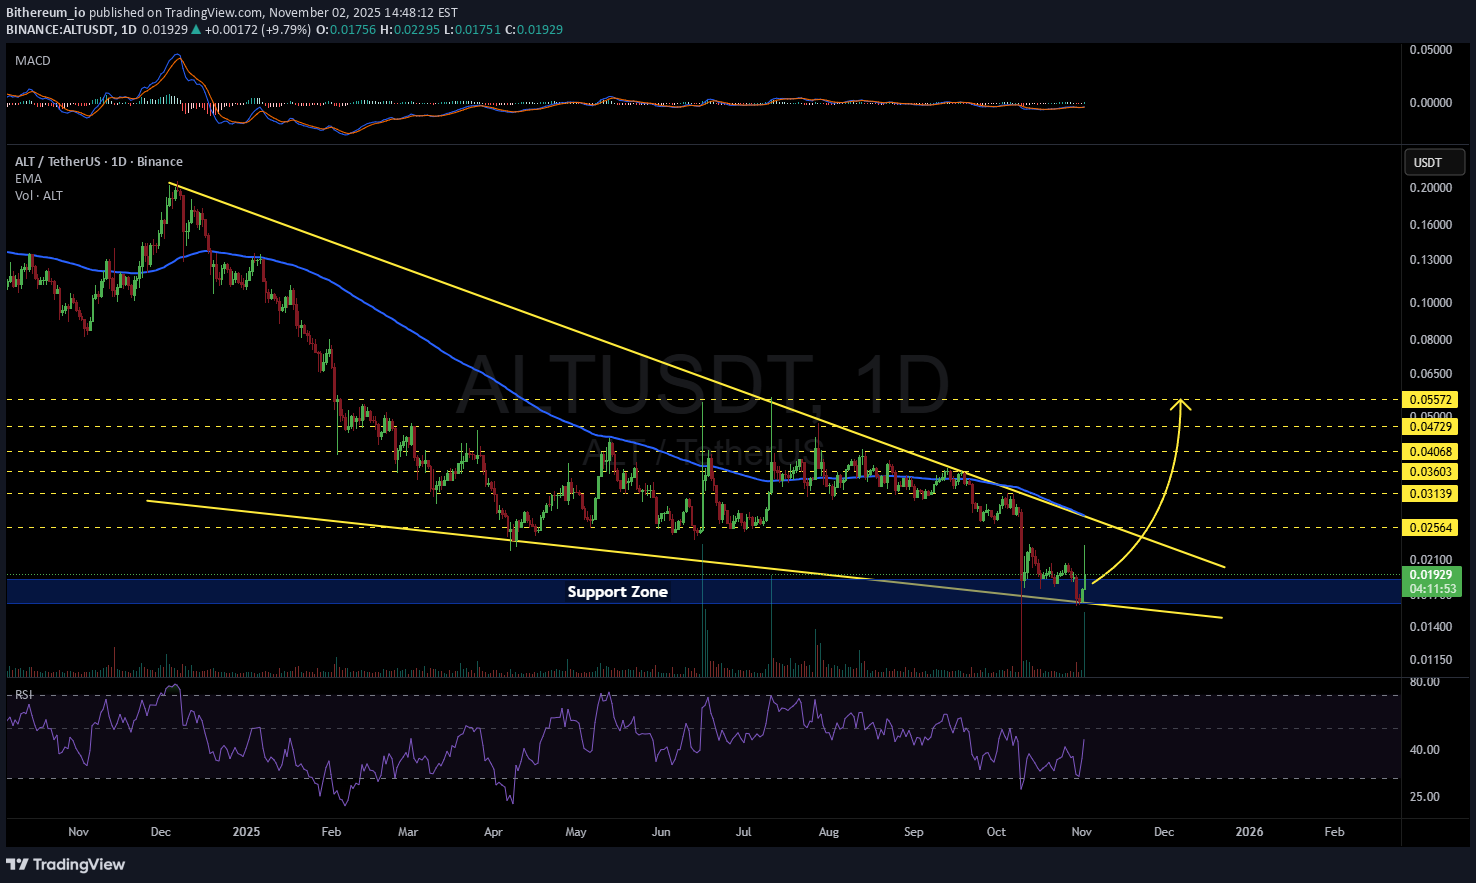
#ALT is currently trading within a falling wedge pattern on the daily chart. In case of a successful bounce from the support zone and a breakout above the wedge resistance and the daily EMA100, the potential upside targets are: 🎯 $0.02564 🎯 $0.03139 🎯 $0.03603 🎯 $0.04068 🎯 $0.04729 🎯 $0.05572 ⚠️ Always remember to use a tight stop-loss and maintain proper risk management.

Alpha-GoldFX
آلتکوین ALT در آستانه انفجار قیمتی: راز الگوی صعودی مخفی با پتانسیل رشد ۲۰۰٪!
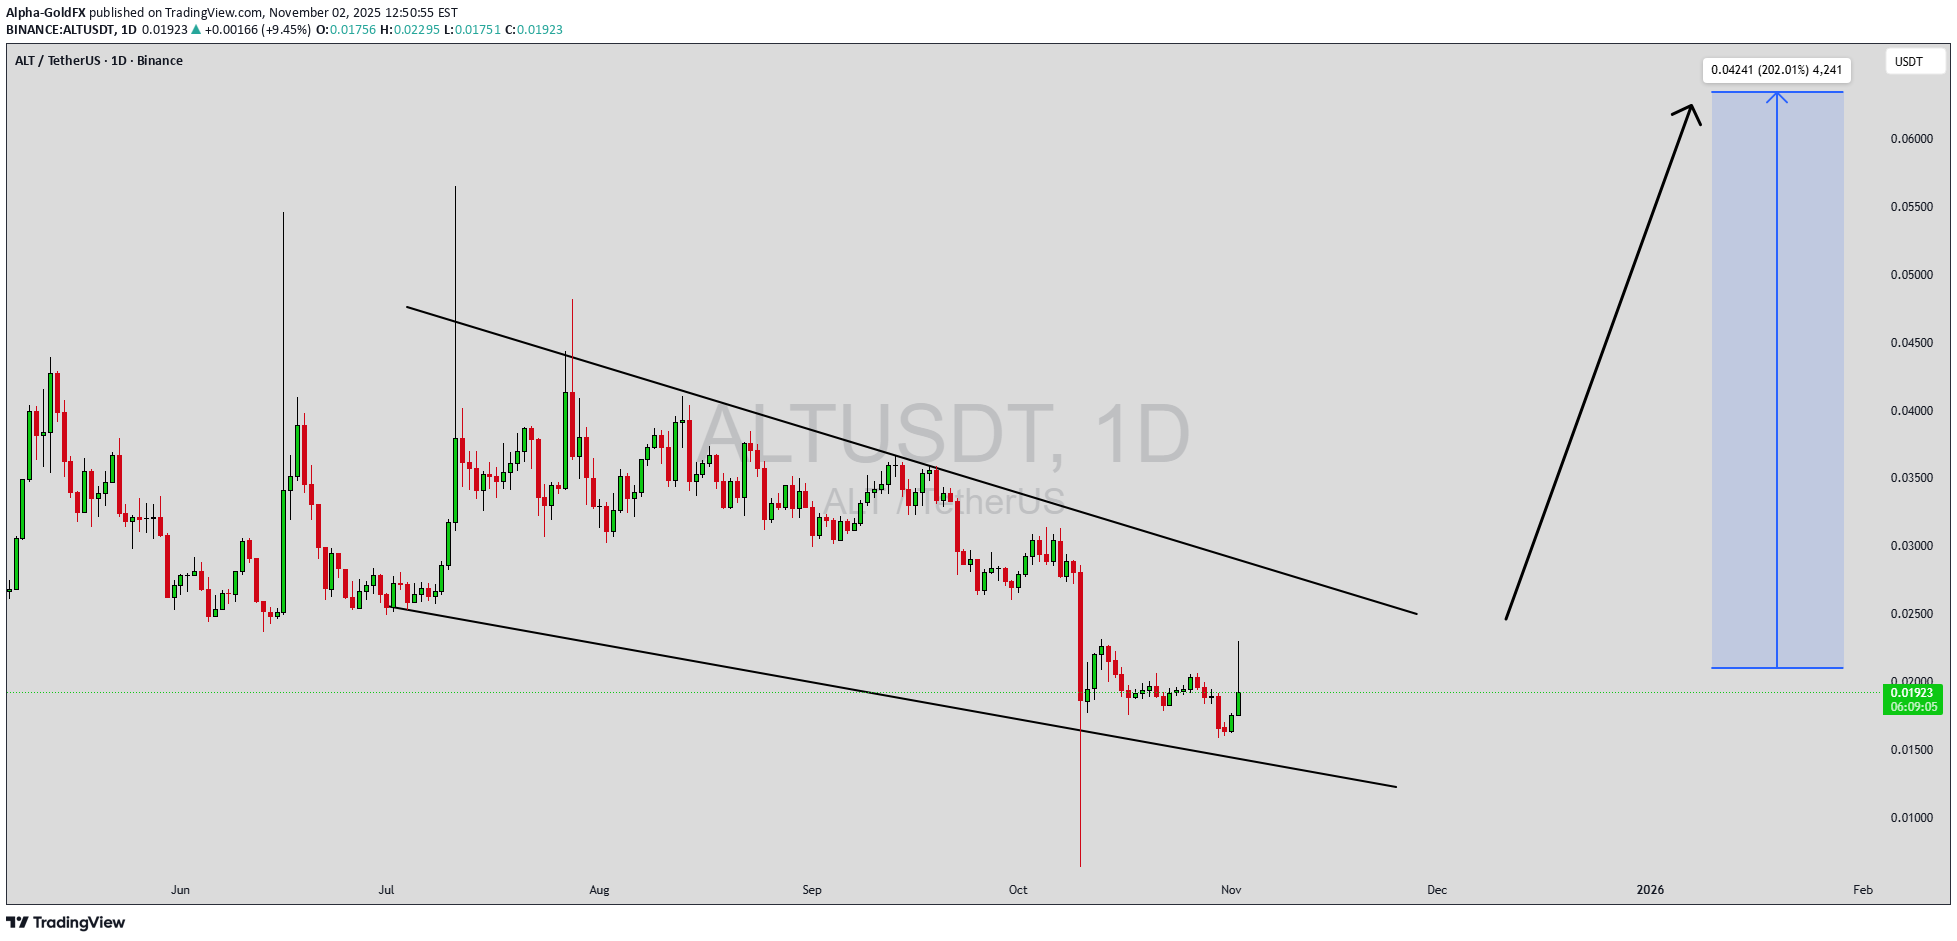
ALTUSDT is currently forming a bullish wavering wedge pattern, which is often seen as a strong reversal signal indicating potential upward momentum. The pattern highlights a period of consolidation where the price narrows between converging trendlines before breaking out with significant force. In ALTUSDT’s case, the consistent volume and healthy market activity support the likelihood of a breakout to the upside, aligning with the projected gain of 190% to 200%. Traders are closely watching this setup as it combines strong technical signals with rising investor enthusiasm. The bullish wavering wedge pattern typically emerges when a market is preparing for a powerful move after an extended correction phase. For ALTUSDT, this pattern suggests that sellers are losing strength while buyers are gradually taking control. The consistent volume flow adds confidence that a breakout could lead to a substantial rally once key resistance levels are breached. This setup has historically provided high-probability trading opportunities in trending markets, especially when accompanied by growing investor attention. The current technical outlook on ALTUSDT reflects strong accumulation, improving momentum, and renewed optimism across the broader crypto market. If the breakout confirms with strong candle closes and follow-through buying, the pair could experience a significant surge in price action. This aligns with the bullish sentiment seen in other major altcoins, reinforcing ALTUSDT’s potential for exponential growth in the upcoming sessions. ✅ Show your support by hitting the like button and ✅ Leaving a comment below! (What is You opinion about this Coin) Your feedback and engagement keep me inspired to share more insightful market analysis with you!

AliHikmetHarun
تحلیل تکنیکال ALTUSDT: سیگنال خرید قدرتمند با الگوی ABCD (پیشبینی صعودی)

The price signaled a return to the Gann Box support zone after the Gann Fan exit. ABCD formation is active, the target zone is upward on the “d–e” leg. Approvals: Gann Box release ✅ Trend line support ✅ TDG positive transition signal ✅ 🎯 Target: ABCD Formation E point ⚠️ Tracking: EMA50 breakout confirmation is expected. In the crypto market, altcoins are looking for a way out of the decline. ALTUSDT recovery scenario is technically supported. #ALTUSDT #Altcoin #CryptoAnalysis #FixzoneTV #TechnicalAnalysis
Bithereum_io
ALTUSDT 1D
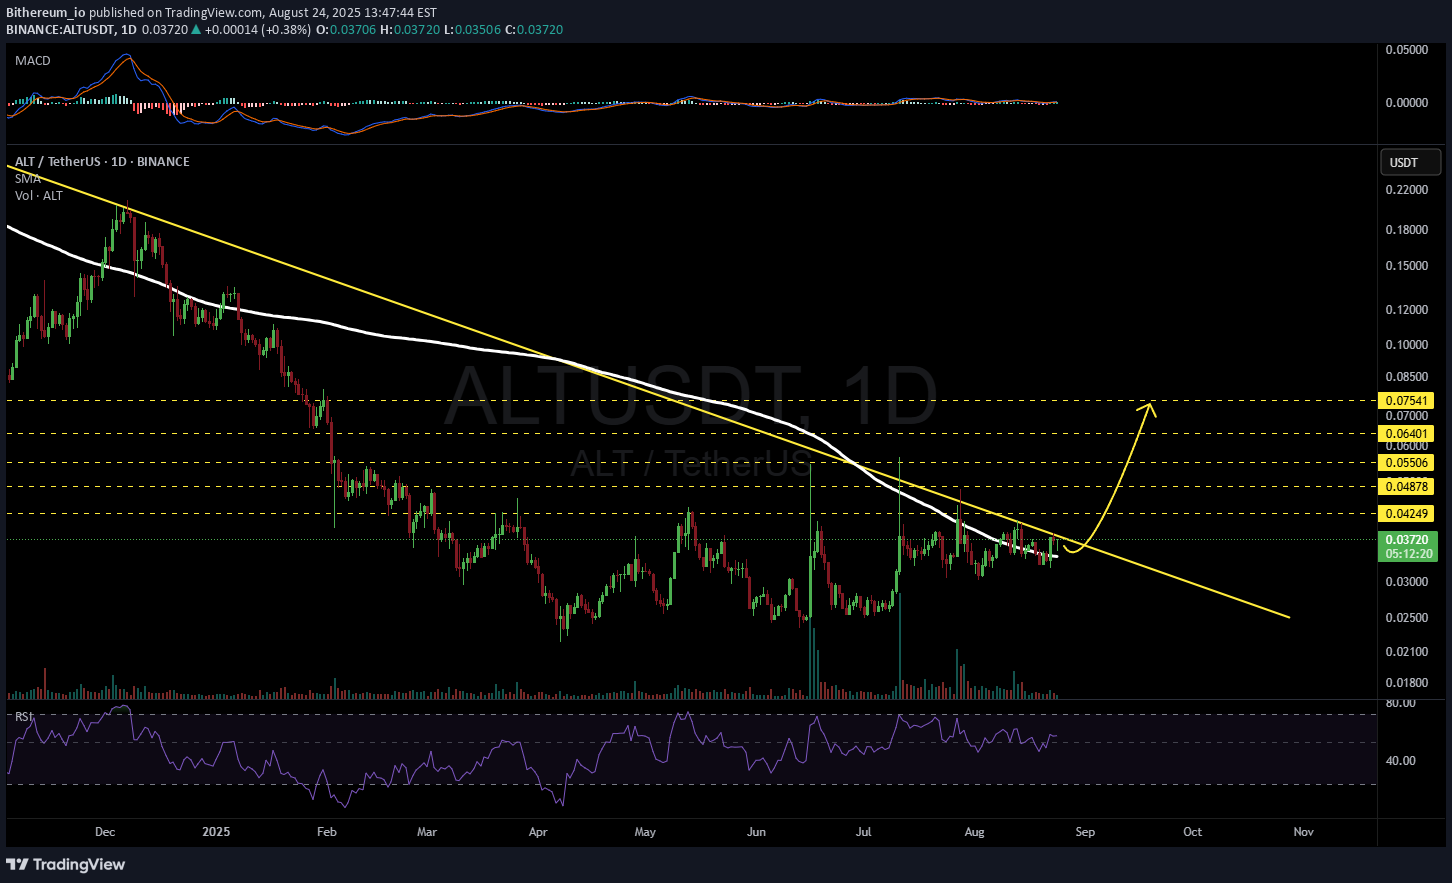
#ALT is moving near the descending trendline and is on the verge of breaking out above it, with the daily SMA200 acting as strong support. If a breakout occurs, the potential targets are: 🎯 $0.04249 🎯 $0.04878 🎯 $0.05506 🎯 $0.06401 🎯 $0.07541 ⚠️ As always, use a tight stop-loss and apply proper risk management.

CryptoNuclear
ALT/USDT — Descending Triangle: Breakout or Breakdown?
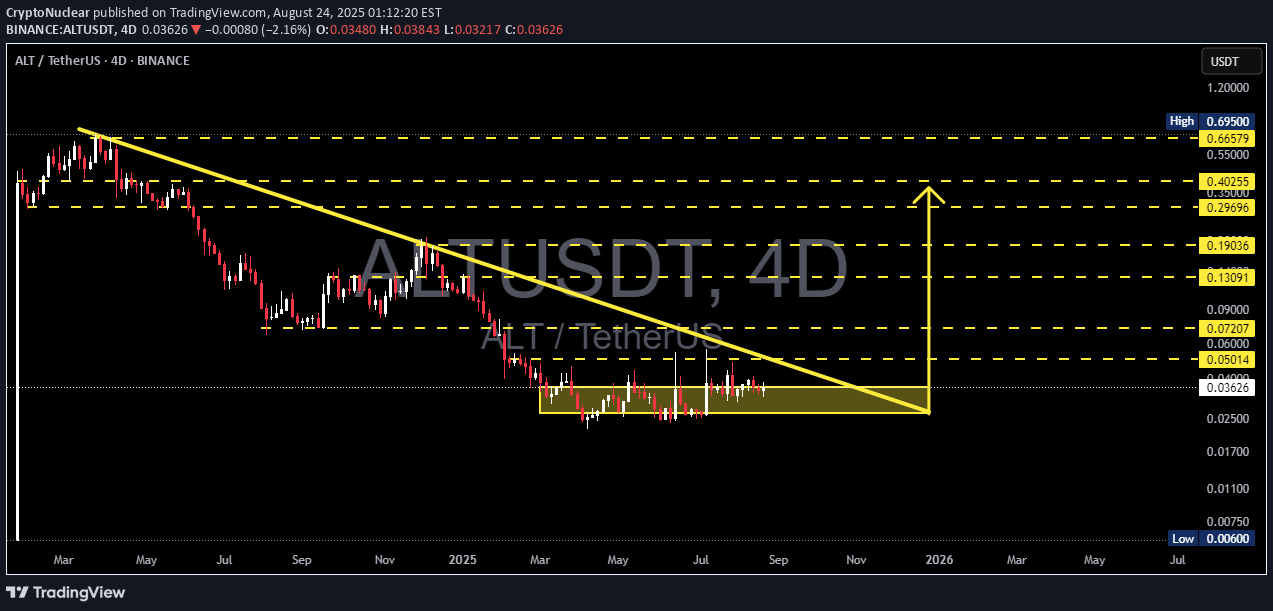
🔎 Overview ALT/USDT has been in a prolonged downtrend since 2024, consistently forming lower highs along a descending trendline. At the same time, buyers continue to defend the support base at 0.028–0.031 USDT, creating a clear Descending Triangle pattern. Currently, price action is consolidating inside a yellow accumulation box — squeezed between strong demand below and heavy supply above. This kind of compression often ends with a large expansion move, either a breakout or a breakdown. --- 🧩 Technical Structure Main Pattern: Descending Triangle (typically bearish continuation, but at the end of long trends it can act as a reversal). Key Demand Zone (support): 0.028–0.031 Key Supply Zone (resistance + trendline): 0.040–0.042 Major Resistance Levels: 0.050 → 0.060 → 0.072 → 0.090 → 0.131 → 0.190 → 0.270 → 0.403 → 0.666 Support Levels if Breakdown: 0.017 → 0.011 → 0.006 --- 🚀 Bullish Scenario (Potential Reversal & Breakout) 1. Confirmation: 4D close above 0.042 and a clean breakout from the descending trendline. 2. Entry Trigger: Retest of 0.040–0.042 holding as new support. 3. Short- to Mid-Term Targets: 0.050 (minor resistance) 0.060 (psychological barrier) 0.072–0.090 (major supply zone) 4. Long-Term Targets (if momentum builds): 0.130 → 0.190 → 0.270 5. Invalidation: Price closes back below 0.038–0.040 after breakout. --- 📉 Bearish Scenario (Trend Continuation) 1. Confirmation: 4D close below 0.028 with strong volume. 2. Entry Trigger: Retest of 0.028–0.031 fails to reclaim (acting as resistance). 3. Targets to the Downside: 0.017 (historical support) 0.011 (extreme support) 0.006 (all-time low risk zone) 4. Invalidation: Price reclaims above 0.031 after breakdown. --- ⚖️ Key Notes Price is in a compression phase — the longer it consolidates inside the box, the stronger the eventual breakout or breakdown. Watch for false breakouts/breakdowns, especially around 0.028–0.042 key levels. The 4D timeframe provides stronger confirmation signals; patience is key. Always manage risk: maintain R:R ≥ 1:2, scale in/out across marked levels. --- 🎯 Conclusion ALT/USDT is at a critical decision point: Will it break out of its long downtrend and start a bullish reversal, or will sellers dominate again and push the price to fresh lows? The Descending Triangle acts like a “technical time bomb” — pressure keeps building, and once released, it could result in a significant move. Traders should closely watch for a confirmed breakout above 0.042 (bullish) or a breakdown below 0.028 (bearish) to determine the next major direction. #ALTUSDT #ALT #Crypto #CryptoAnalysis #PriceAction #DescendingTriangle #Breakout #SupportResistance

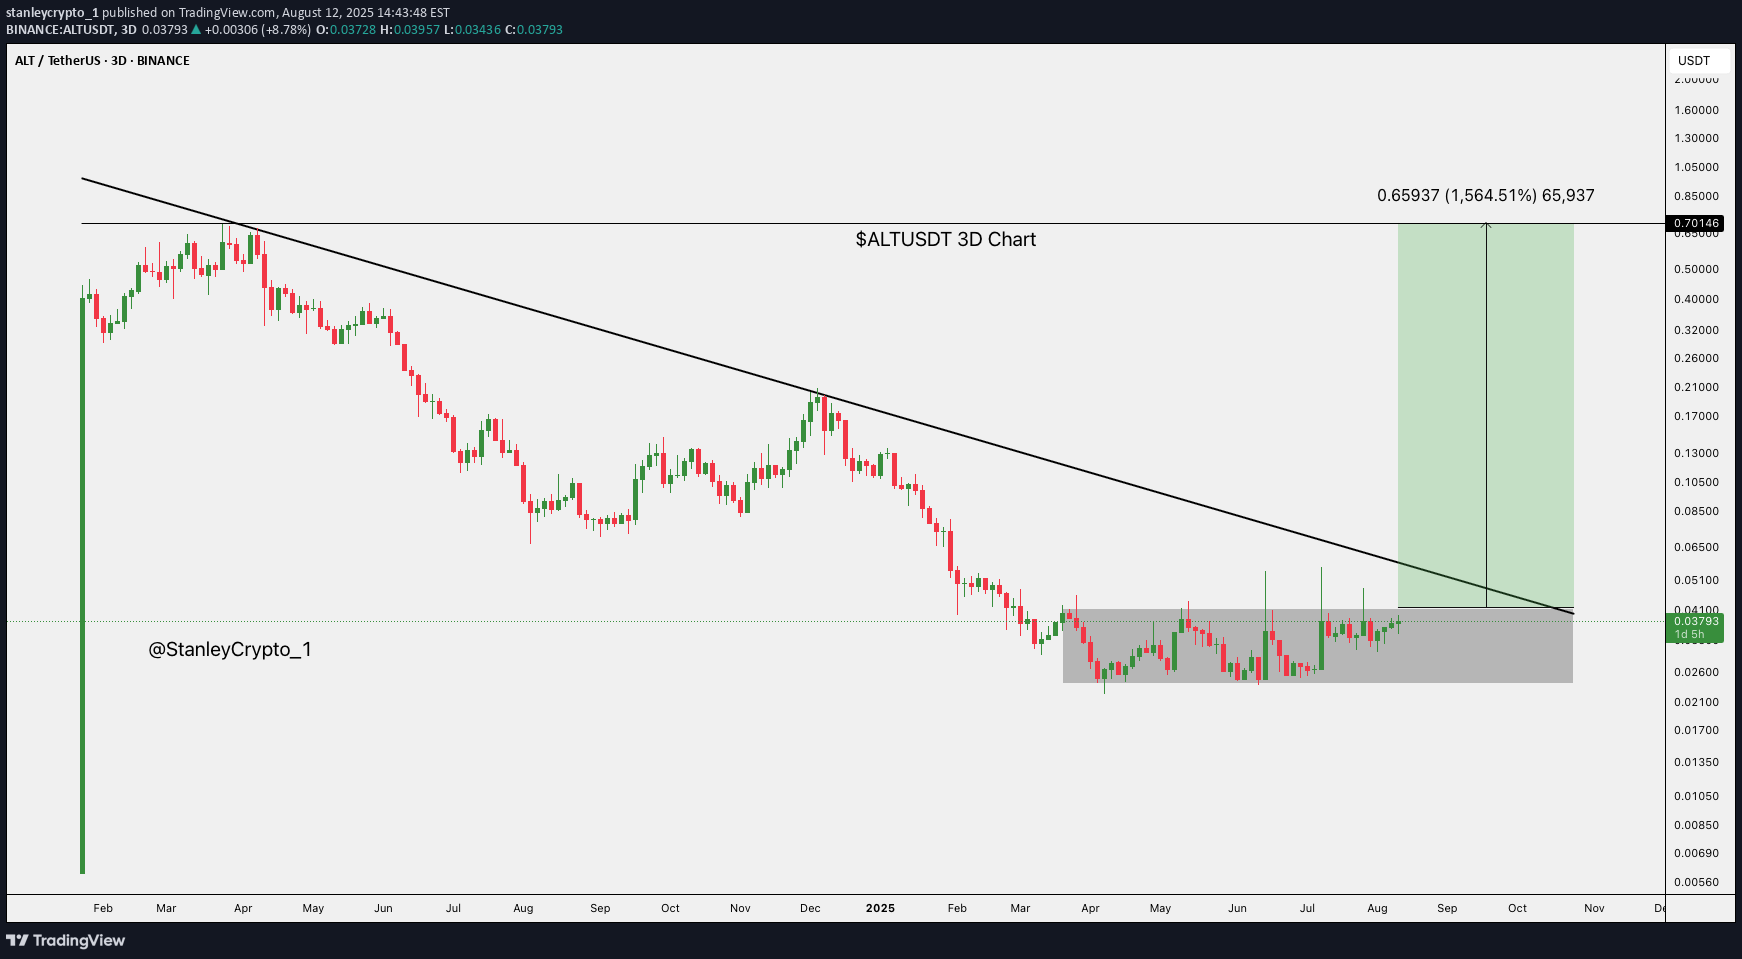
stanleycrypto_1

blacktr46
ALT
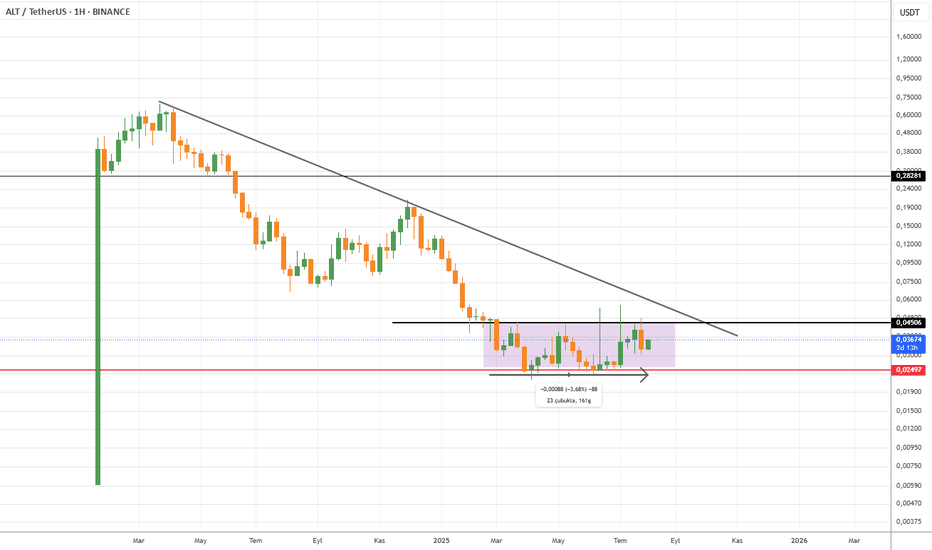
alt eth Based Coin is to be with a controversy on the channel for about 165 days, and a large rise trend will begin with the closing over 0.045. See the graphic weekly area with a wide range of broken breaks should definitely be confirmed and a falling channel trend that can be followed can be followed in the graphic looks nice, especially if it provides permanence over 4 thousand dollars, I think the movement will come. But I don't know much about the coin structure. It is not an investment advice.

MasterAnanda
AltLayer 3,000% Late 2025 Target · Bottom Confirmed

This is a perfect chart. You can see the same drawings made by the candles compared to other altcoins we've been visiting. For example, the main low happened 7-April 2025, four months ago. So AltLayer hit bottom and has been consolidating slowly moving up. Notice higher lows. Notice how after more than two months in June when the market tried to move lower the session ended as an inverted hammer, with high volume. The hammer as a candlestick pattern is a reversal signal. It is only a valid signal when it comes at the end of a trend. Here we have the major low in April after a major downtrend. These signals confirms the low is in and the trend will soon change. It is true, because we already have confirmation. ALTUSDT has been challenging resistance with long upper wicks, support remains unchallenged. As this trend continues, bullish momentum will grow and a massive bullish wave will occur. AltLayer has a huge 3,000% potential for growth in the coming months. Can be a bit less but it can also end up being much more. Namaste.
Disclaimer
Any content and materials included in Sahmeto's website and official communication channels are a compilation of personal opinions and analyses and are not binding. They do not constitute any recommendation for buying, selling, entering or exiting the stock market and cryptocurrency market. Also, all news and analyses included in the website and channels are merely republished information from official and unofficial domestic and foreign sources, and it is obvious that users of the said content are responsible for following up and ensuring the authenticity and accuracy of the materials. Therefore, while disclaiming responsibility, it is declared that the responsibility for any decision-making, action, and potential profit and loss in the capital market and cryptocurrency market lies with the trader.