
ALGO
Algorand
| تریدر | نوع سیگنال | حد سود/ضرر | زمان انتشار | مشاهده پیام |
|---|---|---|---|---|
 Crypto4lightRank: 630 | خرید | حد سود: تعیین نشده حد ضرر: تعیین نشده | 12/5/2025 | |
 SaykoCryptoRank: 5353 | خرید | حد سود: تعیین نشده حد ضرر: تعیین نشده | 12/7/2025 | |
 Richtv_officialRank: 29998 | خرید | حد سود: تعیین نشده حد ضرر: تعیین نشده | 12/10/2025 | |
 TRADEKING_1988Rank: 1051 | خرید | حد سود: تعیین نشده حد ضرر: تعیین نشده | 11/30/2025 | |
 Silvio_TraderskyZahvatRank: 13898 | خرید | حد سود: تعیین نشده حد ضرر: تعیین نشده | 11/18/2025 |
Price Chart of Algorand
سود 3 Months :
خلاصه سیگنالهای Algorand
سیگنالهای Algorand
Filter
Sort messages by
Trader Type
Time Frame

Richtv_official
آلگوراند (ALGO) در آستانه انفجار؟ فرصت خرید اسپات در حمایت کلیدی با اهداف سود بالا!
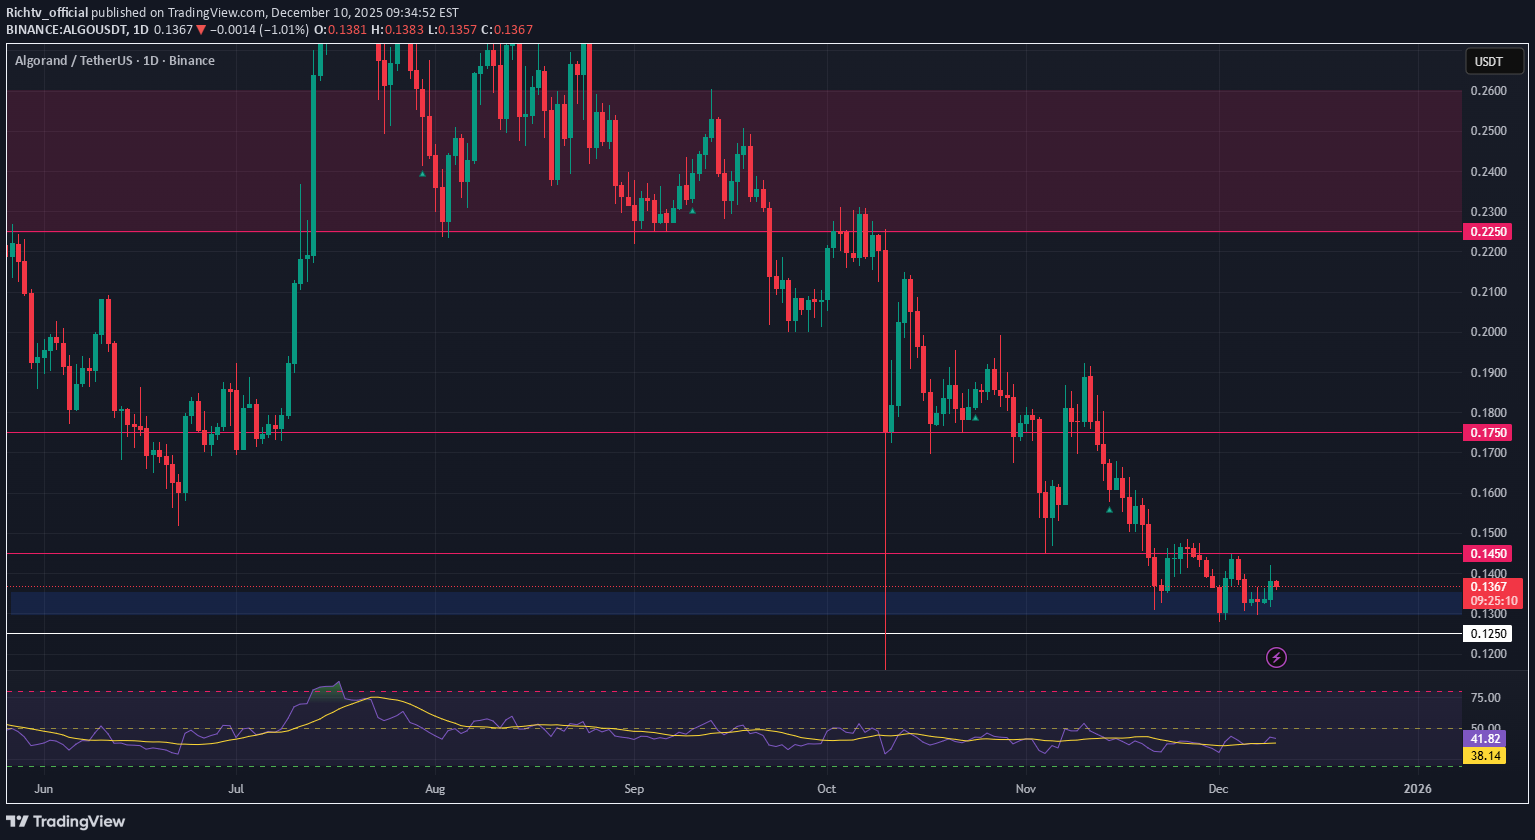
Over the last couple of days, Algorand (ALGO) has been consolidating tightly around a key support level between $0.130 and $0.135. This range has historically held well, acting as a strong base for previous upward moves. The sideways price action here suggests accumulation, with buyers stepping in to absorb selling pressure. 🎯 Trade Idea (Spot Long) Entry Zone: $0.130 – $0.135 Take Profits: $0.145 / $0.175 / $0.225 / $0.26 Stop Loss: $0.125 This setup offers a favorable risk-reward ratio, especially with confirmation of support holding. The multi-tiered TP approach allows for scaling out profitably. Always watch for volume confirmation and market sentiment shifts. A breakdown below $0.125 would invalidate the idea. This setup is meant for educational purposes only.

CryptoAnalystSignal
#ALGO/USDT - this will go up
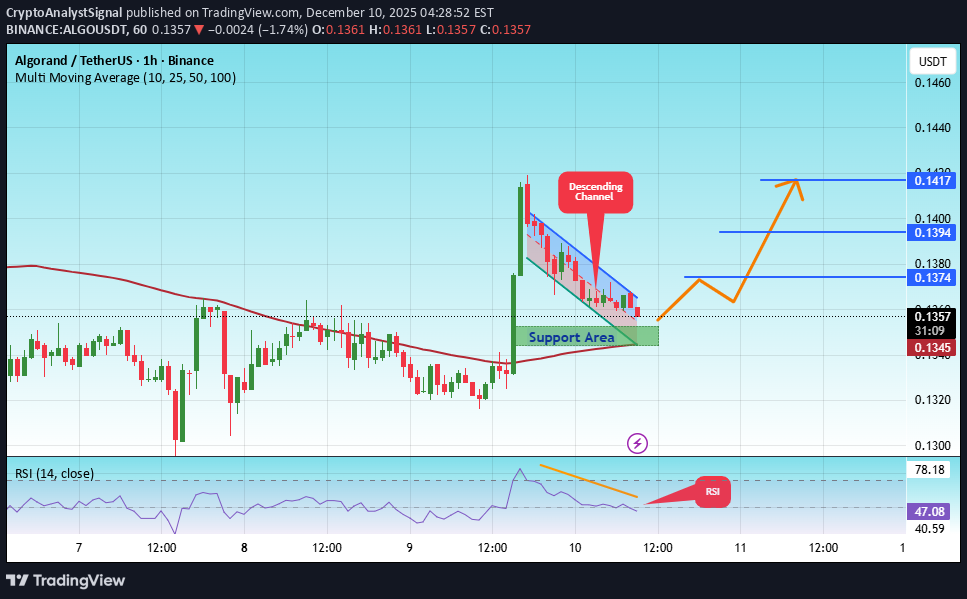
#ALGO The price is moving in a descending channel on the 1-hour timeframe. It has reached the lower boundary and is heading towards breaking above it, with a retest of the upper boundary expected. We have a downtrend on the RSI indicator, which has reached near the lower boundary, and an upward rebound is expected. There is a key support zone in green at 0.1340. The price has bounced from this zone multiple times and is expected to bounce again. We have a trend towards consolidation above the 100-period moving average, as we are moving close to it, which supports the upward movement. Entry price: 0.1360 First target: 0.1374 Second target: 0.1394 Third target: 0.1417 Don't forget a simple principle: money management. Place your stop-loss order below the support zone in green. For any questions, please leave a comment. Thank you.
SaykoCrypto
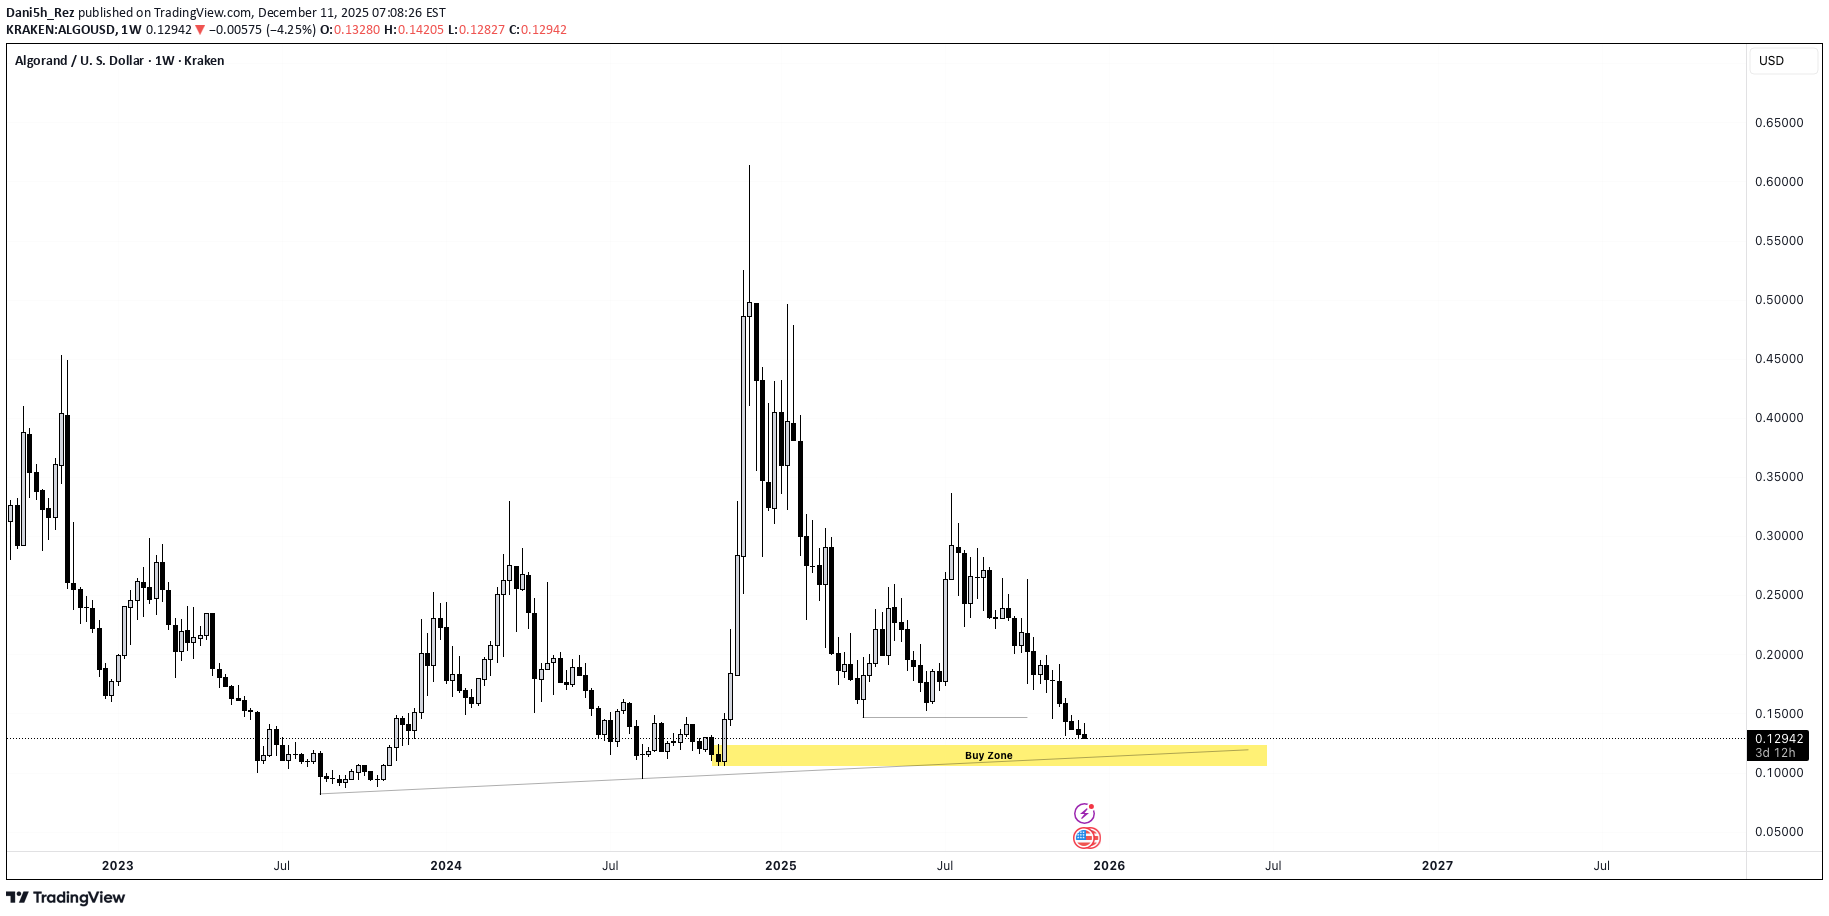
تحلیل هفتگی الگوراند (ALGO/USDT): آیا شکست سقف مثلث، آغاز صعود است؟
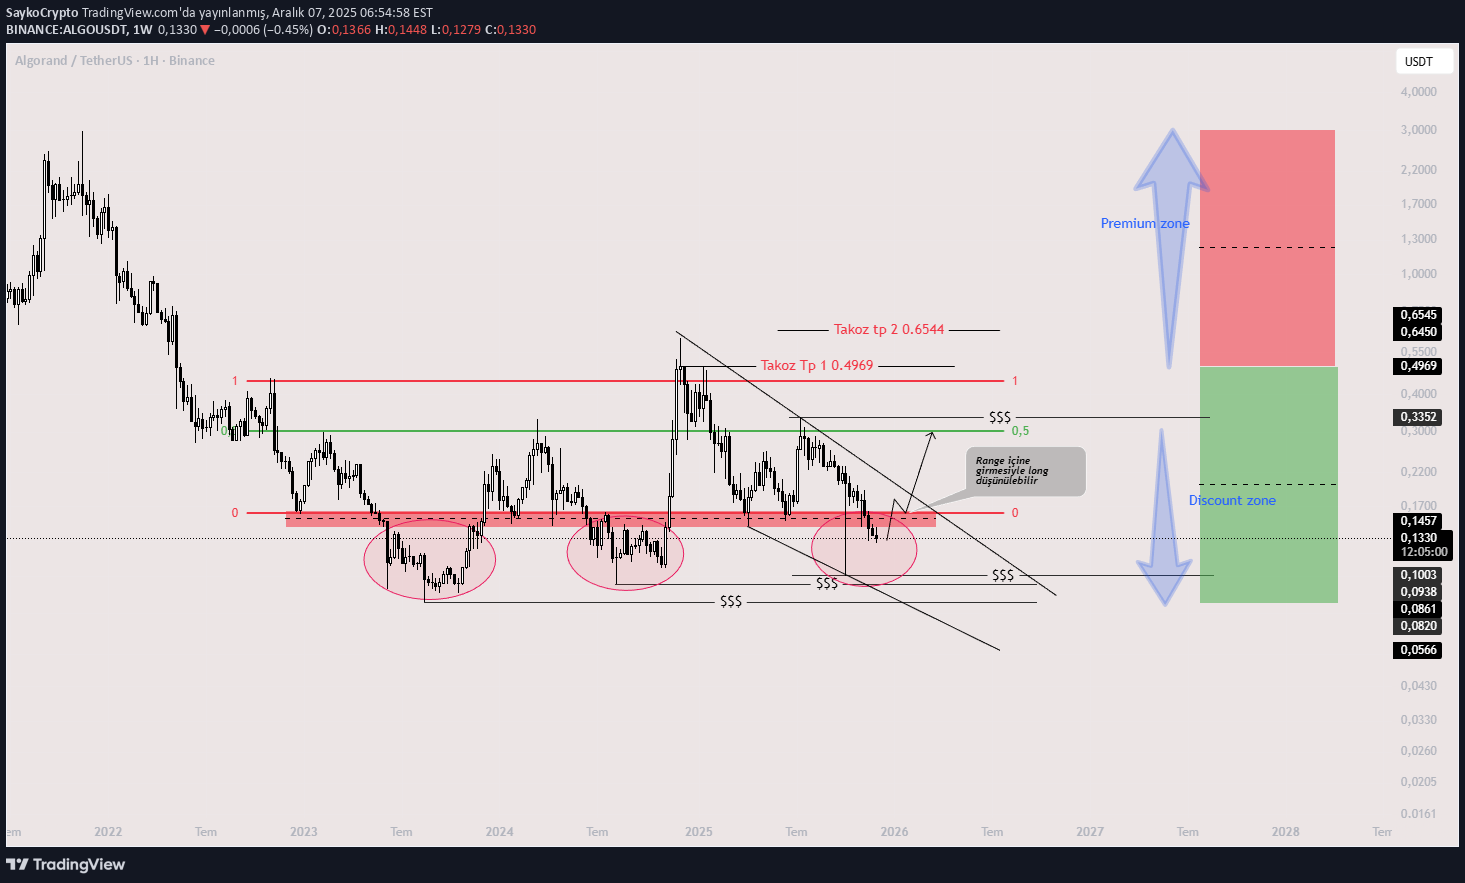
A long position can be considered when the wedge breaks on the weekly chart and the price moves into the range. The chart is for tracking purposes only. It does not contain investment advice!!
Crypto4light
ایده ترید هوشمندانه دسامبر: استراتژی ورود و خروج ALGO/USDT قبل از پایان سال
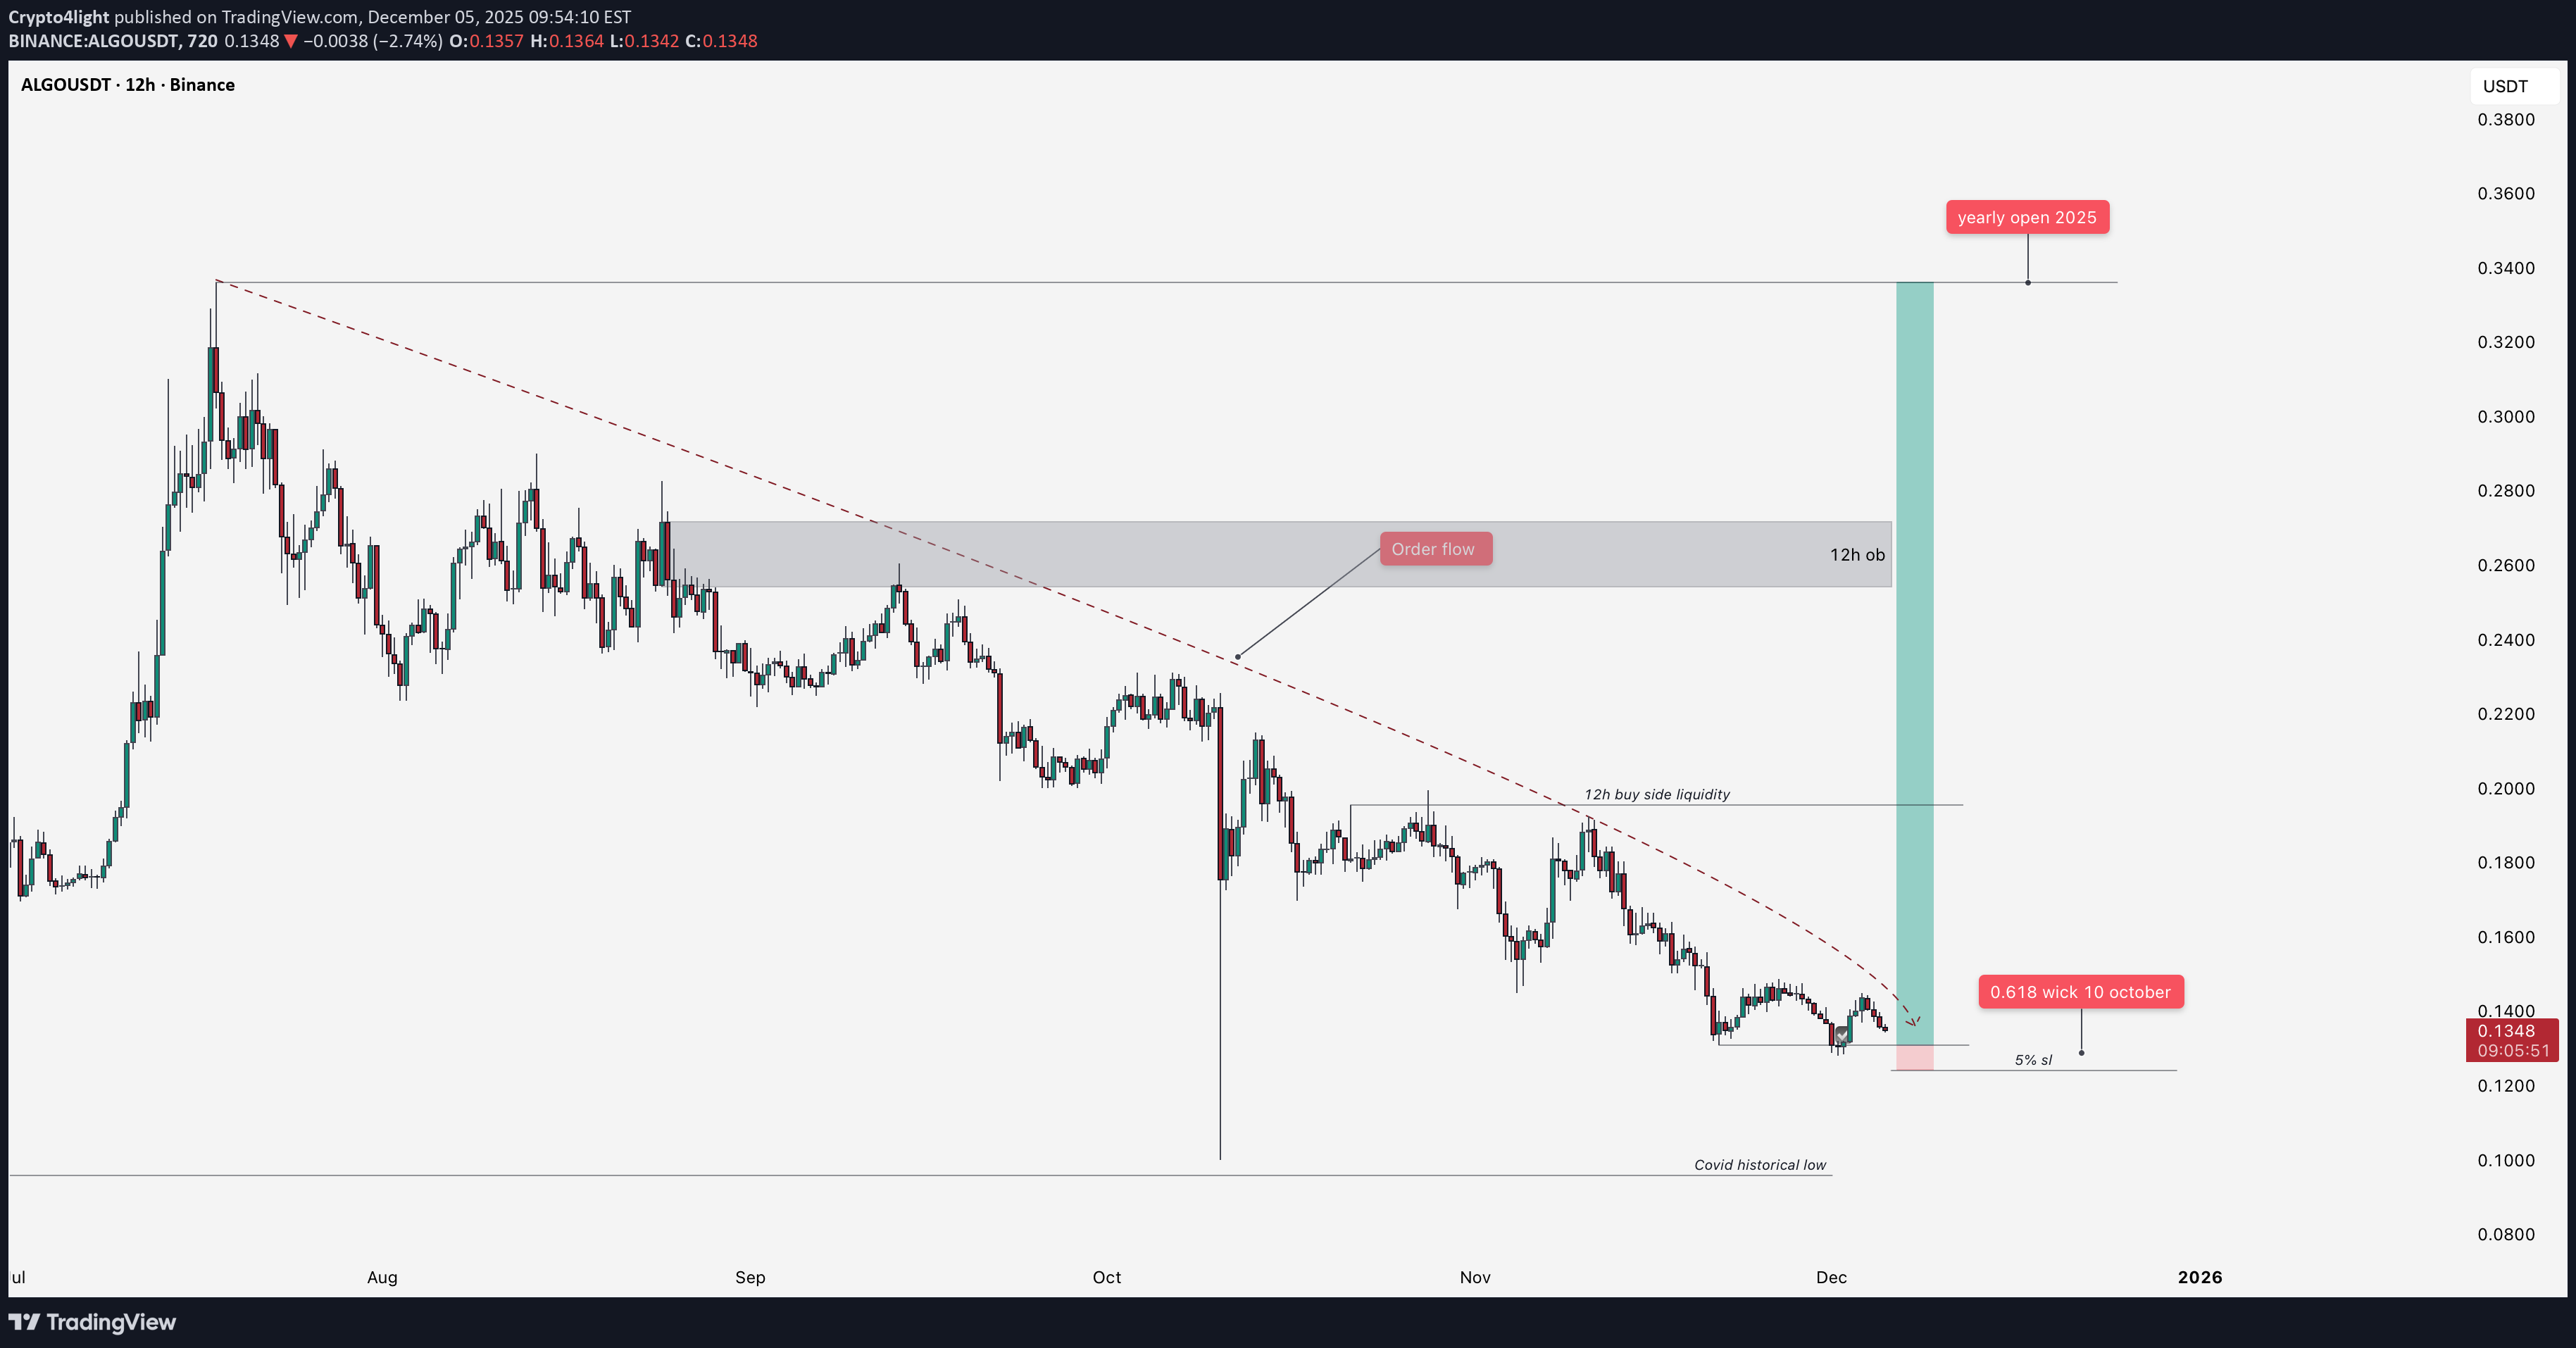
Main local trade idea for ALGOUSDT Downtrend since July 2025 with sellers order flow - will be like a targets for hunt liquidity After 10 October we formed correction 0.618 of wick D tf Sl my personal is around 5% with 2x lev Target Yearly open 2025 Also targets for step by step fixation Buy side liquidity (after this level sl to be) 12h order block and yearly open

MoonriseTA
تحلیل ماهانه ارز دیجیتال آلگوراند (ALGO): پیشبینی نزولی بر اساس استراتژی مدیریت ریسک نهادی
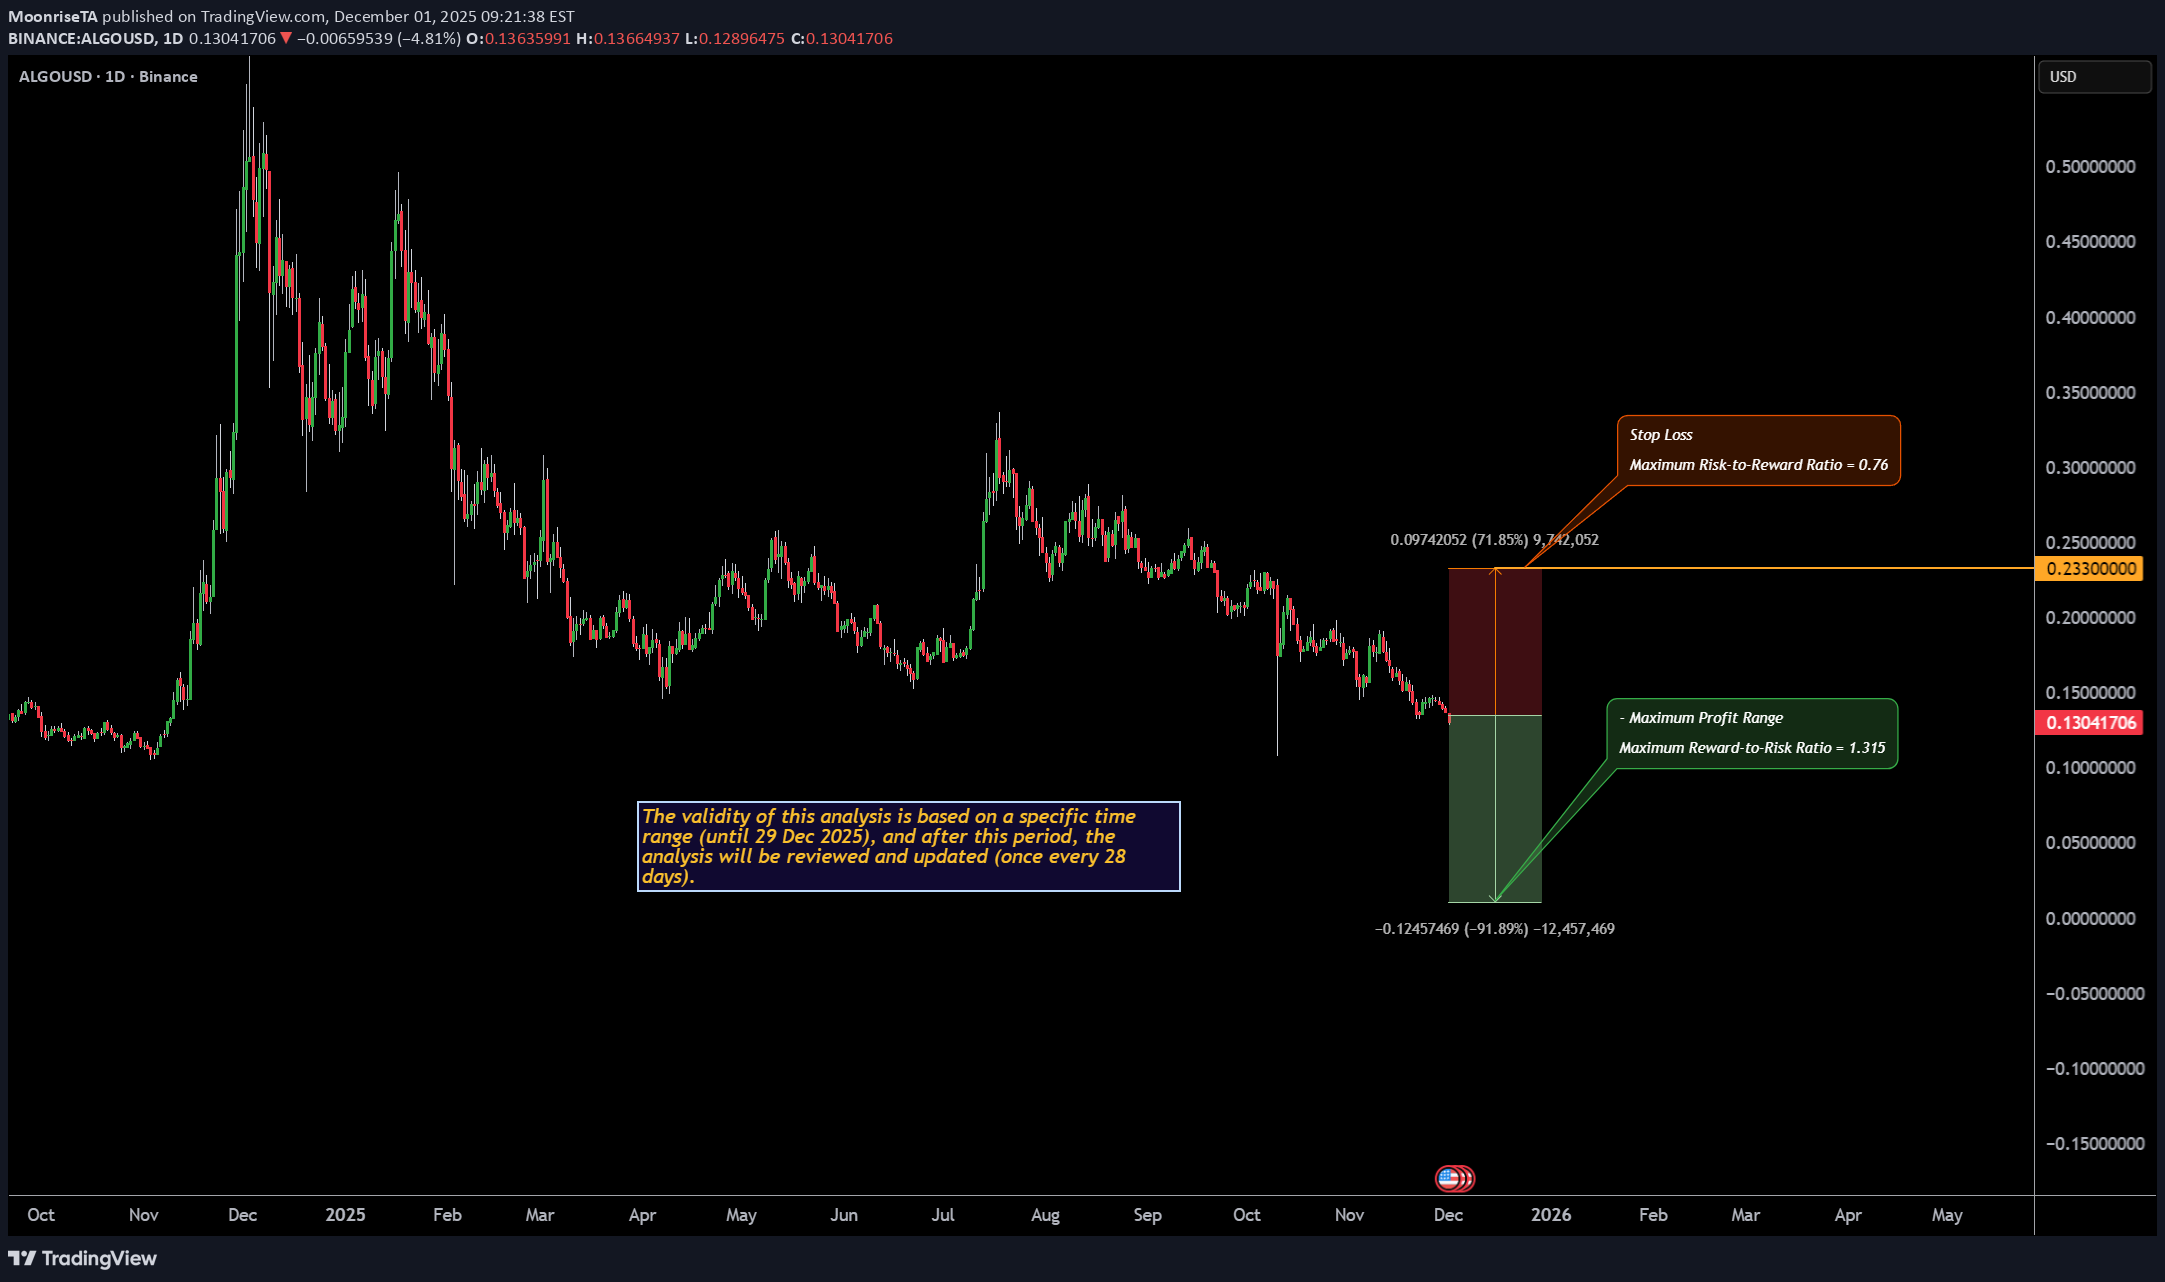
The analyst expects Algorand's price to decline by the specified end time, based on quantitative analysis. The take-profit level only highlights the potential price range during this period — it’s optional and not a prediction that the market will necessarily reach it. You don’t need to go all-in or use leverage to trade wisely. Allocating just a portion of your funds helps keep overall risk low and ensures a more sustainable approach. Our strategy is built on institutional portfolio management principles, not the high-risk, all-in trading styles often promoted on social media. Results are evaluated over the entire analysis period, regardless of whether the take-profit level is reached.

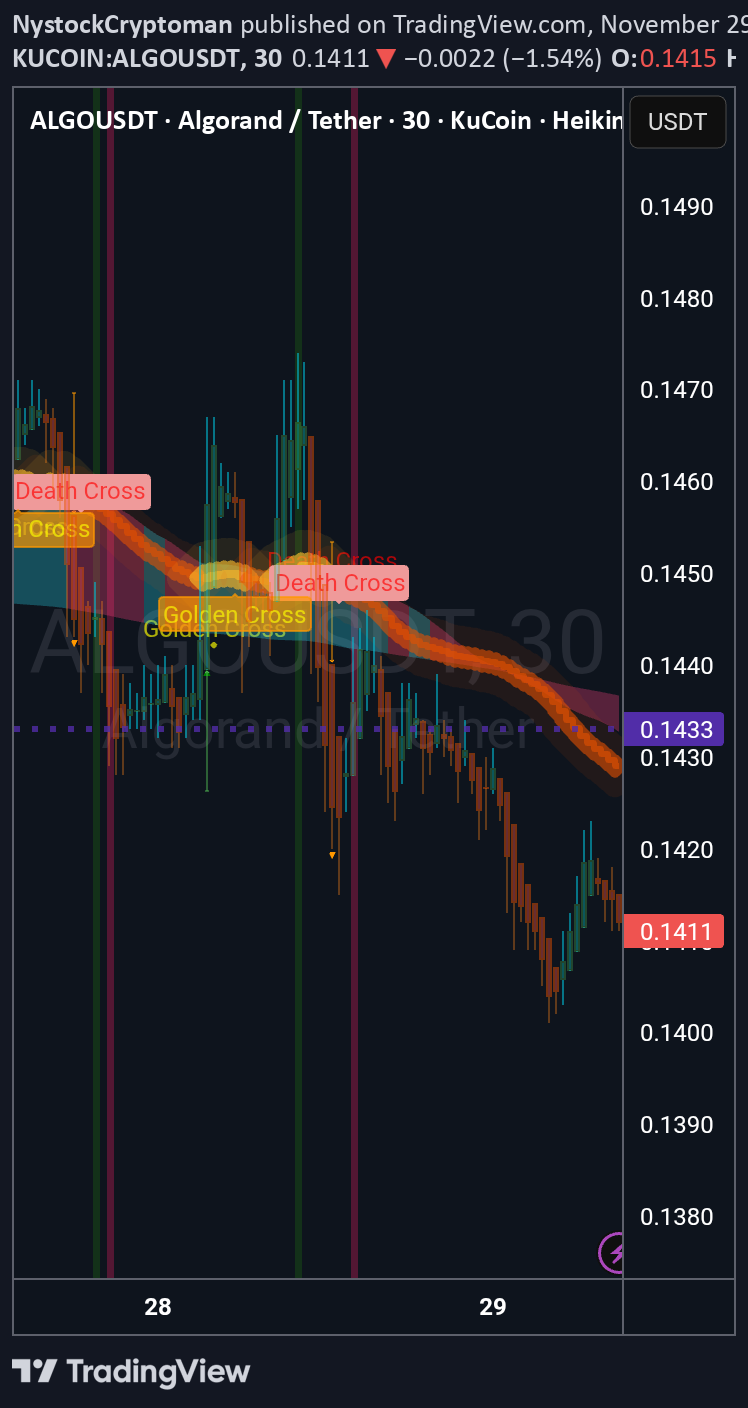
سیگنال صعودی قوی: آیا زمان ورود به بازار فرارسیده است؟

above the 50ma ++ super hormonica trend line. Can be Bull for now, join for updates ty
TRADEKING_1988
تحلیل تکنیکال: راز ورود در نوسانها با شکست خط روند!

- Trendline retests RED ... a question of time it brakes -Fakeout green trendline -Liquidity taken -Support

WaveRiders2
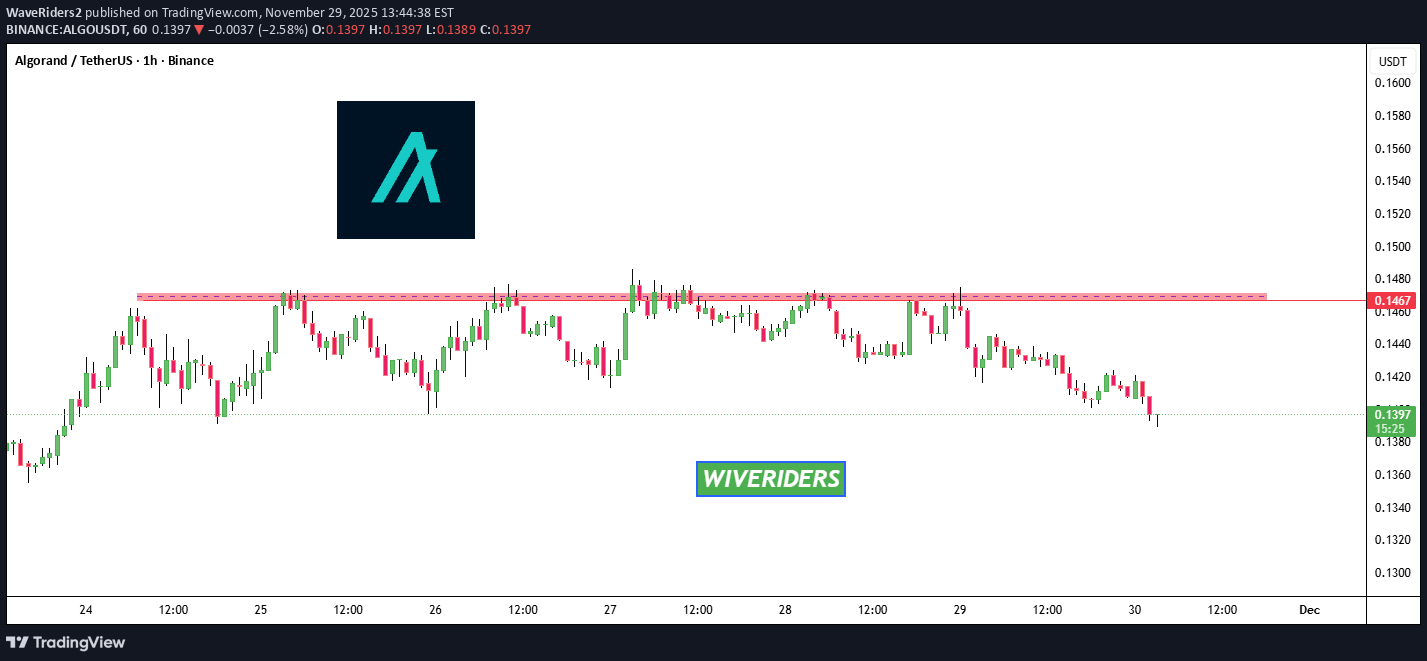
الگوی نزولی در راه است؟ تحلیل تکنیکال و بهروزرسانیهای مهم خط روند!
Below the 50ma ++ super hormonica trend line. Can be Bear for now, join for updates ty
Disclaimer
Any content and materials included in Sahmeto's website and official communication channels are a compilation of personal opinions and analyses and are not binding. They do not constitute any recommendation for buying, selling, entering or exiting the stock market and cryptocurrency market. Also, all news and analyses included in the website and channels are merely republished information from official and unofficial domestic and foreign sources, and it is obvious that users of the said content are responsible for following up and ensuring the authenticity and accuracy of the materials. Therefore, while disclaiming responsibility, it is declared that the responsibility for any decision-making, action, and potential profit and loss in the capital market and cryptocurrency market lies with the trader.