
ALCX
Alchemix
| تریدر | نوع سیگنال | حد سود/ضرر | زمان انتشار | مشاهده پیام |
|---|---|---|---|---|
No results found. | ||||
Price Chart of Alchemix
سود 3 Months :
سیگنالهای Alchemix
Filter
Sort messages by
Trader Type
Time Frame

Bithereum_io
آیا ALCX به زودی میترکد؟ فرصت خرید در الگوی مثلث نزولی (با اهداف جذاب!)
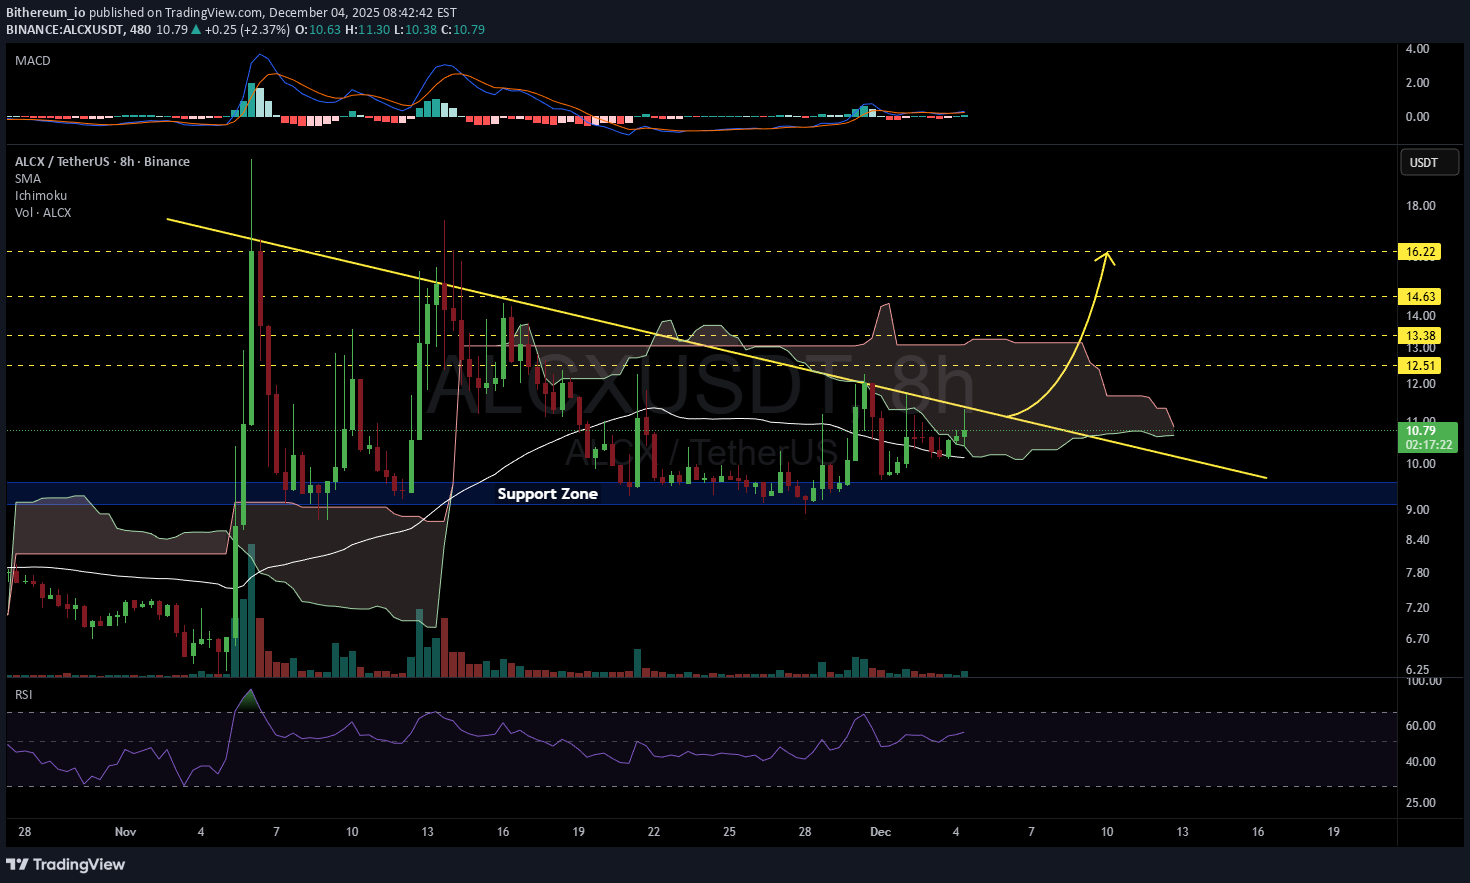
#ALCX is moving inside a descending triangle on the 8H timeframe chart. The price is trading above the SMA50 and inside the Ichimoku cloud. The RSI is signaling the possibility of upward movement. Keep an eye on it. In case of a breakout above the triangle resistance, the potential targets are: 🎯 $12.51 🎯 $13.38 🎯 $14.63 🎯 $16.22 ❌ Invalidation: an 8H candle closing below the support zone. ⚠️ Always remember to use a tight stop-loss and maintain proper risk management.

Alpha-GoldFX
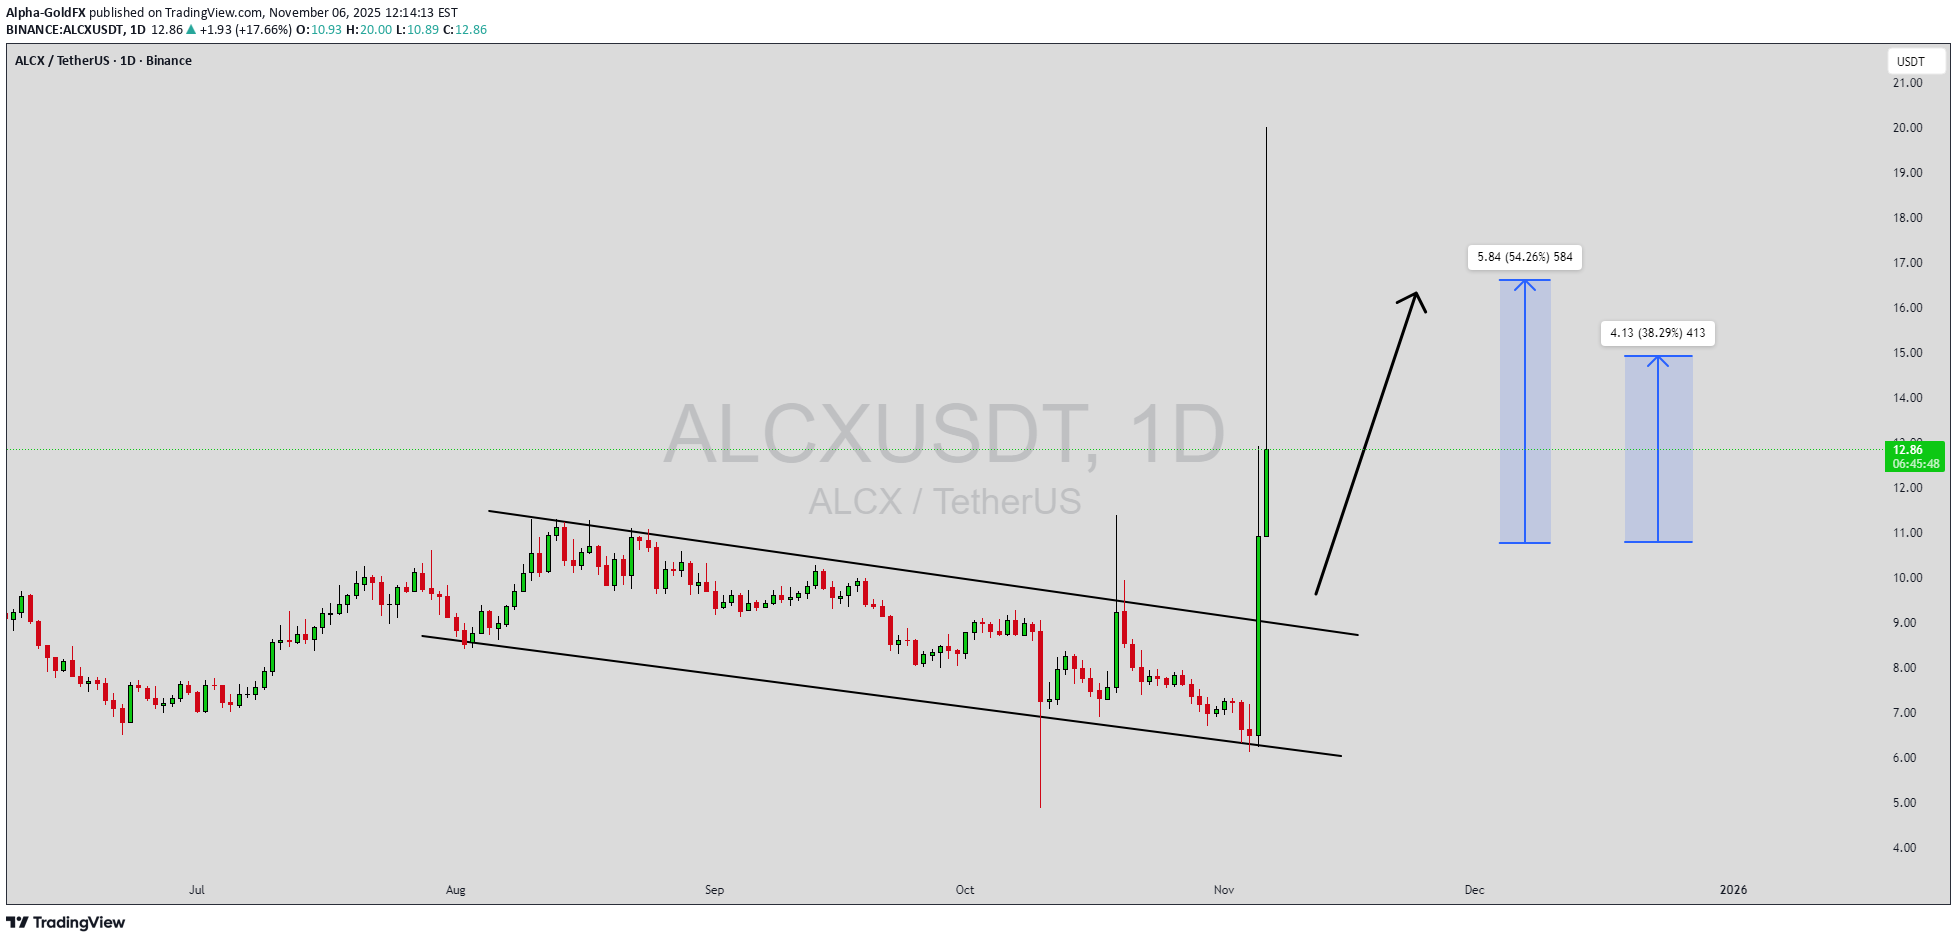
الکسوس (ALCX) در آستانه انفجار قیمتی ۹۰ درصدی؟ (تشکیل الگوی گُوِه نزولی)
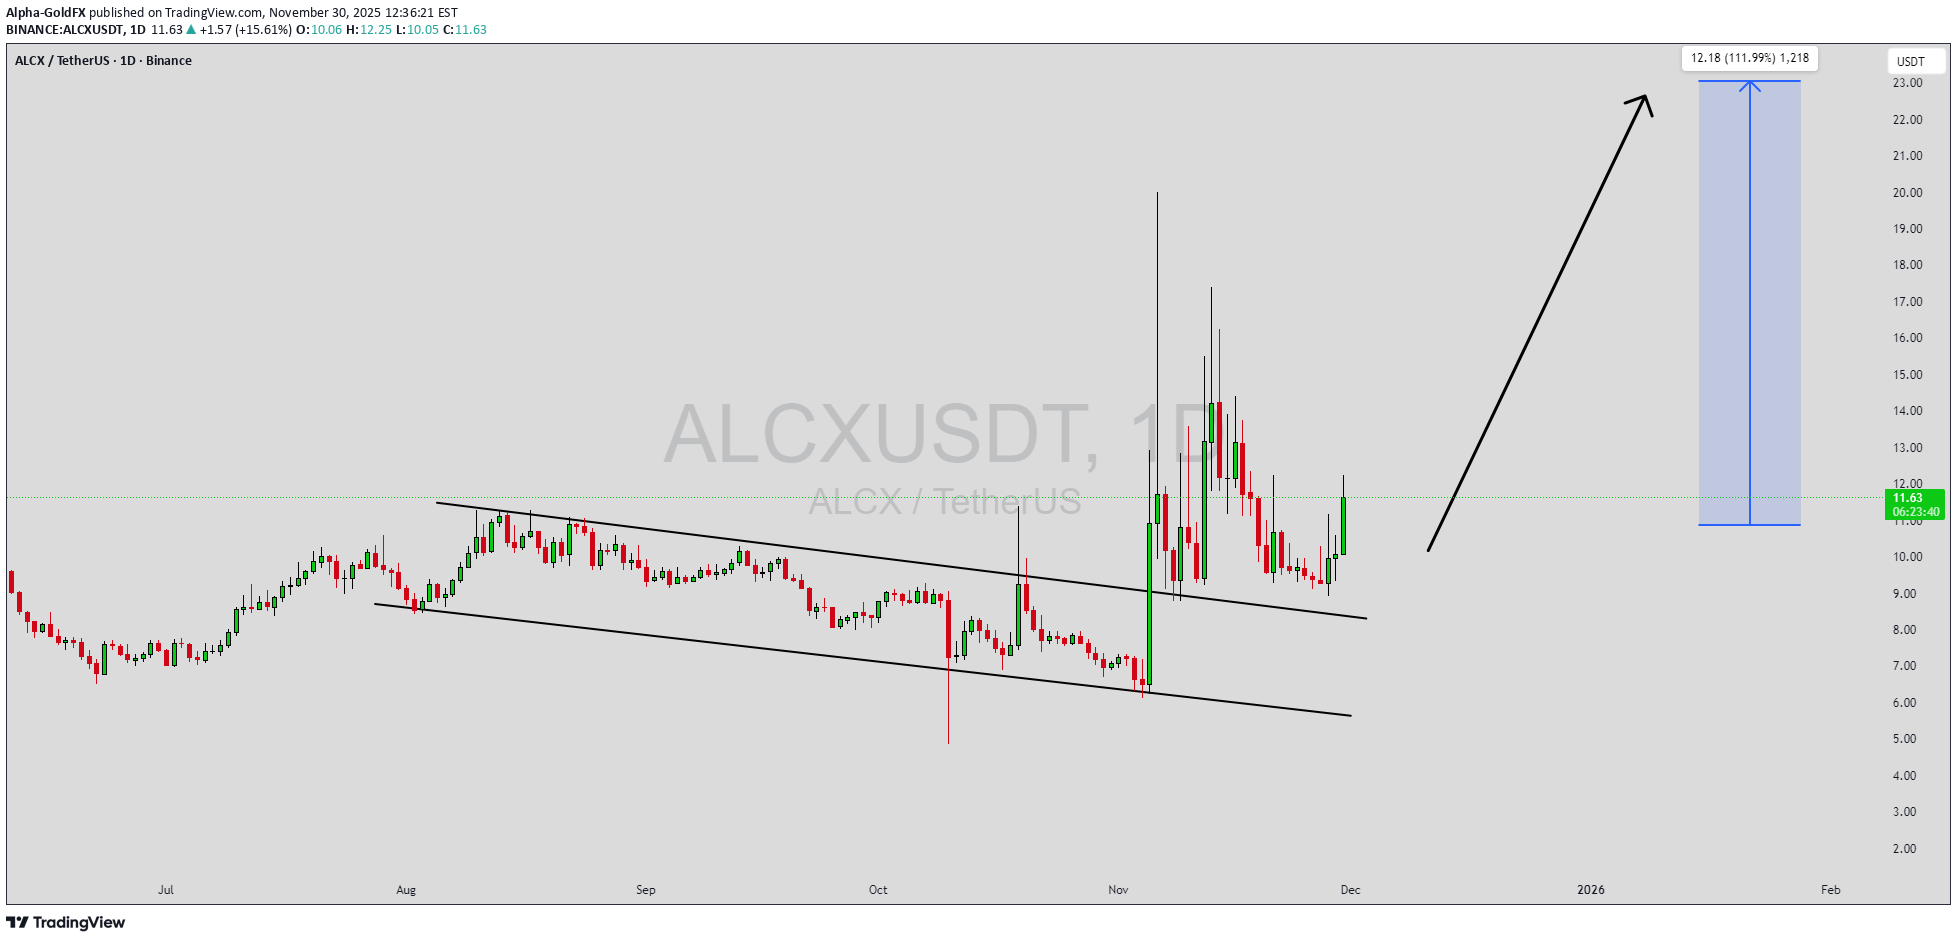
ALCXUSDT is forming a clear falling wedge pattern, a classic bullish reversal signal that often indicates an upcoming breakout. The price has been consolidating within a narrowing range, suggesting that selling pressure is weakening while buyers are beginning to regain control. With consistent volume confirming accumulation at lower levels, the setup hints at a potential bullish breakout soon. The projected move could lead to an impressive gain of around 90% to 100% once the price breaks above the wedge resistance. This falling wedge pattern is typically seen at the end of downtrends or corrective phases, and it represents a potential shift in market sentiment from bearish to bullish. Traders closely watching ALCXUSDT are noting the strengthening momentum as it nears a breakout zone. The good trading volume adds confidence to this pattern, showing that market participants are positioning early in anticipation of a reversal. Investors’ growing interest in ALCXUSDT reflects rising confidence in the project’s long-term fundamentals and current technical strength. If the breakout confirms with sustained volume, this could mark the start of a fresh bullish leg. Traders might find this a valuable setup for medium-term gains, especially as the wedge pattern completes and buying momentum accelerates. ✅ Show your support by hitting the like button and ✅ Leaving a comment below! (What is your opinion about this Coin?) Your feedback and engagement keep me inspired to share more insightful market analysis with you!
Alpha-GoldFX
الگو سقوطی ALCRUSDT: آماده انفجار صعودی ۲۰ درصدی؟
ALCRUSDT is forming a clear falling wedge pattern, a classic bullish reversal signal that often indicates an upcoming breakout. The price has been consolidating within a narrowing range around $0.045 USDT, suggesting that selling pressure is weakening while buyers are beginning to regain control. With consistent volume confirming accumulation at lower levels, the setup hints at a potential bullish breakout soon. The projected move could lead to an impressive gain of around 20% to 30%+ once the price breaks above the wedge resistance, drawing eyes to ALCRUSDT price prediction charts. This falling wedge pattern is typically seen at the end of downtrends or corrective phases, and it represents a potential shift in market sentiment from bearish to bullish. Traders closely watching ALCRUSDT are noting the strengthening momentum as it nears a breakout zone near $0.048. The good trading volume adds confidence to this pattern, showing that market participants are positioning early in anticipation of a reversal in this Solana ecosystem token. Investors’ growing interest in ALCRUSDT reflects rising confidence in the project’s long-term fundamentals and current technical strength, especially amid zk-proof integrations for scalable DeFi. If the breakout confirms with sustained volume, this could mark the start of a fresh bullish leg. Traders might find this a valuable setup for medium-term gains, especially as the wedge pattern completes and buying momentum accelerates in falling wedge breakout crypto plays. ✅ Show your support by hitting the like button and ✅ Leaving a comment below! (What is You opinion about this Coin) Your feedback and engagement keep me inspired to share more insightful market analysis with you!

zenkedisi
تحلیل ALCX: چطور در فاز تجمعی، کف قیمت را در الگوی گُوِه شناسایی کنیم؟
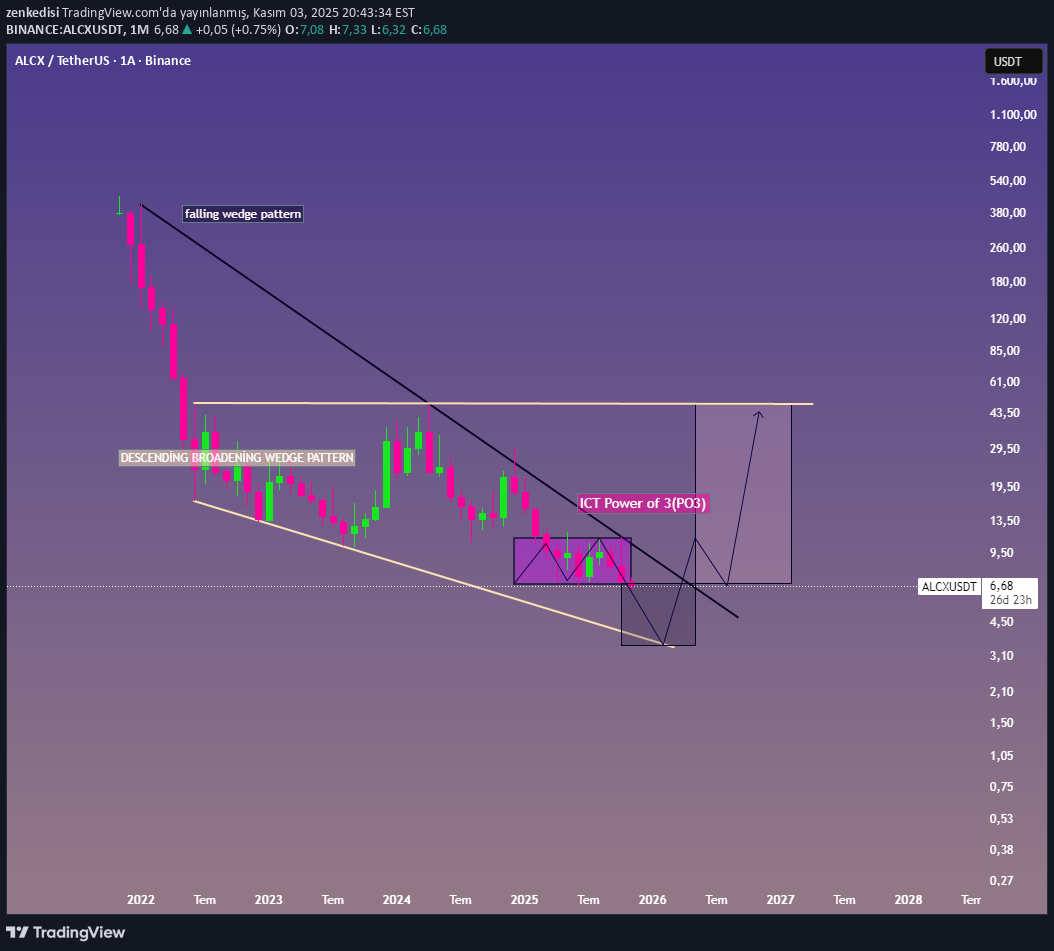
There were a few structures that caught my eye in the long term, unfortunately spot buying analyzes are not suitable in short term technical terms. po3 stages: 1-Accumulation or Accumulation Phase 2-Manipulation Phase 3-Expansion-Distribution Phase descending broadening wedge pattern structures in the long run channel alt regions are unit oriented The entire formation is a falling wedge, that is, a descending wedge as we know it. In this market, in the descending structures, the support and resistance are popped with needles without any retest, the question of where to collect them rather than saying "here is support, this is resistance" like everyone else, is the main issues we need to look at in these structures, in our humble opinion...

WaveRiders2
ALCX Trading Update
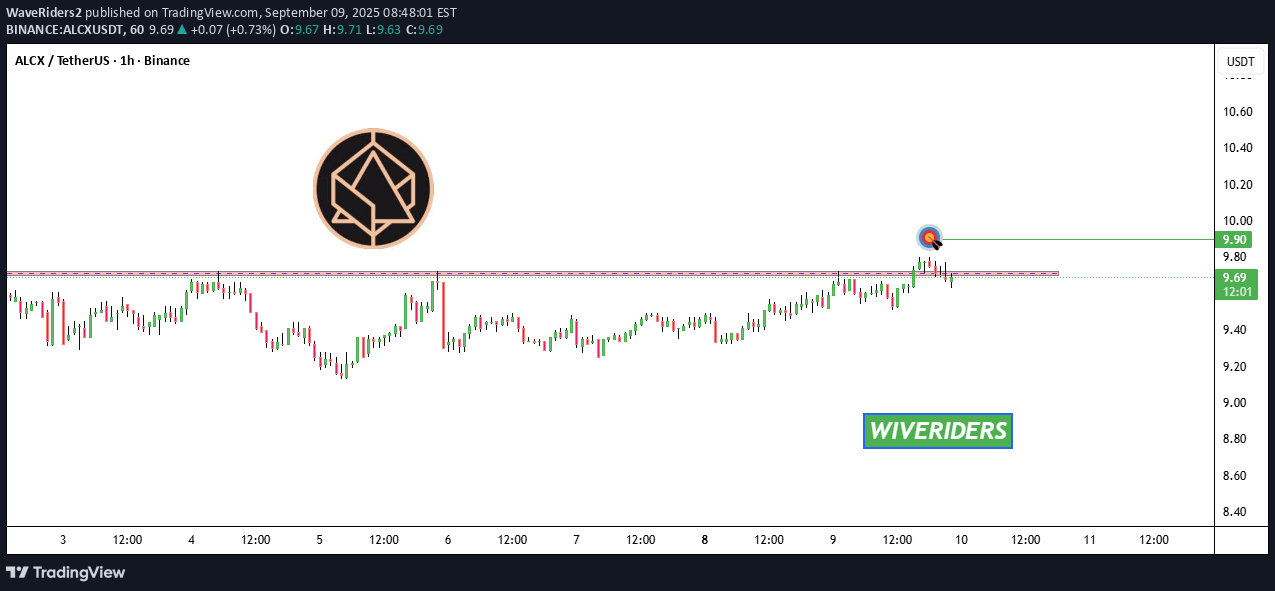
$ALCX Trading Update $ALCX is currently testing the red resistance zone 🔴. If bulls manage to break out above this level, the first target 🎯 will be the green line level, where buyers are expected to push price next. ⚠️ Confirmation of breakout is key before entering long. Happy trading ✨
Bithereum_io
ALCXUSDT 1D

#ALCX — Bullish Breakout Loading? 🔥#ALCX is trading inside a Descending Broadening Wedge pattern on the daily chart.It’s currently resting on a strong support zone, formed by the MA50, MA100, and the Ichimoku Cloud — a confluence of key indicators signaling potential strength.A bullish breakout could be on the horizon. If price breaks above the wedge resistance, the potential upside targets are:🎯 $12.27🎯 $15.53🎯 $18.16🎯 $20.79🎯 $24.54🎯 $29.31⚠️ Always use a tight stop-loss to manage risk and protect your capital.

DakuNit
ALCX

we all have experienced shitcoin performance, where unlimited supply of them had significant growth. what do you think that projects with very low mc and supply will do these days?personally i have some projects under my radar, where i think that will be very hot ones, and one of them it is ALCX. very low supply, low mc, listed on several T1 exchanges, to me this project the next 10-20 days it should make a big jump, what i would like to see, it is 10x just for the heat up.NFA DYOR

Zorroreny
ALCX - are we about to pull another OM move?

ALCX is still trying to find the bottom, however we are sitting at RSI support line which always brought bounce up and we are also oversold. So expecting bounce up soon and when looking at pattern we see similarities to OM move from the bottom. Not saying we will do the same move but a push toward ATH would be a logic one, TP ranges that I currently look at are fibb 0.786 pivot and ATH level.
DakuNit


UNIVERSOFSIGNALS
Univers Of Signals | ACLX : Spot Signal

new signalsjoin us in telegram : t.me/UNIVERSOFSIGNALS
Disclaimer
Any content and materials included in Sahmeto's website and official communication channels are a compilation of personal opinions and analyses and are not binding. They do not constitute any recommendation for buying, selling, entering or exiting the stock market and cryptocurrency market. Also, all news and analyses included in the website and channels are merely republished information from official and unofficial domestic and foreign sources, and it is obvious that users of the said content are responsible for following up and ensuring the authenticity and accuracy of the materials. Therefore, while disclaiming responsibility, it is declared that the responsibility for any decision-making, action, and potential profit and loss in the capital market and cryptocurrency market lies with the trader.