
AI
Sleepless AI
| تریدر | نوع سیگنال | حد سود/ضرر | زمان انتشار | مشاهده پیام |
|---|---|---|---|---|
No results found. | ||||
Price Chart of Sleepless AI
سود 3 Months :
سیگنالهای Sleepless AI
Filter
Sort messages by
Trader Type
Time Frame

SaykoCrypto
تحلیل روزانه هوش مصنوعی (AI) و تتر (USDT): سطوح کلیدی حمایت و مقاومت!
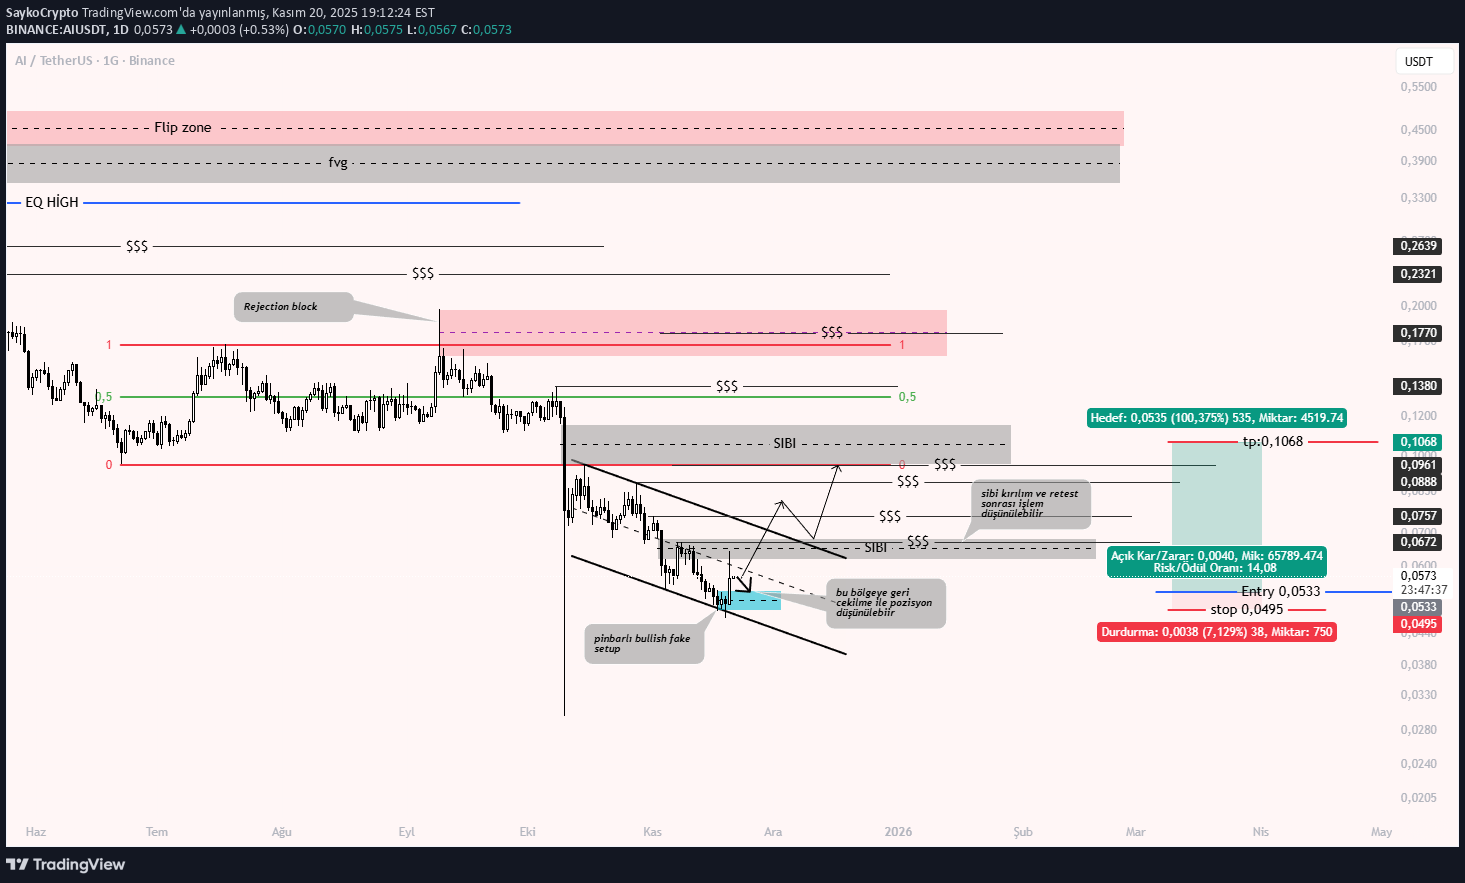
I showed the support, resistance and liquidity zones on the chart. There is a bullish fake setup with pinbar... With the price rising on Sibi or the channel breaking, the range alt band, the middle band and the upper band become the target. Trades can be taken from fake setup, but I did not prefer it because the stop risk is 15%. Normally, trades can be taken with the day closing candle. (0.0571 ENTRY) The chart is for tracking purposes only. It does not contain investment advice!!!

BandForBands
هوش مصنوعی در آستانه انفجار: رازهای نهفته در منطقه انباشت 250 روزه!


Bithereum_io
آینده هوش مصنوعی (AI): قیمت به کجا میرسد؟ پیشبینی اهداف صعودی پس از شکست مقاومت!

#AI is moving inside a falling wedge pattern on the daily chart and has bounced off the wedge support line. In case of a breakout above the wedge resistance and the daily EMA100, the potential targets are: 🎯 $0.1299 🎯 $0.1654 🎯 $0.2210 🎯 $0.2659 🎯 $0.3107 🎯 $0.3747 🎯 $0.4561 ⚠️ Always remember to use a tight stop-loss and maintain proper risk management.

CryptoNuclear
AIUSDT در نقطه عطف: آیا این کف قیمتی، سکوی پرتاب یک صعود بزرگ است؟

Overview: AIUSDT is currently in a deep accumulation phase after a long decline from the peak at 0.8608. Price is consolidating within the critical support zone of 0.0963 – 0.1257 (highlighted in yellow). This level has been tested multiple times, showing strong interest from both buyers and sellers. On the 2D timeframe, the structure suggests that the market is waiting for a decisive move: will this support hold as the base for a reversal, or will it break down to extend the bearish trend? --- 🔑 Key Technical Levels Main Support: 0.0963 – 0.1257 Secondary Support: 0.0820 (historical level) Key Resistances: 0.1583 → first breakout confirmation 0.2160 → strong psychological resistance 0.2846 → major swing target 0.4549 → higher timeframe resistance 0.7848 → major supply zone from previous distribution --- 📈 Bullish Scenario Trigger: A confirmed 2D close above 0.1583 with solid volume. Momentum confirmation: Formation of higher lows and strong bullish candles. Upside targets: 1. 0.1583 (initial resistance) 2. 0.2160 (trend validation) 3. 0.2846 (swing extension) Bullish signals: RSI bullish divergence or a bullish engulfing candle forming at support. --- 📉 Bearish Scenario Trigger: A confirmed 2D close below 0.0963 with increasing sell volume. Retest confirmation: If price retests the 0.0963 – 0.1257 zone and fails to reclaim it, the area turns into resistance. Downside targets: Next support at 0.0820, with risk of further price discovery to the downside. Bearish signals: Long upper wicks near resistance combined with strong selling volume. --- 📊 Structure & Pattern Current structure resembles an accumulation range following a prolonged downtrend. The longer price stays within this range, the stronger the eventual breakout or breakdown move is likely to be. This pattern could evolve into re-accumulation or redistribution, depending on the direction of confirmation. --- 🎯 Trading Strategy For bulls: Consider entries near support with bullish confirmation, SL below 0.09, targets scaled across resistance levels. For bears: Wait for a confirmed breakdown below 0.0963, enter on failed retests, SL above 0.1257, target down to 0.0820. Note: Always apply risk management (max 1–2% risk per trade). --- 📌 Conclusion AIUSDT is at a critical decision zone. This range will decide whether the market starts a new bullish trend or continues its bearish extension. Holding support → potential for a strong rally. Breaking support → continuation of the downtrend. Traders should wait for volume confirmation and 2D candle closes before committing to a major position. --- #AIUSDT #CryptoAnalysis#SupportResistance #Altcoin #Breakout #Accumulation #TechnicalAnalysis #SwingTrade #PriceAction

House-of-Technicals
Double Bottom!
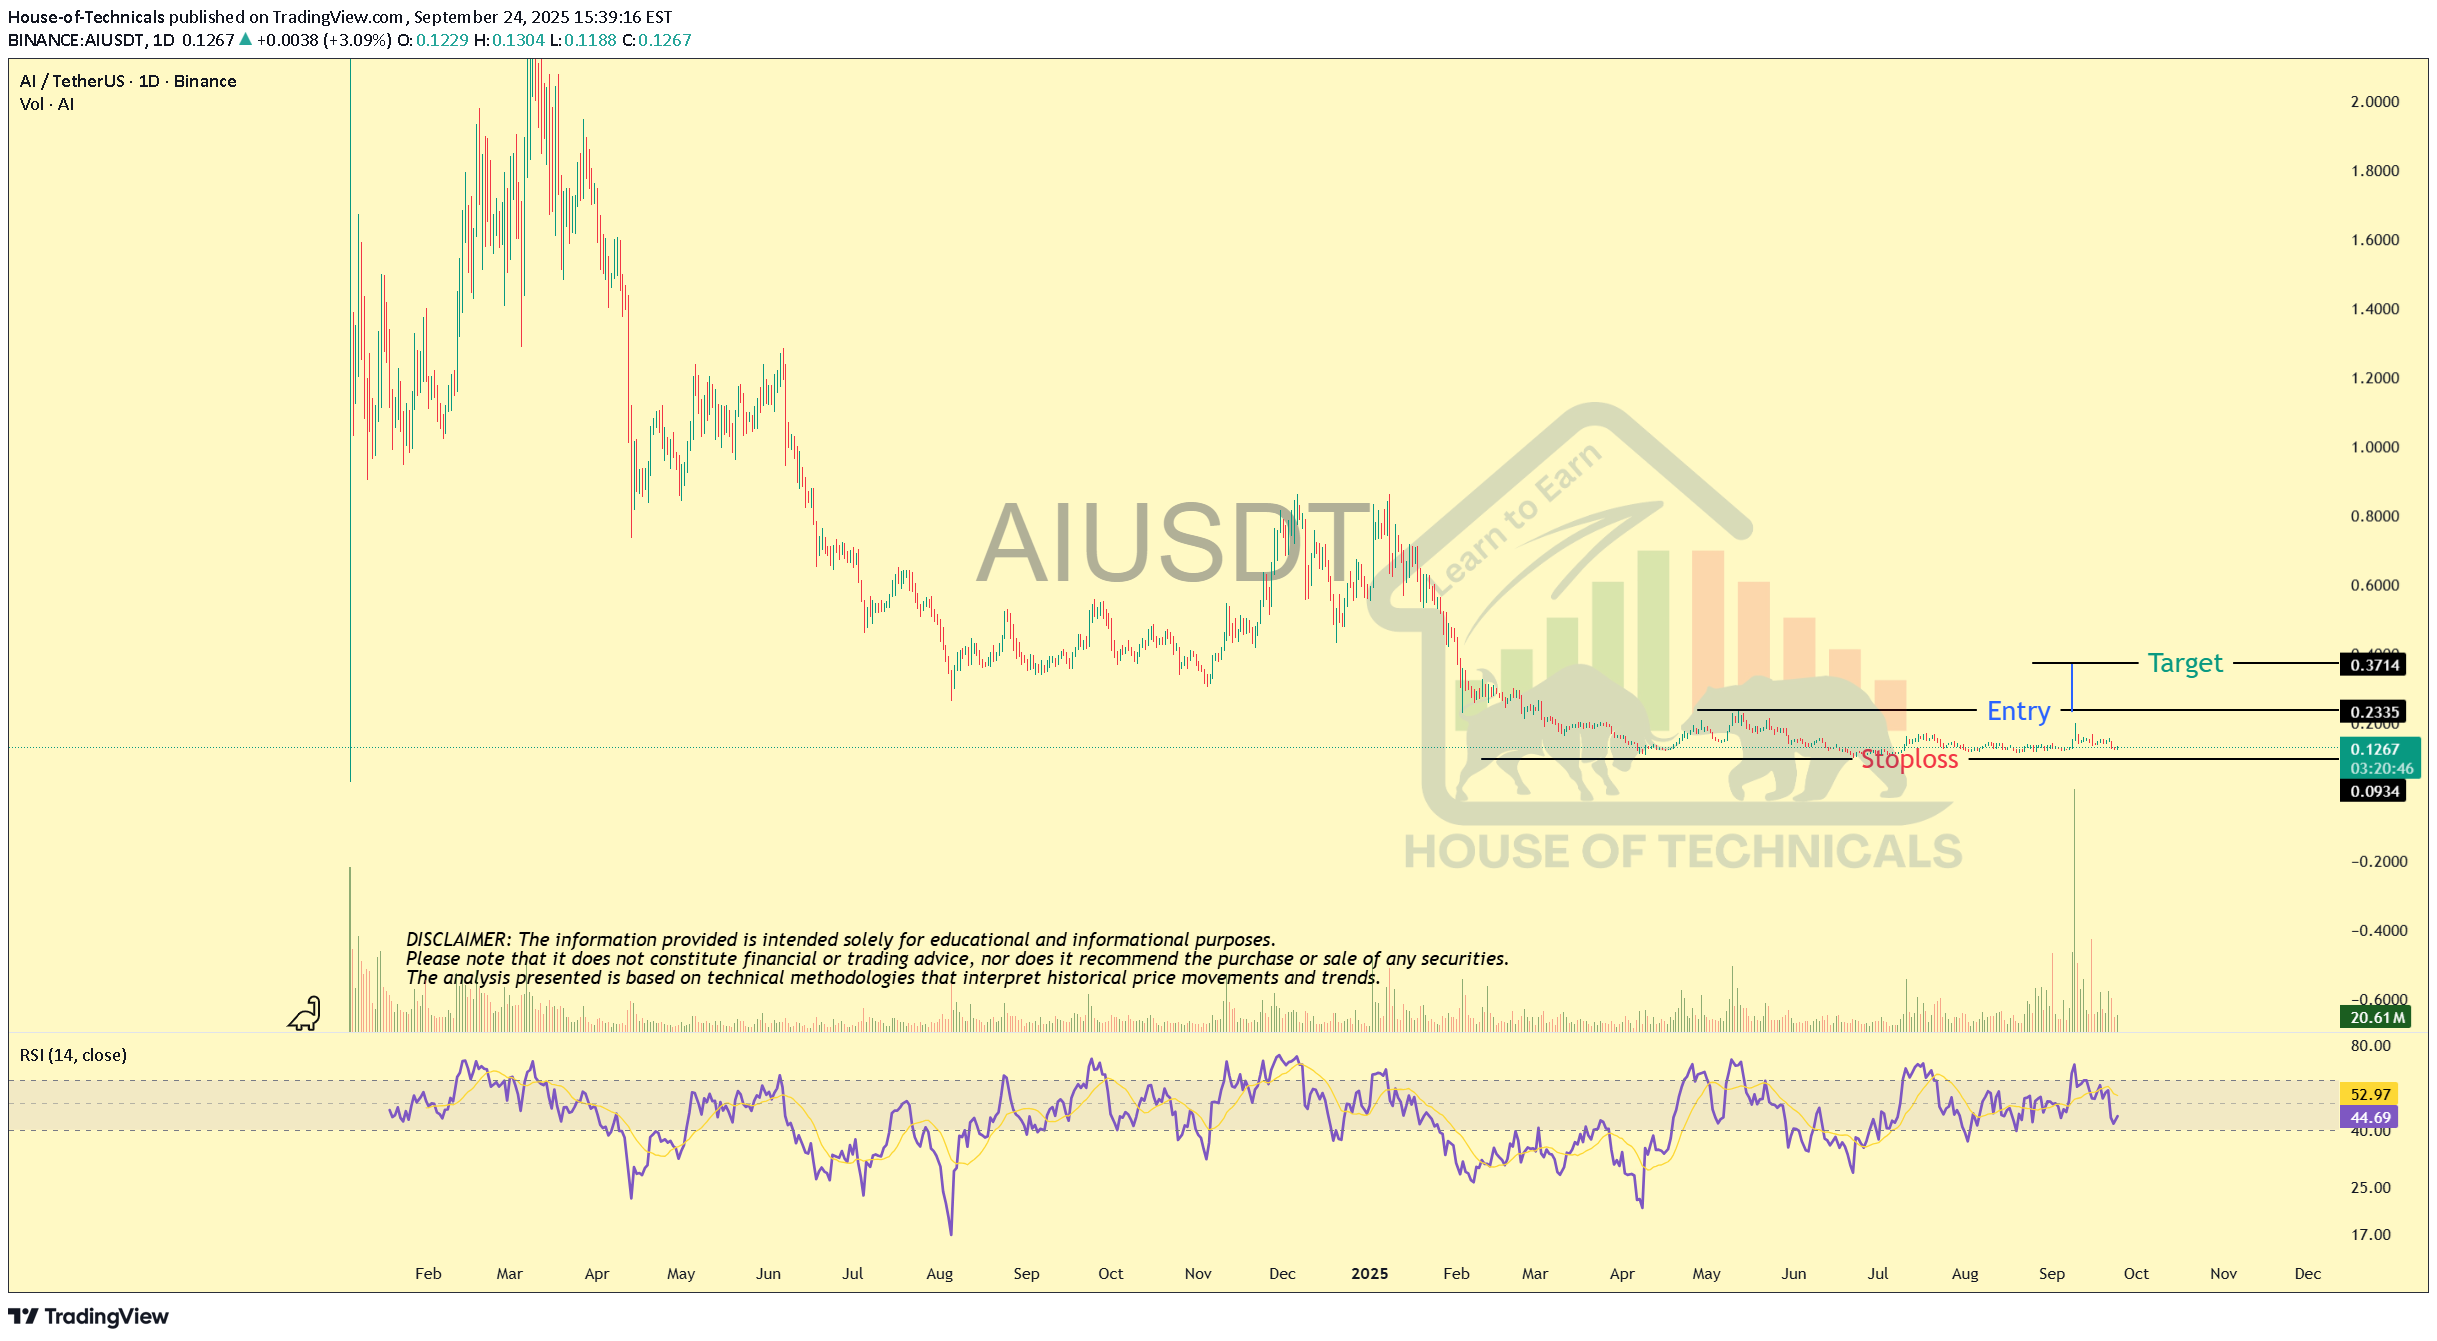
25-09-2025 Double bottom with Bullish Divergence. Crossing the LH may lead it towards the mentioned target.

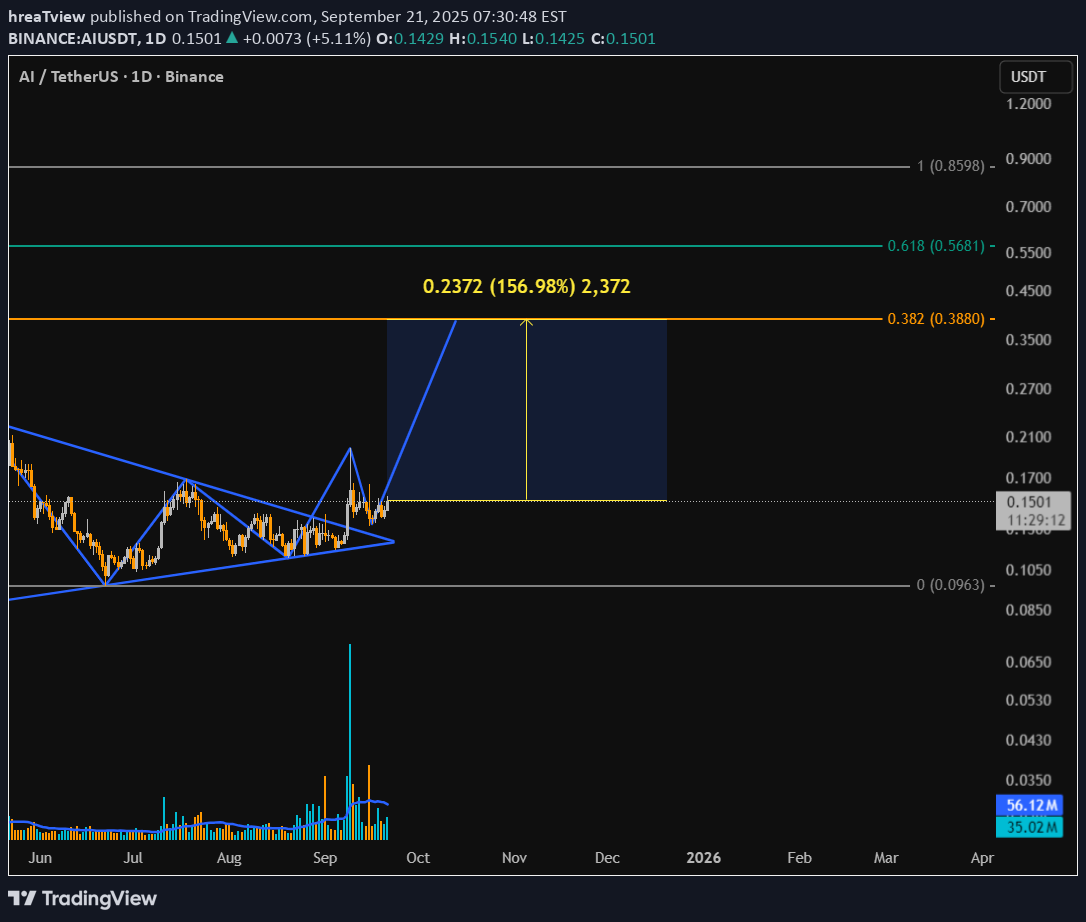
hreaTview

ZEUS_Market_Alerts
AI ANALYSIS
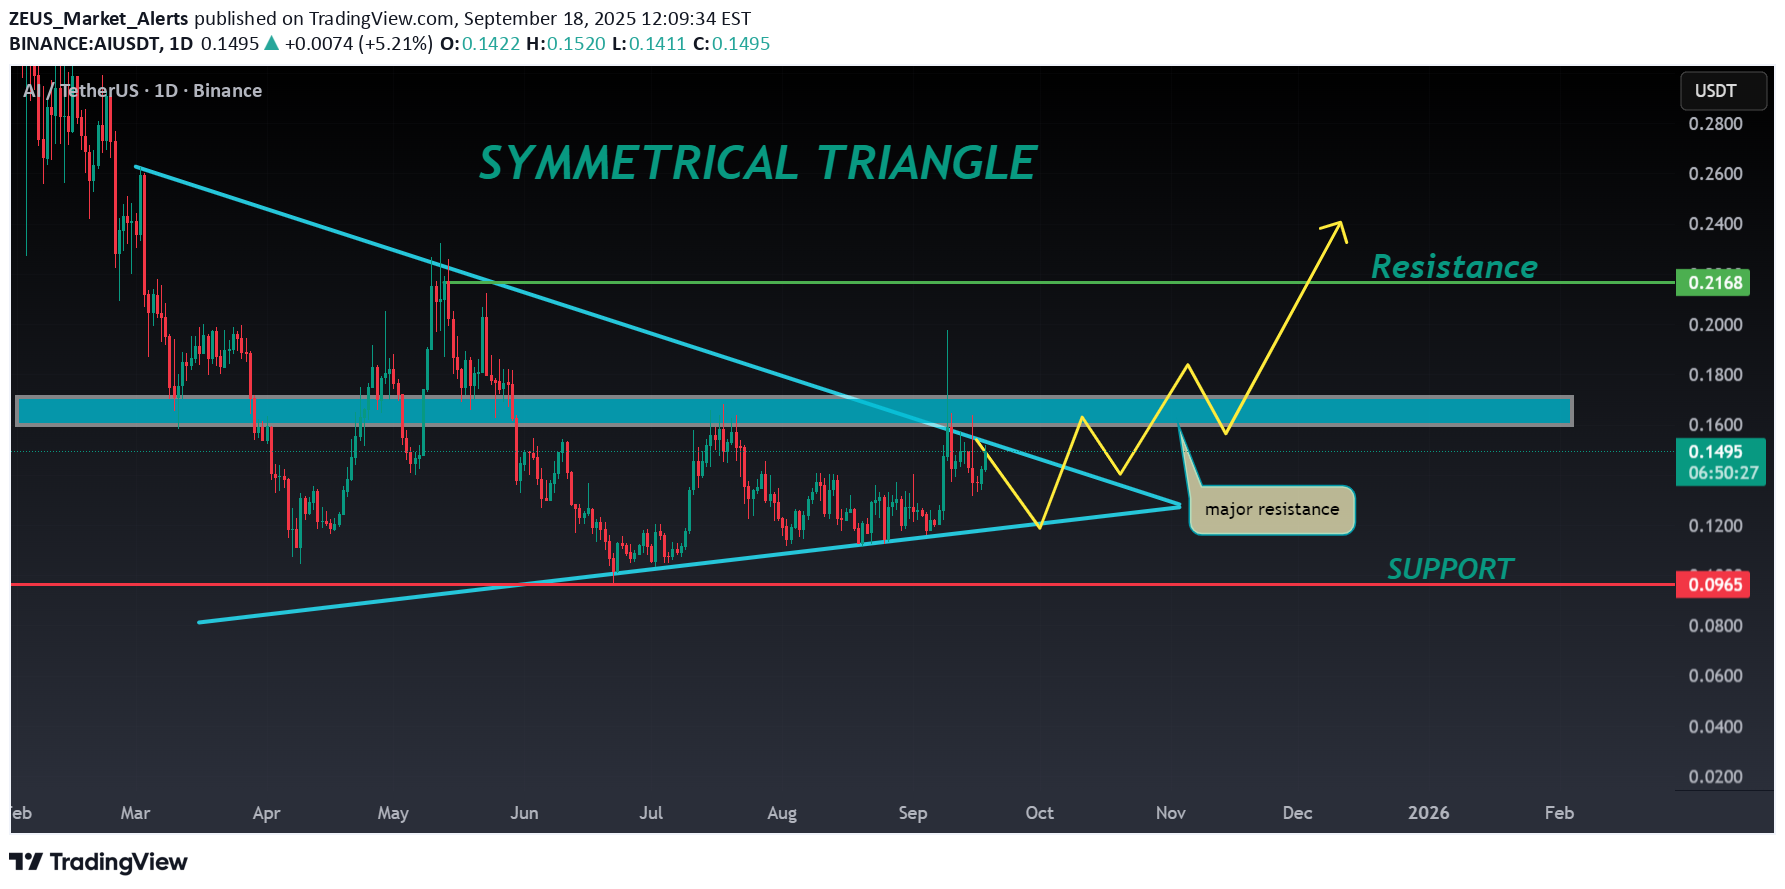
🔮#AI Analysis 💰💰 #AI is trading in a symmetrical triangle in a weekly time frame and if it breakouts with high volume then we can see a bullish momentum in #AI. Before that we will see little bit bearish movement . 🔖 Current Price: $0.1490 ⏳ Target Price: $0.2100 ⁉️ What to do? - We can trade according to the chart and make some profits in #AI. Keep your eyes on the chart, observe trading volume and stay accustom to market moves.💲💲 #AI #Cryptocurrency #Pump #DYOR

ninacryptotrade
AI/USDT – Bullish Breakout: Falling Wedge Targets +130%
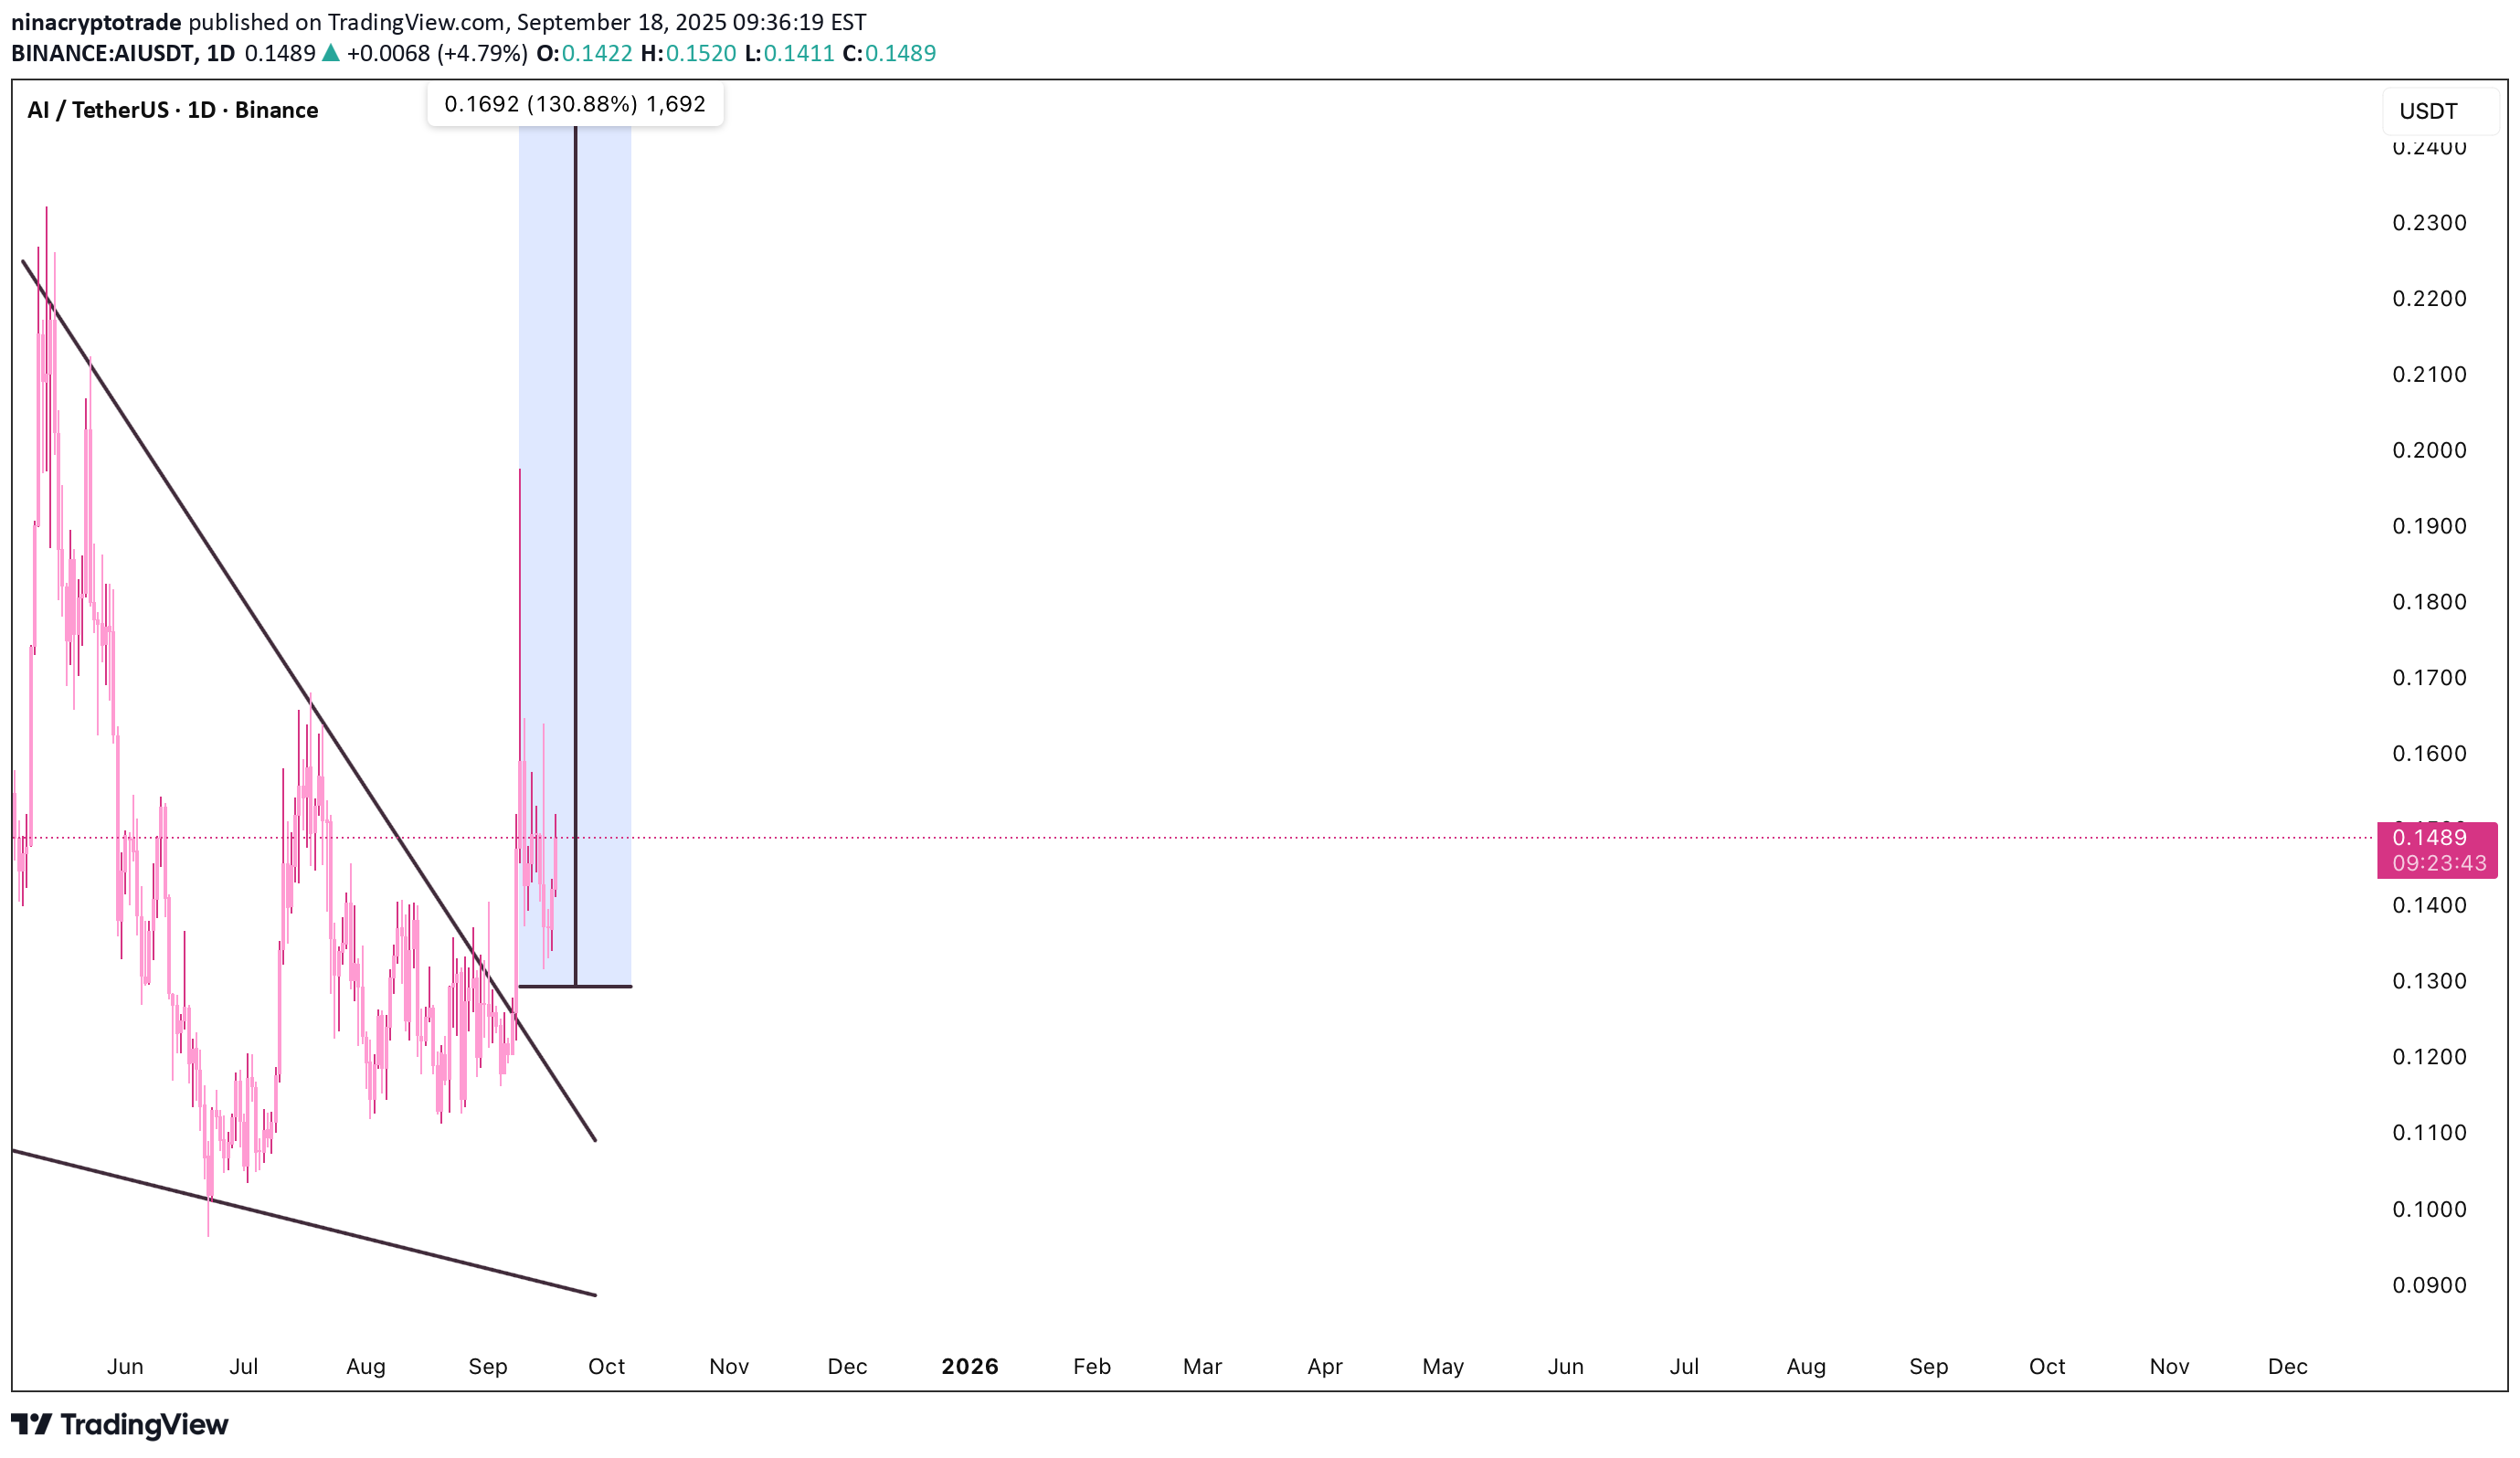
AI has broken out of a multi-month falling wedge pattern, with confirmation from a strong daily candle closing above the descending trendline. Current price is 0.1501 USDT, showing renewed buying pressure post-breakout. The measured move from the wedge projects a potential target near 0.30 USDT (+130% from the breakout zone). Price action remains constructive, with breakout momentum suggesting potential continuation if support holds. Key levels: Breakout zone: ~0.1487 USDT Projected targets: • TP1: 0.2000 USDT • TP2: 0.2500 USDT • TP3: 0.3000 USDT Invalidation: Close back below 0.1100 USDT Pattern breakout confirmed – watching for bullish continuation toward upper resistance.

Alpha-GoldFX
AIUSDT Forming Bullish Pennant
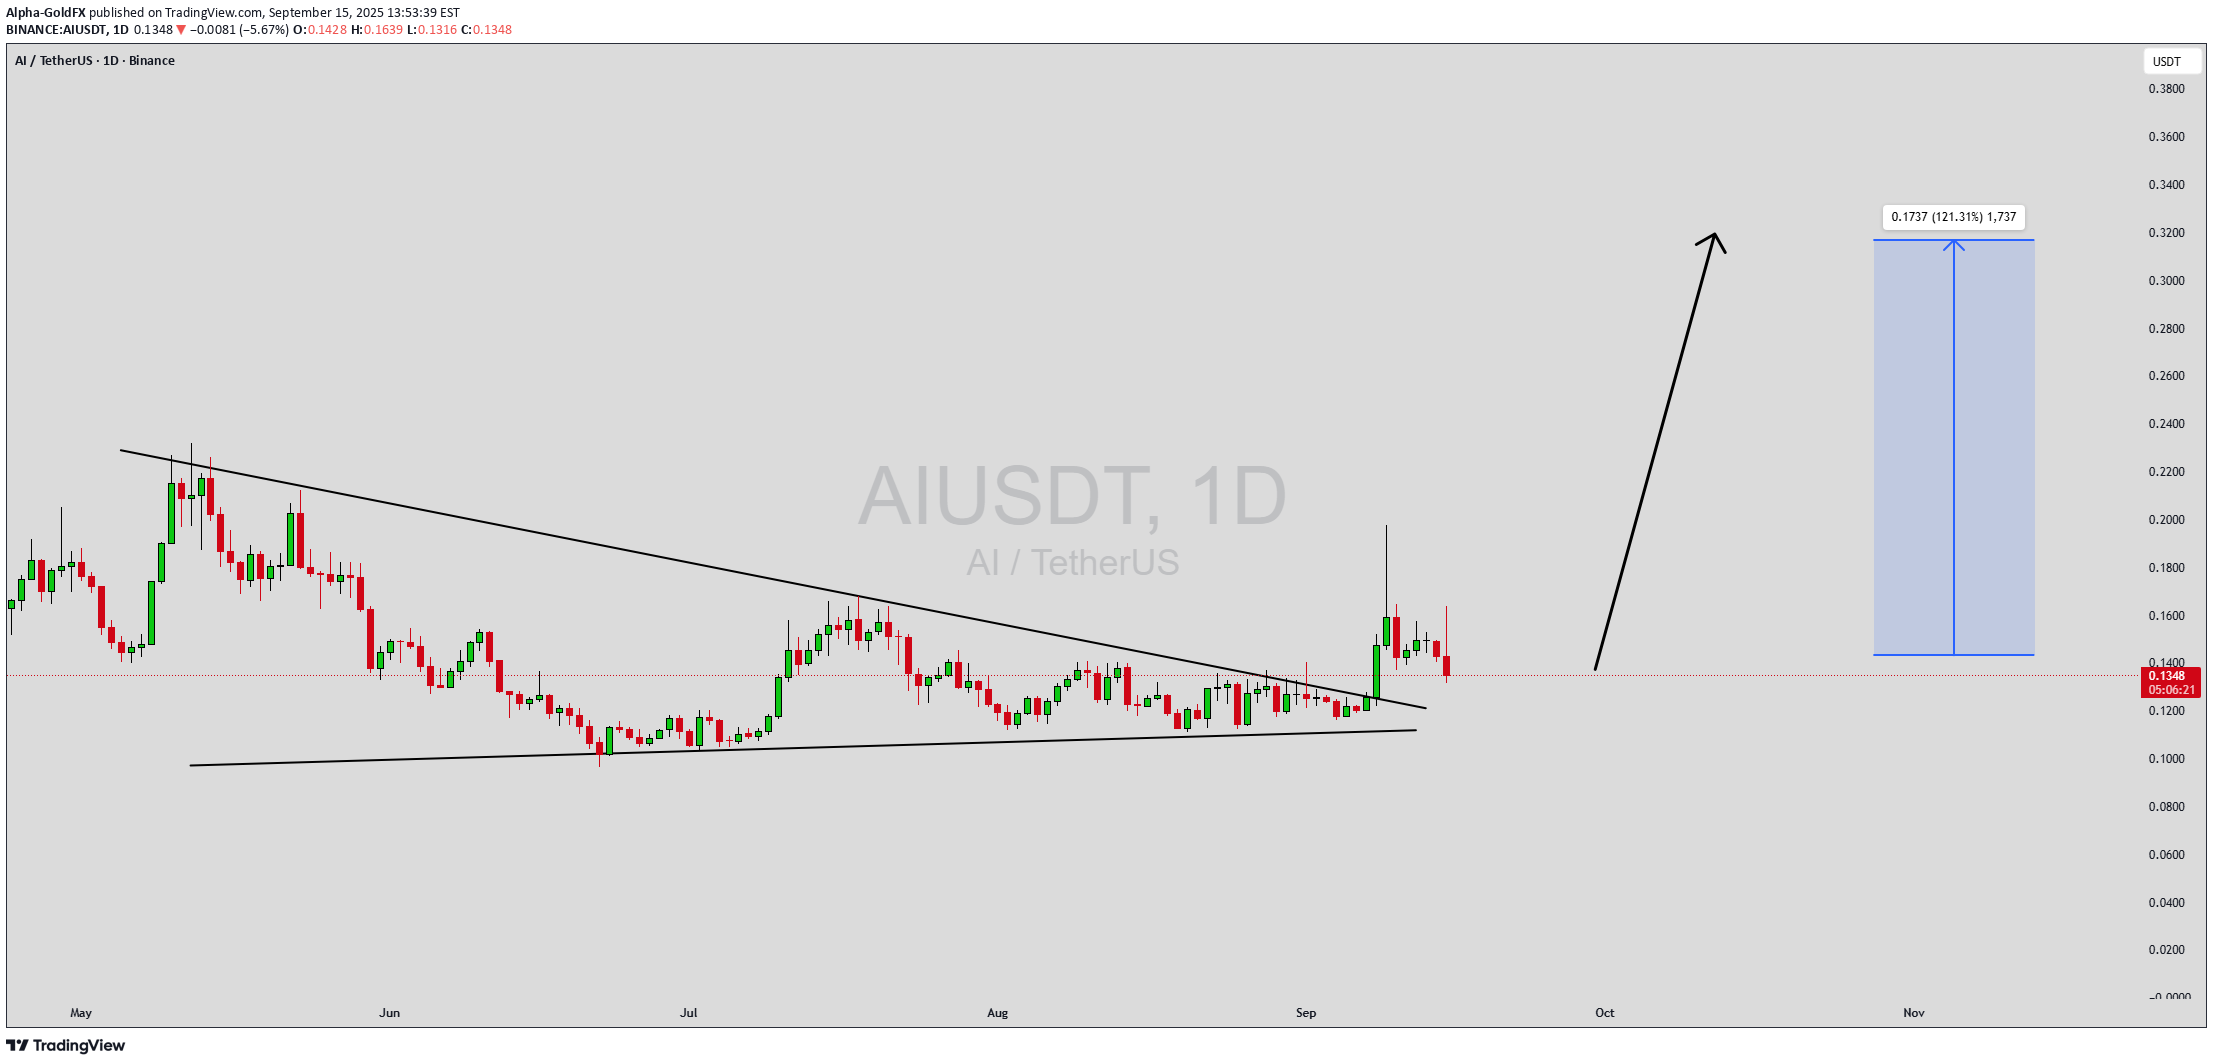
AIUSDT is currently forming a bullish pennant pattern, a continuation setup that typically signals the market is preparing for another strong upward move after an initial rally. This consolidation phase shows that buyers are holding control, with price coiling into a tighter range before a potential breakout. With steady volume supporting the pattern, the setup indicates that a significant bullish move may be imminent once resistance levels are cleared. The projected gain of 90% to 100%+ reflects the strong momentum behind this formation. Bullish pennants often lead to sharp rallies, as traders who have been waiting on the sidelines jump in once the breakout is confirmed. The energy built up during consolidation usually results in an explosive move, giving both short-term and long-term investors a favorable opportunity. Investor interest in AIUSDT has been growing, with market participants recognizing the potential upside of this project. As accumulation continues, the technical outlook strengthens, and many traders are anticipating a breakout that could open the doors to a new bullish leg in the market. Watching volume spikes and breakout candles will be crucial for catching the next big move. ✅ Show your support by hitting the like button and ✅ Leaving a comment below! (What is You opinion about this Coin) Your feedback and engagement keep me inspired to share more insightful market analysis with you!

AIUSD Gann Analizi
The goals have been found with the gann analysis method. The price may not return from the targets. The price and time have tolerance.
Disclaimer
Any content and materials included in Sahmeto's website and official communication channels are a compilation of personal opinions and analyses and are not binding. They do not constitute any recommendation for buying, selling, entering or exiting the stock market and cryptocurrency market. Also, all news and analyses included in the website and channels are merely republished information from official and unofficial domestic and foreign sources, and it is obvious that users of the said content are responsible for following up and ensuring the authenticity and accuracy of the materials. Therefore, while disclaiming responsibility, it is declared that the responsibility for any decision-making, action, and potential profit and loss in the capital market and cryptocurrency market lies with the trader.