
A
Vaulta
| تریدر | نوع سیگنال | حد سود/ضرر | زمان انتشار | مشاهده پیام |
|---|---|---|---|---|
No results found. | ||||
Price Chart of Vaulta
سود 3 Months :
سیگنالهای Vaulta
Filter
Sort messages by
Trader Type
Time Frame

readCrypto
رمز موفقیت در ترید: آیا قیمت به حمایت ۰.۲۹۸۳ میرسد و صعود میکند؟
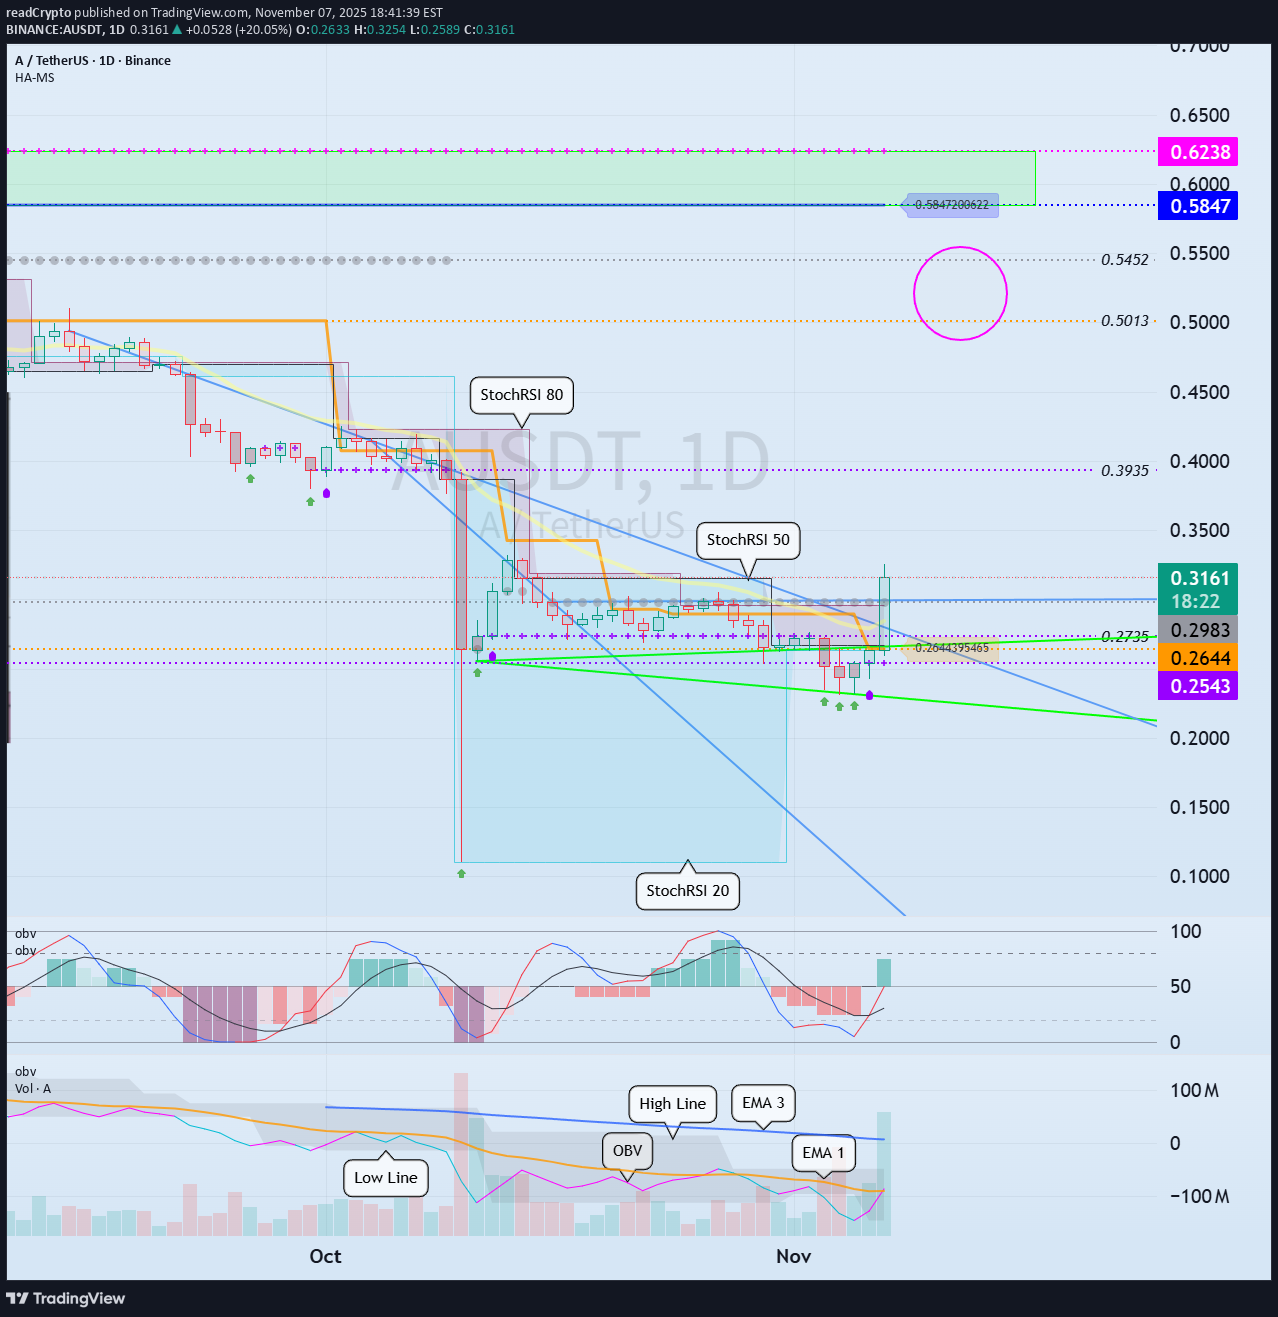
Hello, fellow traders! Follow us to get the latest information quickly. Have a great day! ------------------------------------- (AUSDT 1D chart) The StochRSI indicator was added shortly after the chart was created. The key is whether it can find support around 0.2644-0.2983 and rise to around 0.5847. - To sustain the uptrend, the price must remain above the StochRSI 80 level. Therefore, whether support is found around 0.2983 is crucial. The basic trading strategy is to buy in the DOM(-60) ~ HA-Low range and sell in the HA-High ~ DOM(60) range. However, if the price rises in the HA-High ~ DOM(60) range, a stepwise upward trend is likely, while a decline in the DOM(-60) ~ HA-Low range is likely to lead to a stepwise downward trend. Therefore, a split trading strategy is recommended. The end of a stepwise downward trend is an uptrend, and the end of a stepwise upward trend is a downtrend. Therefore, when the price is near the HA-Low or HA-High indicators, it's time to focus on finding a trading opportunity. - To sustain an uptrend after breaking above a key point or range, 1. The StochRSI indicator must be trending upward. If possible, it should not be overbought. 2. The TC (Trend Check) indicator must be trending upward. If possible, it should remain above the zero level. 3. The On-By-Value (OBV) indicator must be trending upward. If possible, it should remain above the High Line. If the above conditions are met, the uptrend is more likely to continue. - Thank you for reading to the end. I wish you successful trading. --------------------------------------------------

crptfxtrader
AUSDT bulish
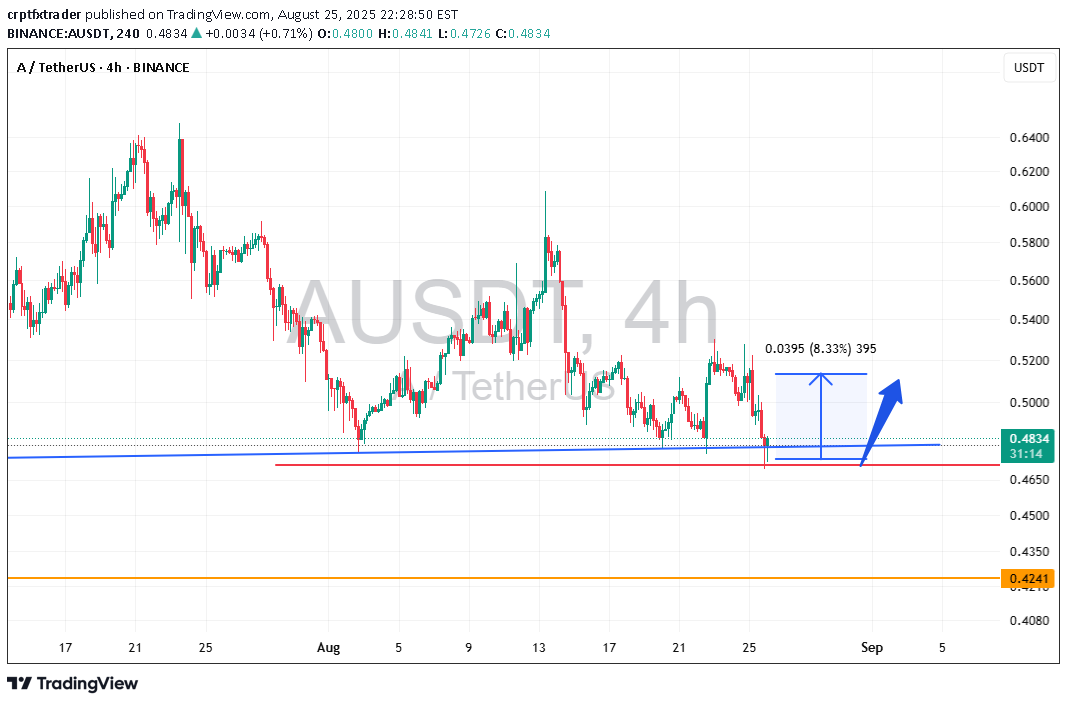
This AUSDT currency has reached the oversold area and should experience a growth of at least 8%. In this strategy, I buy spot and wait for the target. The win rate of this strategy is above 80%. If the next stage drops further, I will enter with 2 times the volume, which happens in one out of every 8 transactions. Capital management is the main pillar of trading.

Analizci_

Disclaimer
Any content and materials included in Sahmeto's website and official communication channels are a compilation of personal opinions and analyses and are not binding. They do not constitute any recommendation for buying, selling, entering or exiting the stock market and cryptocurrency market. Also, all news and analyses included in the website and channels are merely republished information from official and unofficial domestic and foreign sources, and it is obvious that users of the said content are responsible for following up and ensuring the authenticity and accuracy of the materials. Therefore, while disclaiming responsibility, it is declared that the responsibility for any decision-making, action, and potential profit and loss in the capital market and cryptocurrency market lies with the trader.