
ROSE
آسیس نتورک
| تریدر | نوع سیگنال | حد سود/ضرر | زمان انتشار | مشاهده پیام |
|---|---|---|---|---|
نتیجه ای یافت نشد. | ||||
نمودار قیمت آسیس نتورک
سود ۳ ماهه :
سیگنالهای آسیس نتورک
فیلتر
مرتب سازی پیام براساس
نوع پیام
نوع تریدر
فیلتر زمان

Cryptojobs
ROSE - BULLISH OUTLOOK STILL ONGOING
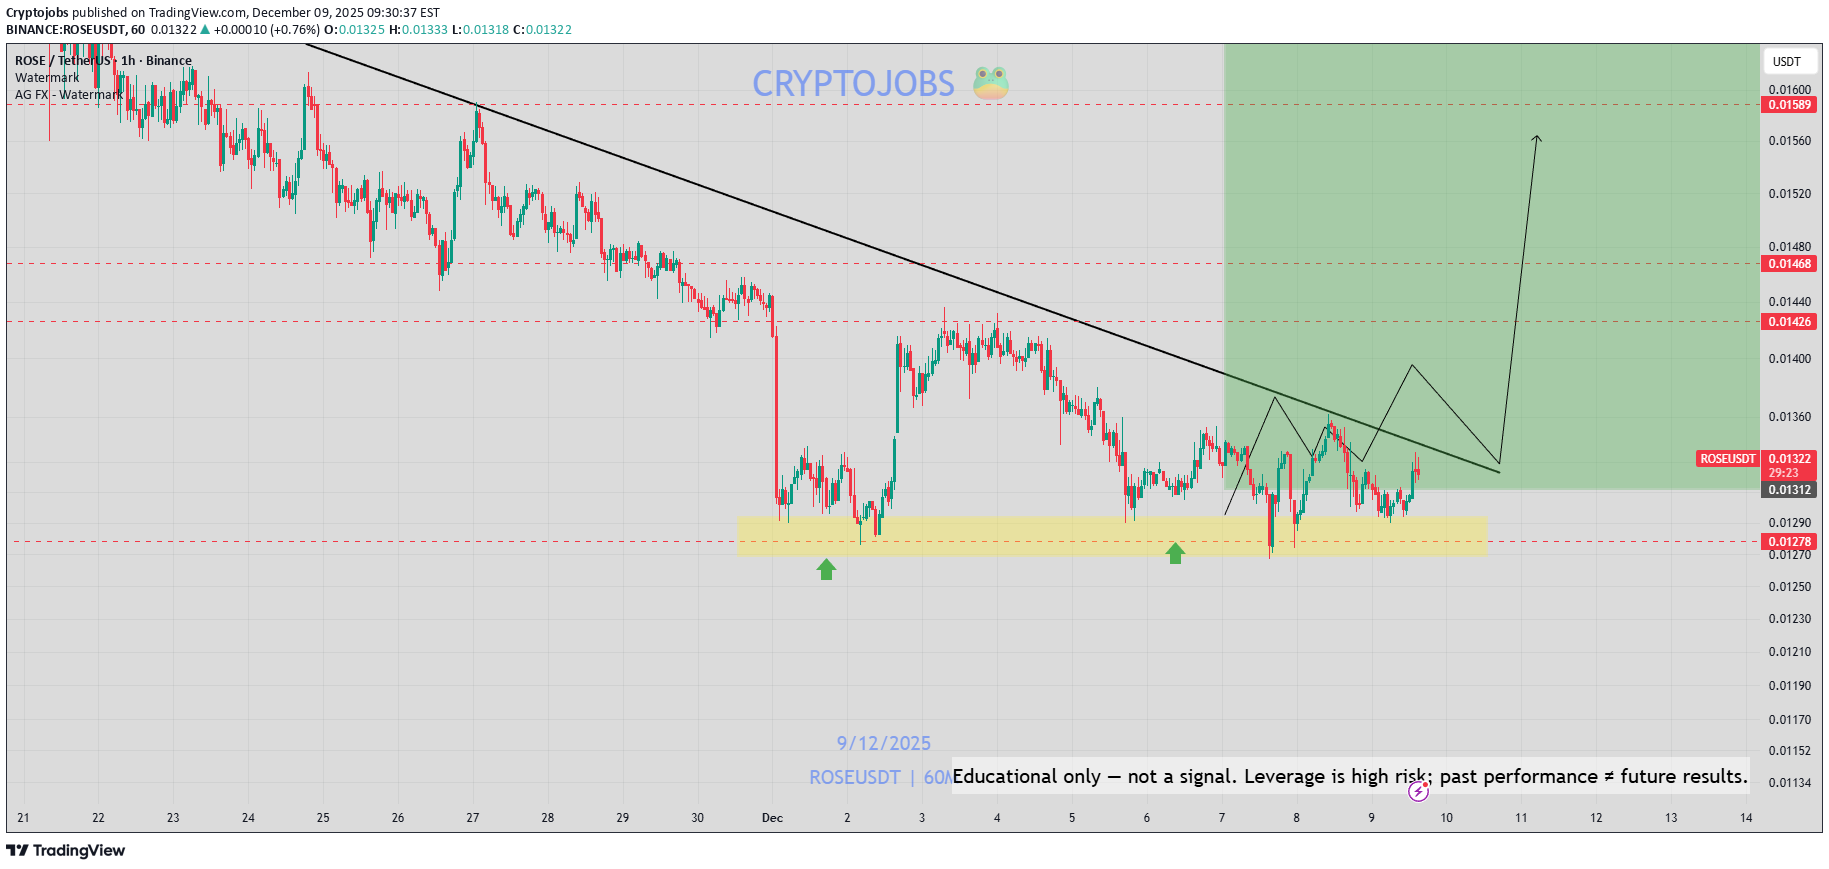
همان دیدگاه برای من در رز صعودی بالای ناحیه زرد؛ 📈 شکست ممکن است رخ دهد soon!

WaveRiders2
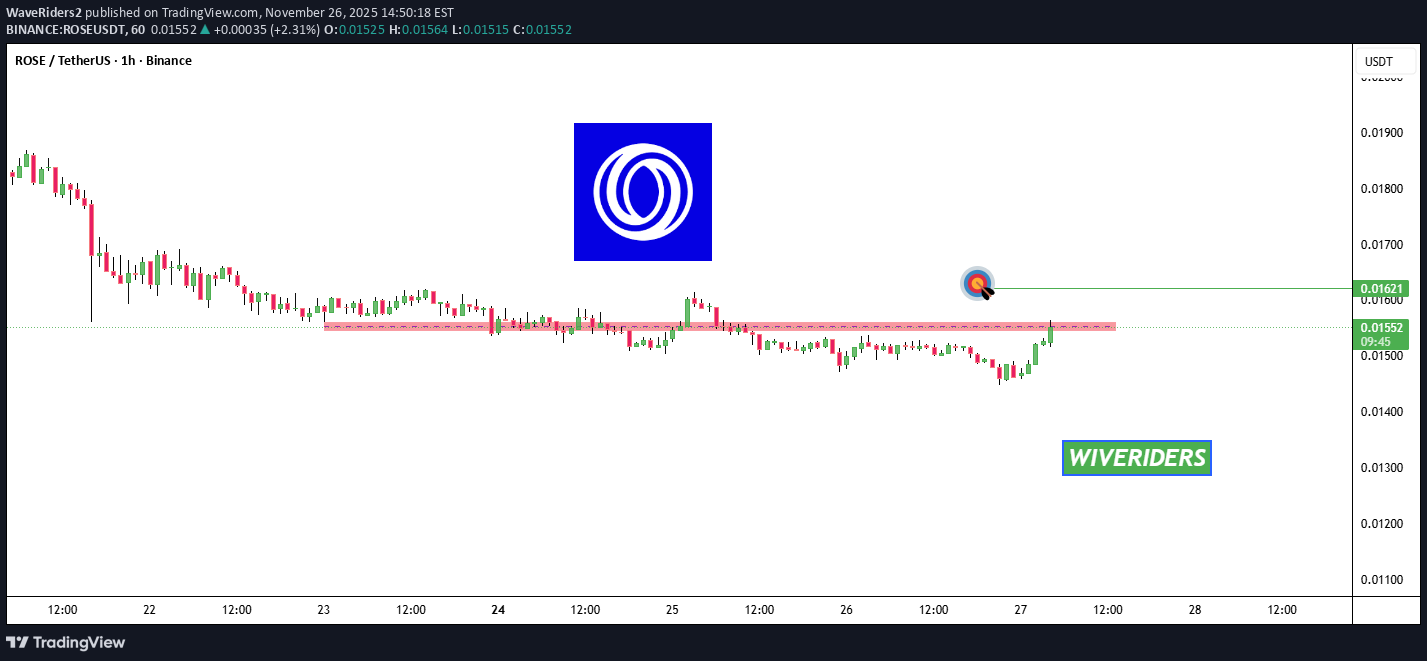
بررسی فوری ارز ROSE: آیا قیمت به زودی مقاومت قرمز را میشکند؟ (هدف بعدی کجاست؟)

DragonCaoB
سیگنال خرید قوی ROSE: شکست روند نزولی و آماده صعود به قله قبلی!
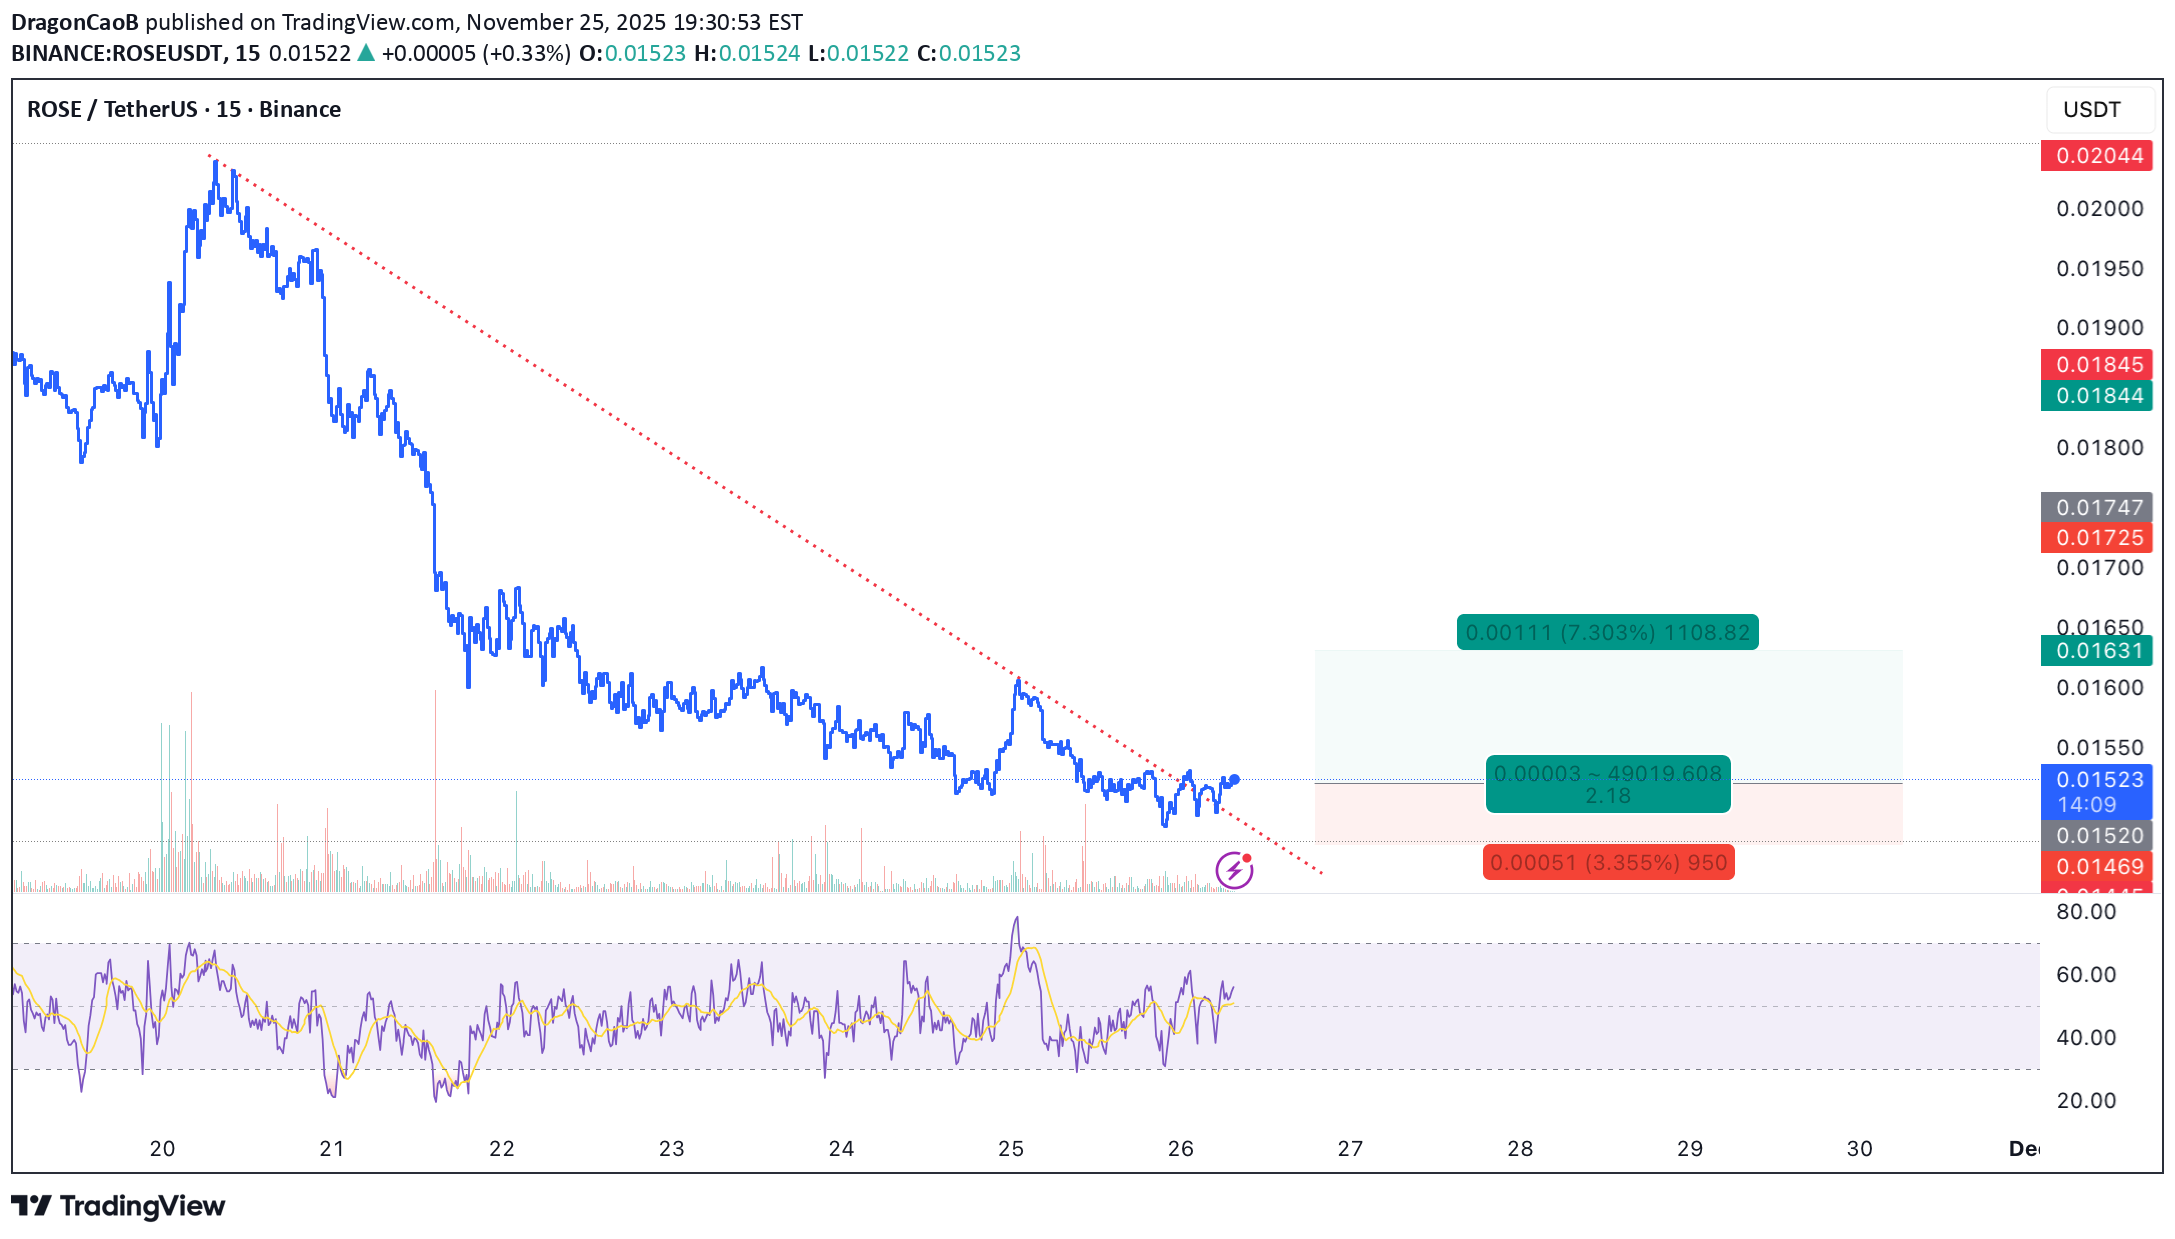
🐂 لانگ (خرید) کوتاهمدت – ROSE ROSE خط روند نزولی کوتاهمدت خود را شکسته و اکنون بالاتر از یک منطقه حمایت قوی چندبازه زمانی (Multi-timeframe) در حال تثبیت است. RSI در حال صعود است که نشاندهنده بهبود شتاب (مومنتوم) میباشد. با توجه به تغییر ساختار به صعودی (بولیش) و مقاومت پیشرو، احتمالاً قیمت بالاترین سقف اخیر خود را مجدداً تست کرد. سیگنالهای کلیدی: خط روند نزولی کوتاهمدت به وضوح شکسته شده است. قیمت با قدرت بالاتر از حمایت قوی حفظ شده است. افزایش RSI ← شروع بازیابی شتاب (مومنتوم) 🎯 حد سود (TP): 0.01631 🛡️ حد ضرر (SL): 0.01469 📊 نسبت ریسک به ریوارد (RR): ۱ : ۲.۱۸ این یک سناریوی لانگ (خرید) شفاف است که هدف آن ادامه حرکت به سمت سقف قبلی میباشد.

MuratKrkn
پیشبینی هیجانانگیز قیمت ROSE تا سال 2026: آیا این ارز صعود خواهد کرد؟
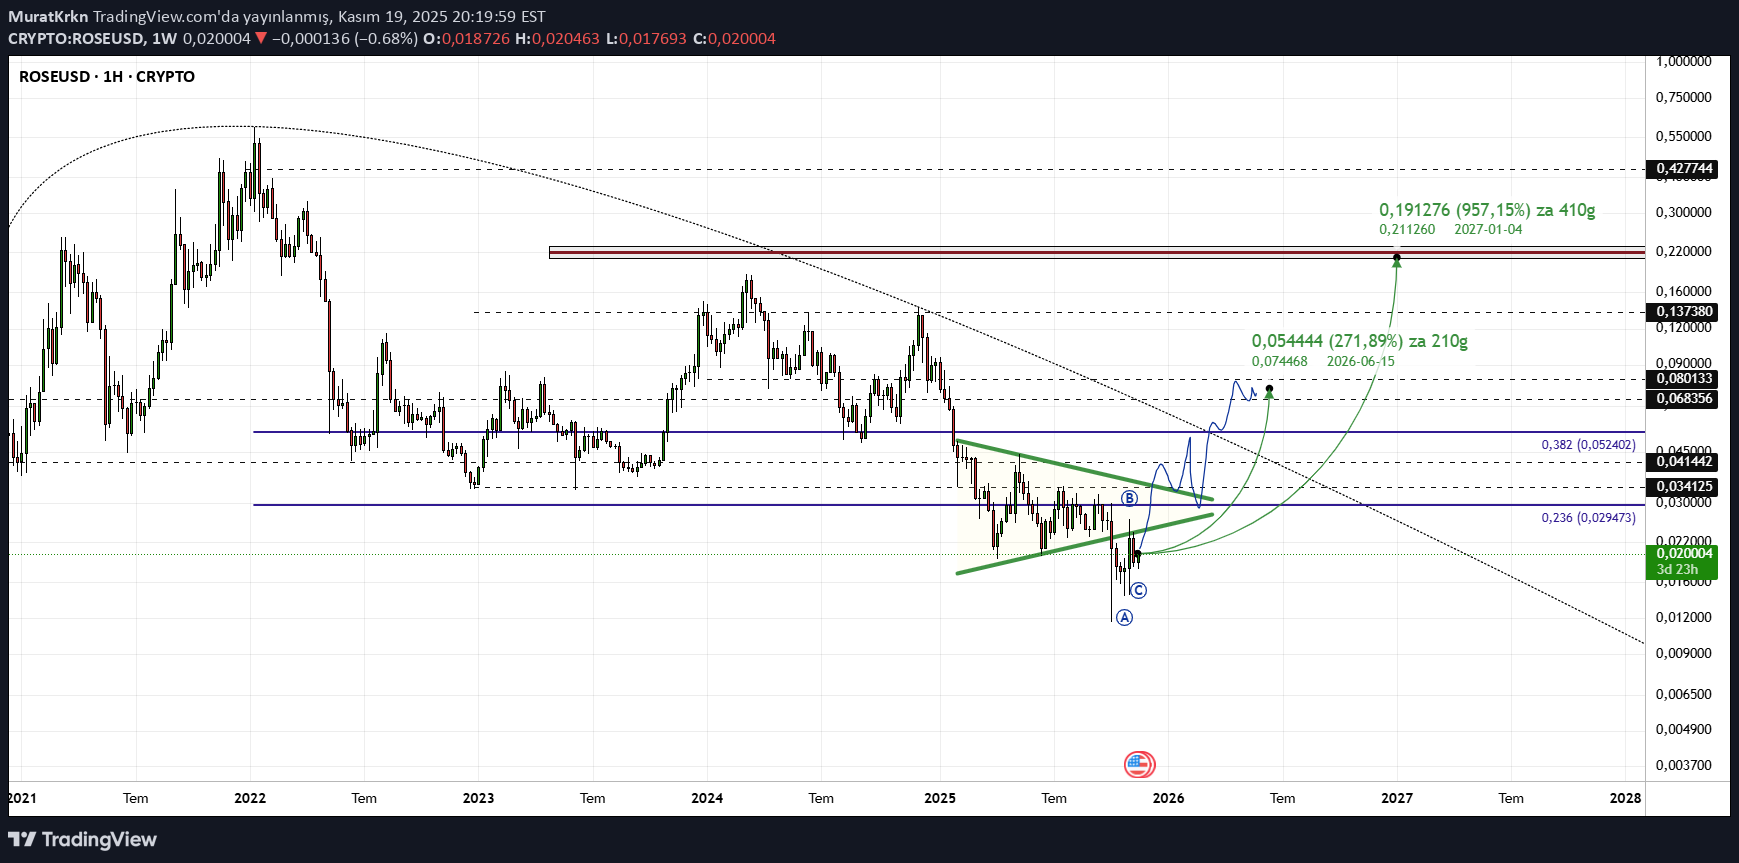
هدف من برای Rose در سال ۲۰۲۶. در نمودار، سطوحی را مشخص کردم که انتظار دارم رالی صعودی که از ماه دسامبر آغاز میشود، به آنها برسد. حرکات Rose بسیار مثبت است. سطحی که باید از آن فراتر رود، نقطه شروع آن در داخل مثلث سبز مشخص میشود. از آنجا که این یک نمودار هفتگی است، بهمرور زمان و بر اساس جریان بازار، بهروزرسانیهایی را ارائه کرد.
Cryptojobs
پیشبینی صعودی هیجانانگیز ROSE: آیا کف قیمت مشخص شد؟
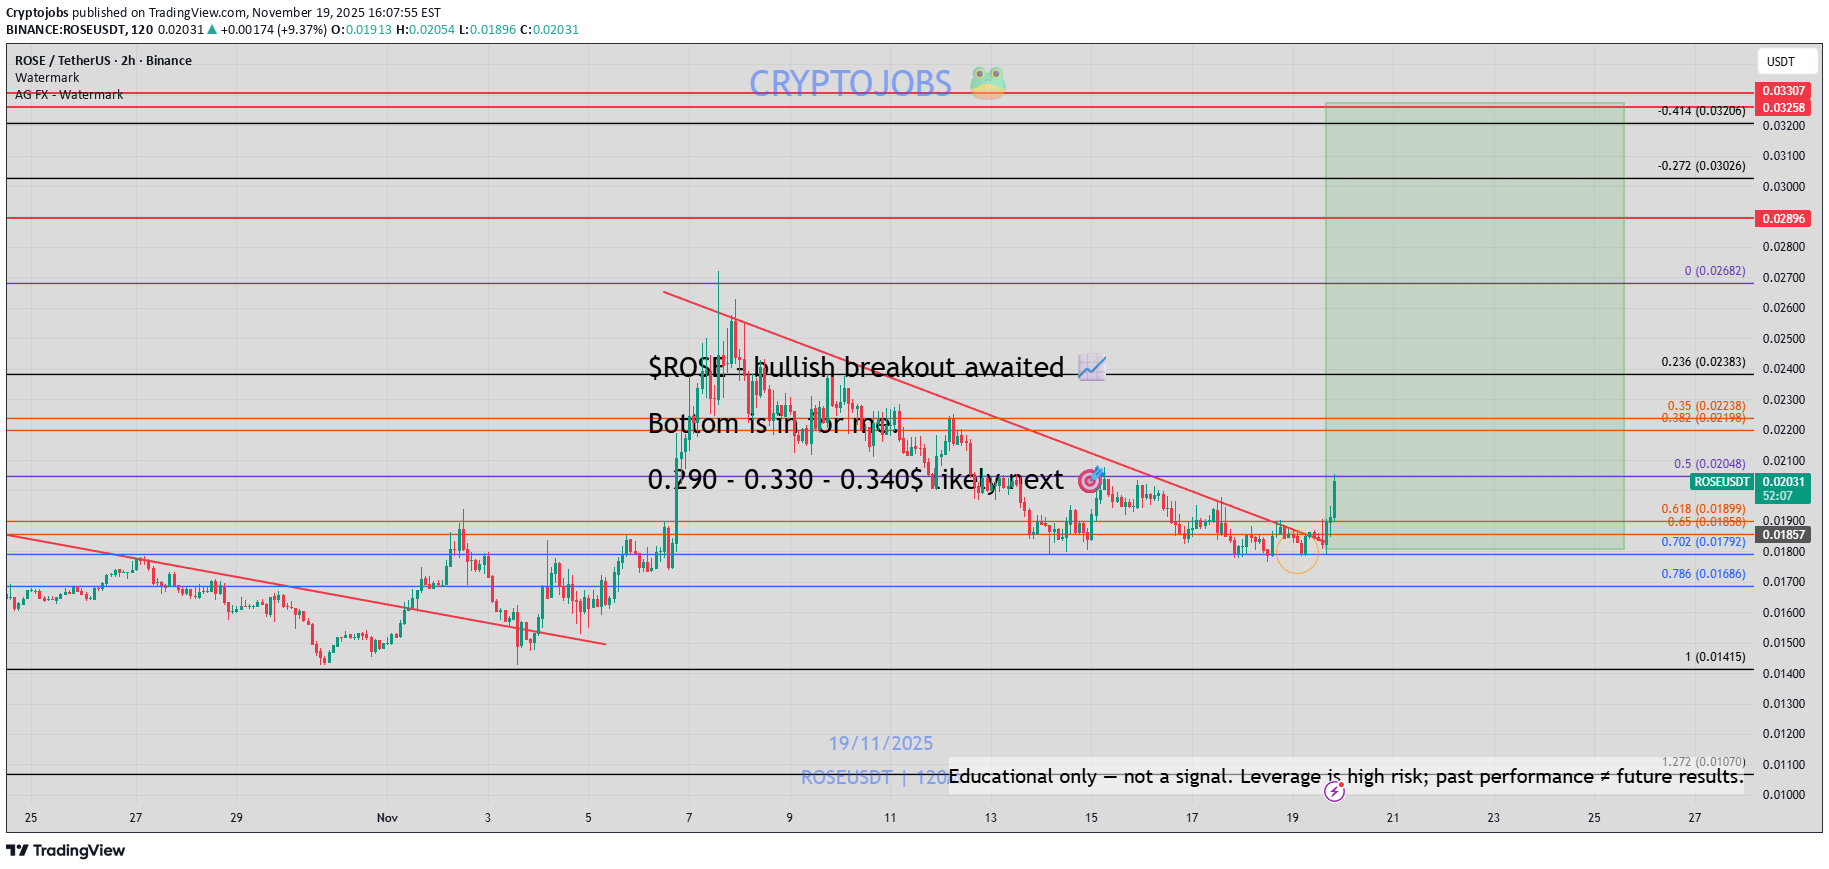
ROSE - در انتظار یک شکست صعودی هستیم 📈 از نظر من، کف قیمت تثبیت شده است. احتمالاً اهداف بعدی: 0.290 - 0.330 - 0.340 دلار 🎯

iMoneyTeam
تحلیل قوی خرید (Long): منتظر واکنش قیمتی در ناحیه تقاضا باشید!
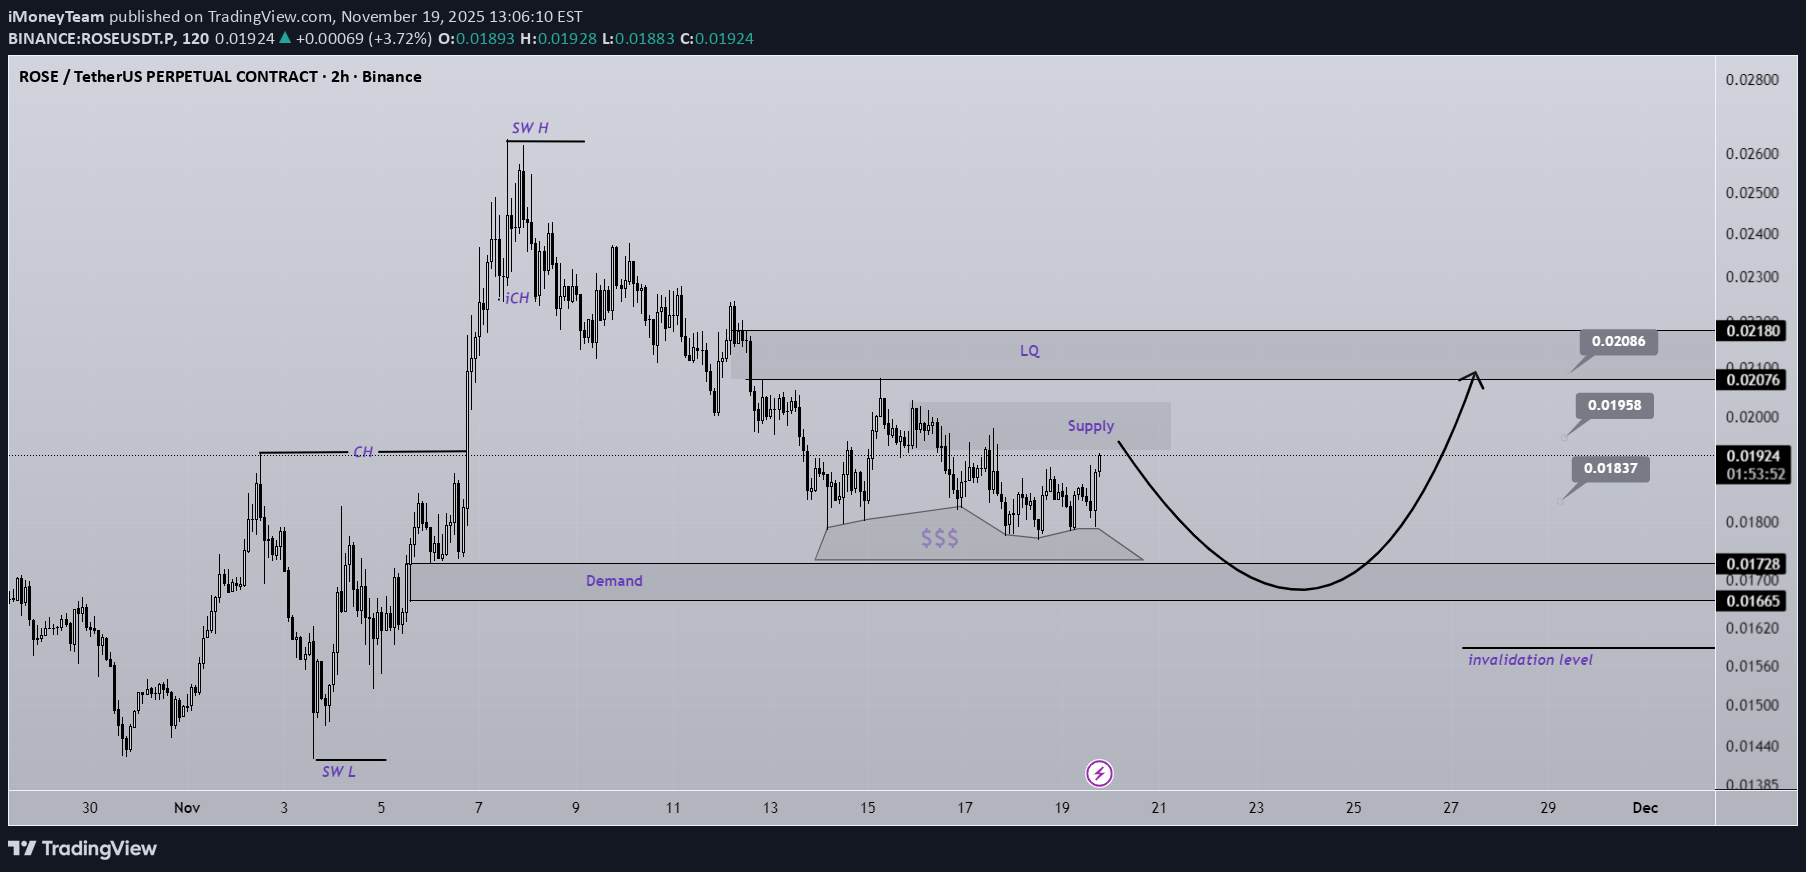
این یک سناریوی خرید (لانگ) است و نباید به عنوان سناریوی فروش (شورت) استفاده شود. ما یک ناحیه حمایت مستحکم روی نمودار داریم که نقدینگی قابل توجهی در اطراف آن قرار دارد. انتظار میرود قیمت پس از رسیدن به ناحیه تقاضا، واکنش قوی (ریجکشن) نشان دهد. اهداف روی نمودار مشخص شدهاند. بسته شدن یک کندل ۴ ساعته زیر سطح ابطال (اینولیدیشن)، این تحلیل را باطل کرد. بدون رعایت مدیریت سرمایه و تعیین حد ضرر وارد پوزیشن نشوید. اگر سوالی دارید، کامنت بگذارید. با تشکر.
Cryptojobs
تحلیل جدید قیمت ROSE: آیا روند نزولی ادامه دارد یا الگوی فنجان و دسته شکل میگیرد؟
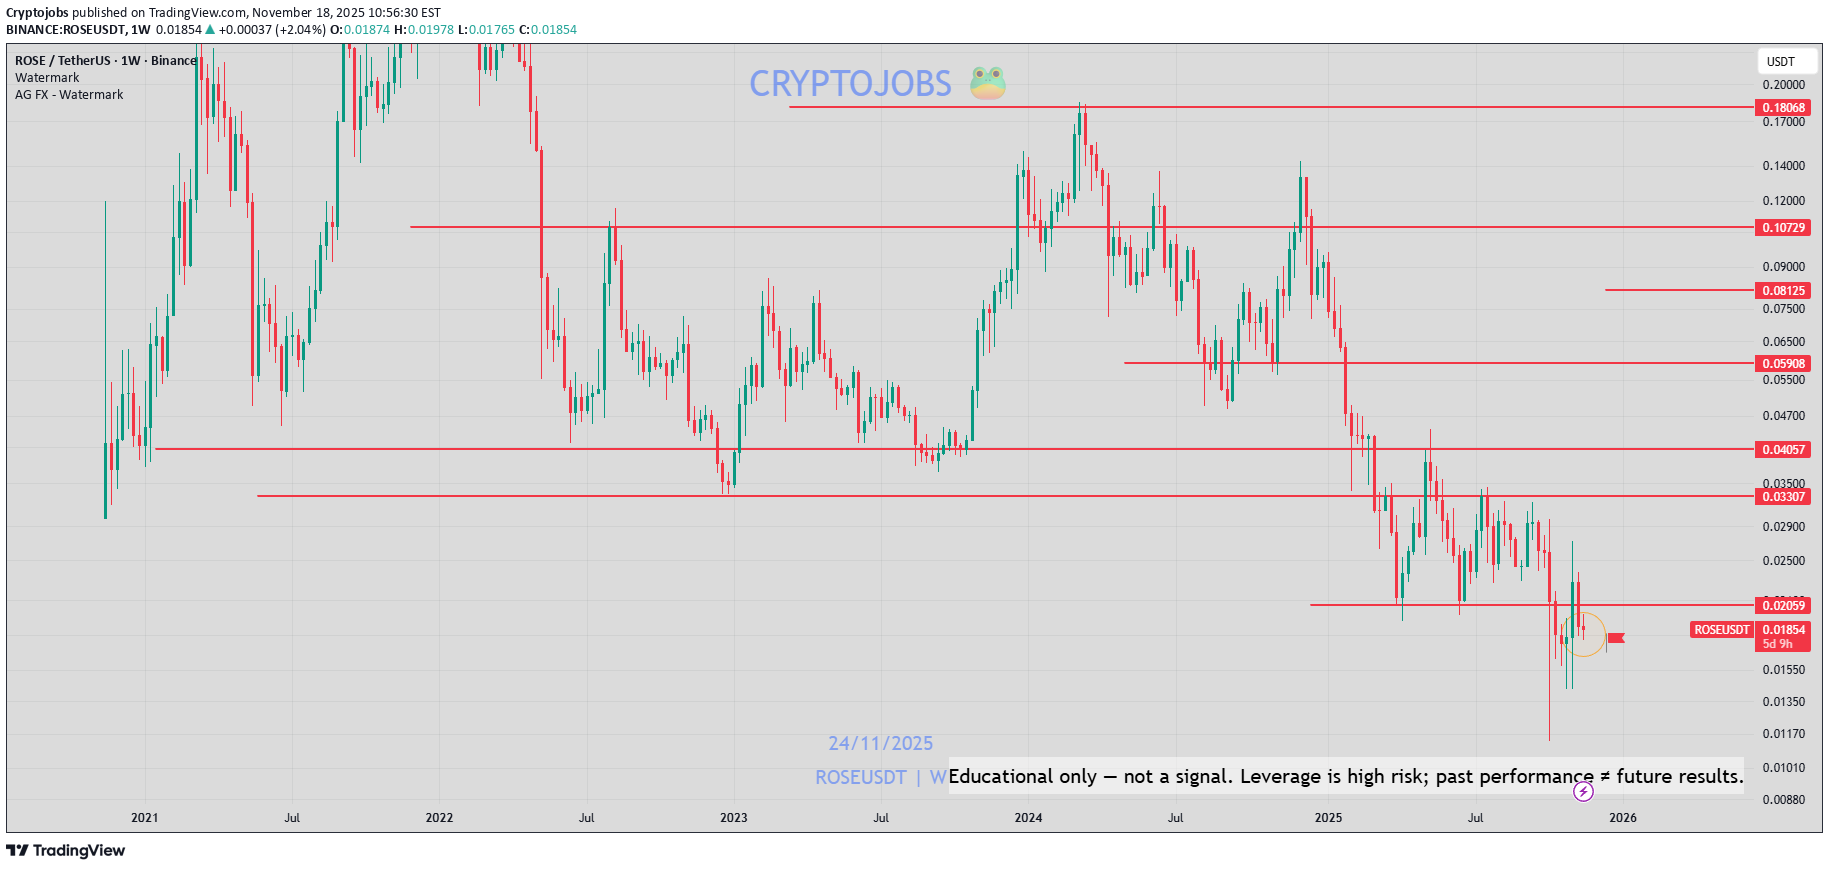
ROSE - بهروزرسانی: روند نزولی همچنان ادامه دارد 📉. کندل هفتگی = دوجی (DOJI) = خنثی. در تایم روزانه خنثی است، اما همچنان تمایل به نزولی بودن وجود دارد. مقاومتهای زیادی وجود دارند که باید دوباره شکسته شوند: 0.1875 - 0.2070 - 0.1980 - 0.2180 ... 📉بر اساس ساختار نمودار ساعتی (H1): حمایتهای 0.160 تا 0.1680 دلار ممکن است در مرحله بعدی لمس شوند. 🚀از طرف دیگر، ممکن است در حال تشکیل الگوی «کپ و هندل» (Cup & Handle) باشد (یک آرایش صعودی). 🔴 حمایت هفتگی که باید حفظ شود: 0.1740 دلار. اگر #BTC در 88,000 دلار به کف رسیده باشد، در آن صورت احتمالاً ROSE نیز به کف رسید (نمای 4 ساعته H4 --> نمودار دوم). نظر من: کوتاهمدت ==> همچنان تمایل به نزولی بودن در زیر سطوح مقاومت، اما احتمال وجود یک ساختار صعودی در بلندمدت.

AndrewsMarket-Mastery
تحلیل تکنیکال ROSE/USDT: آیا الگوی گُوِه نزولی نویدبخش انفجار صعودی است؟
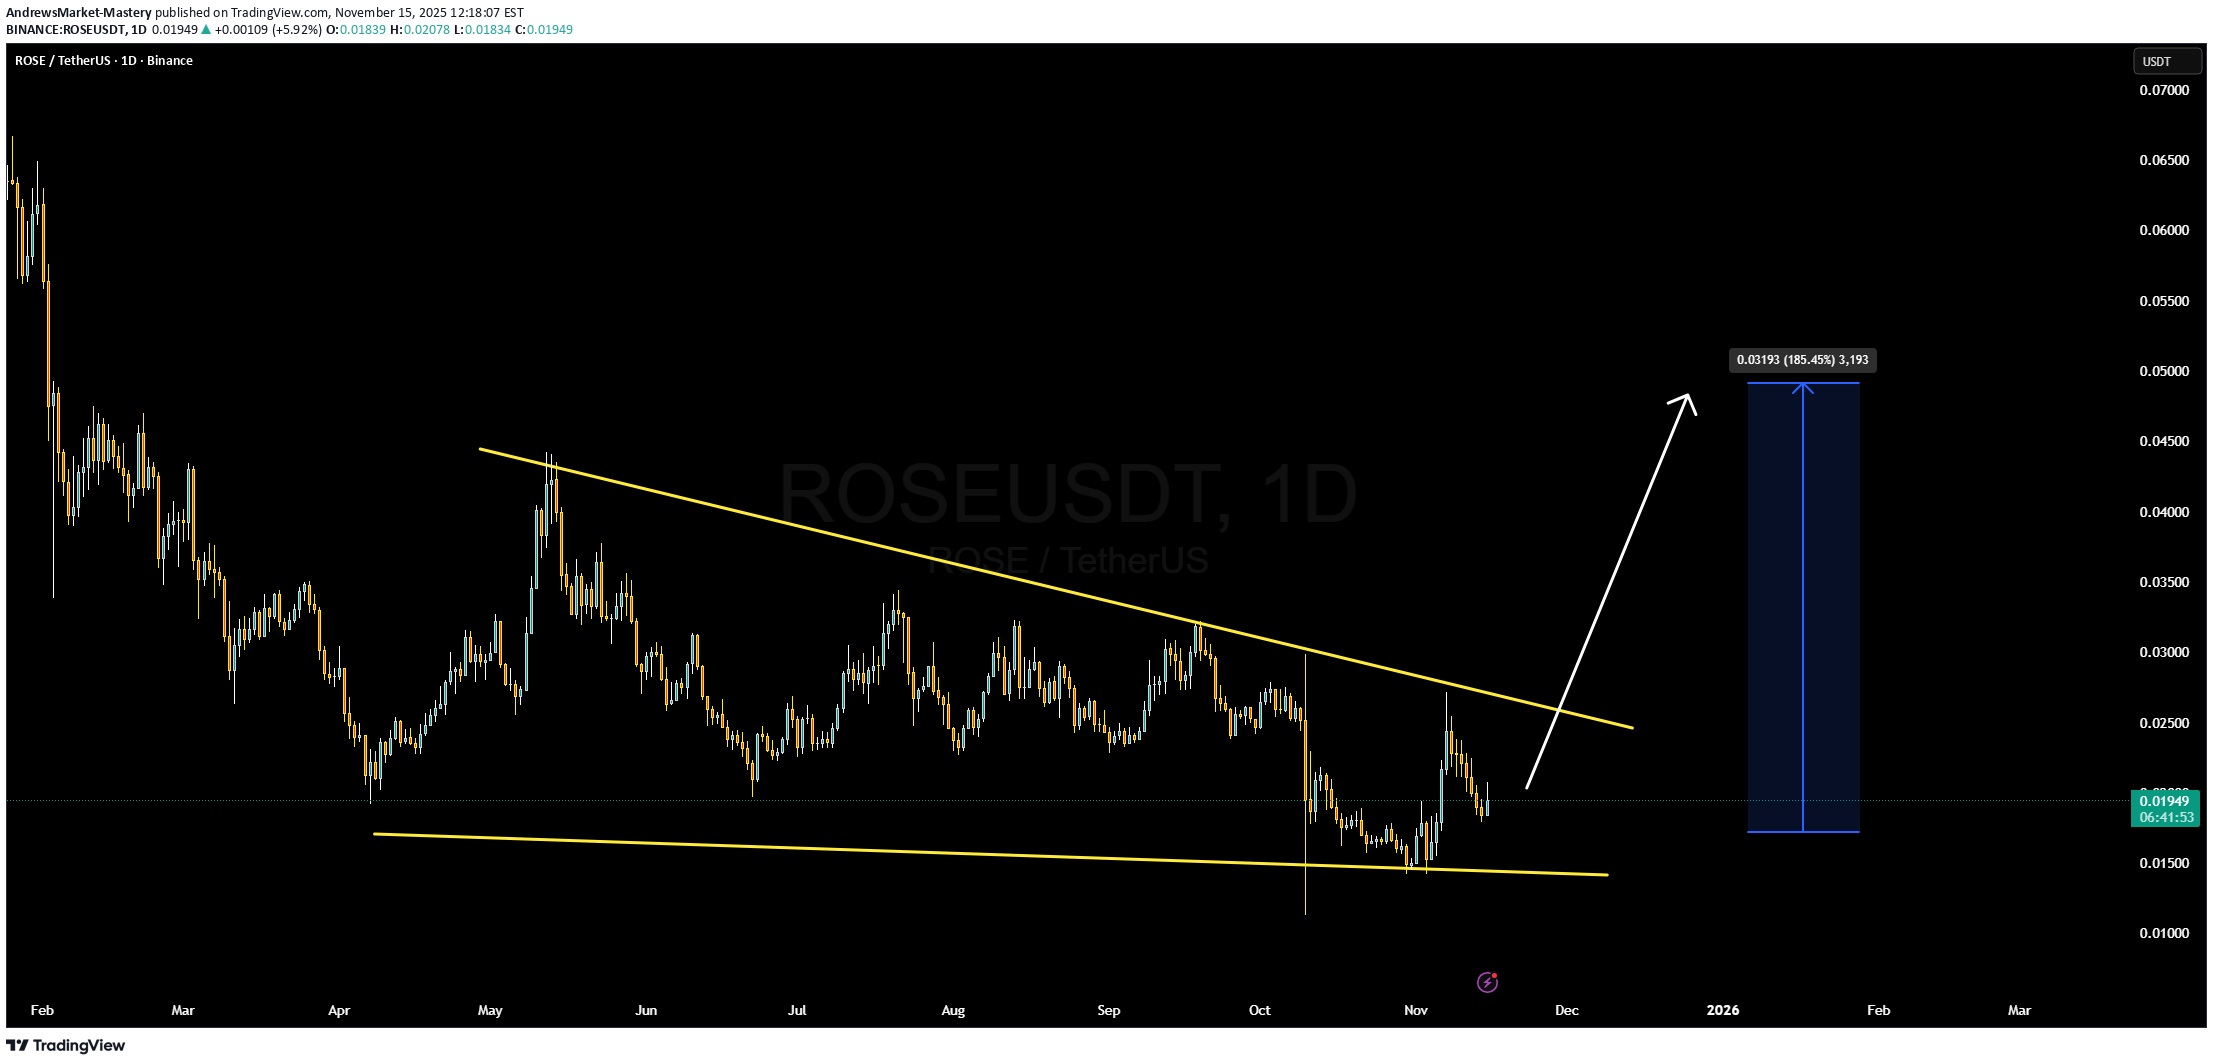
جفت ارز ROSE/USDT در حال حاضر یک آرایش بسیار امیدوارکننده نشان میدهد، بهطوری که رفتار قیمت در حال فشرده شدن در چیزی است که به نظر میرسد یک «کنج نزولی» (Falling Wedge) باشد — که الگوی کلاسیک بازگشت صعودی است. باریک شدن این محدوده نشان میدهد که فروشندگان در حال از دست دادن اطمینان هستند و خریداران به تدریج وارد عمل میشوند، به ویژه با شروع افزایش حجم معاملات. اگر ROSE با قاطعیت از خط روند بالایی عبور کند، میتوانیم شاهد تغییر قابل توجهی در تکانه (مومنتوم) باشیم. از منظر بنیادی، ROSE توکن بومی شبکه Oasis است، یک بلاکچین لایه اول (Layer-1) مقیاسپذیر و مبتنی بر حفظ حریم خصوصی که برای محاسبات محرمانه (Confidential Compute) طراحی شده است. ROSE نیروی محرکه کارمزدهای تراکنش، استیکینگ و واگذاری (Delegation) هم در لایه اجماع (Consensus) و هم در محیطهای پاراتایم (ParaTime) است. سقف عرضه ۱۰ میلیارد توکنی آن و تخصیص ویژهای که برای پاداشهای استیکینگ در نظر گرفته شده، بهگونهای طراحی شدهاند که مشارکت بلندمدت در شبکه را با کمیابی توکن همسو کنند. استیکینگ ROSE بخش کلیدی ارزش پیشنهادی آن است — دارندگان میتوانند توکنها را به ولیدیتورها واگذار کنند، به تأمین امنیت شبکه کمک کنند و در ازای آن پاداش دریافت نمایند. برخی برآوردها حاکی از آن است که بازده استیکینگ میتواند بسته به مدت زمان نگهداری توکن، محدوده بسیار گستردهای داشته باشد. در همین حال، پاراتایم (ParaTime) آن از طریق محفظههای امن (Secure Enclaves)، از قراردادهای هوشمند خصوصی پشتیبانی میکند، که باعث میشود ROSE برای موارد استفاده وب ۳ (Web3) که به حریم خصوصی حساس هستند، کاربرد داشته باشد.

CryptoWithJames
تحلیل تکنیکال ارز ROSE: شکست قاطع از الگوی گُوِه نزولی و هدف سود خیرهکننده ۱۰۹٪!
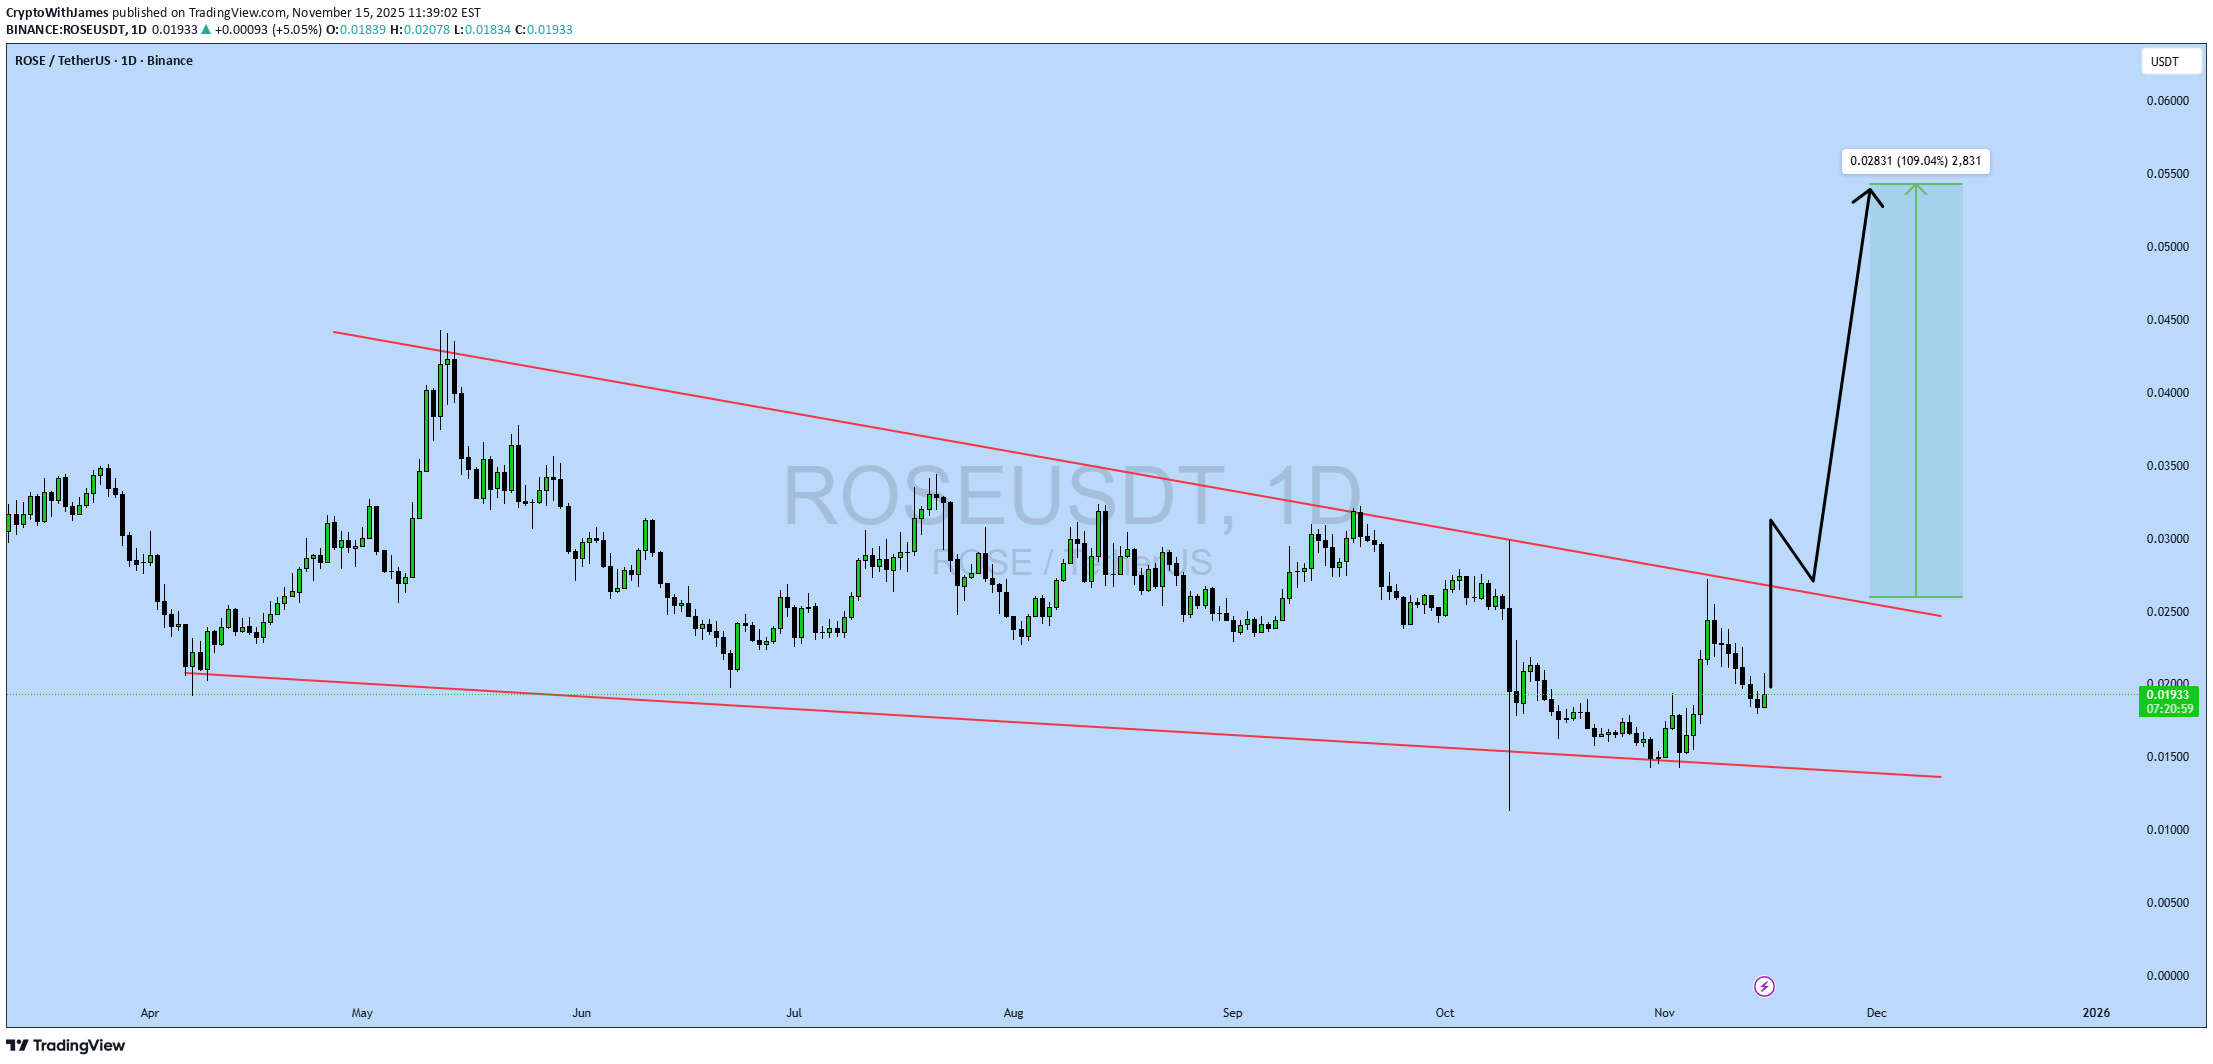
#ROSE بهروزرسانی آرایش تکنیکال ROSE الگو: الگوی کنج نزولی قیمت فعلی: ۰.۰۱۹ دلار قیمت هدف: ۰.۰۲۸ دلار درصد سود هدف: ۱۰۹.۰۴٪ تحلیل تکنیکال: ROSE در حال خروج (بریکاوت) از الگوی کنج نزولی در نمودار روزانه (1D) است؛ زیرا قیمت با شتاب صعودی رو به رشد، بالاتر از خط روند مقاومت نزولی فشار میآورد. افزایش شدید اخیر، علاقه قوی خریداران را نشان میدهد، و اگر قیمت بتواند در بالای ناحیه شکست (بریکاوت) حفظ شود، حرکت به سمت هدف ۰.۰۲۸ دلاری محتمل بود. چارچوب زمانی: روزانه (1D) نکته مدیریت ریسک: همیشه از مدیریت ریسک مناسب استفاده کنید.

Bithereum_io
تحلیل تکنیکال ROSE/USDT: فرصت خرید در کف الگوی مثلث نزولی و اهداف هیجانانگیز!
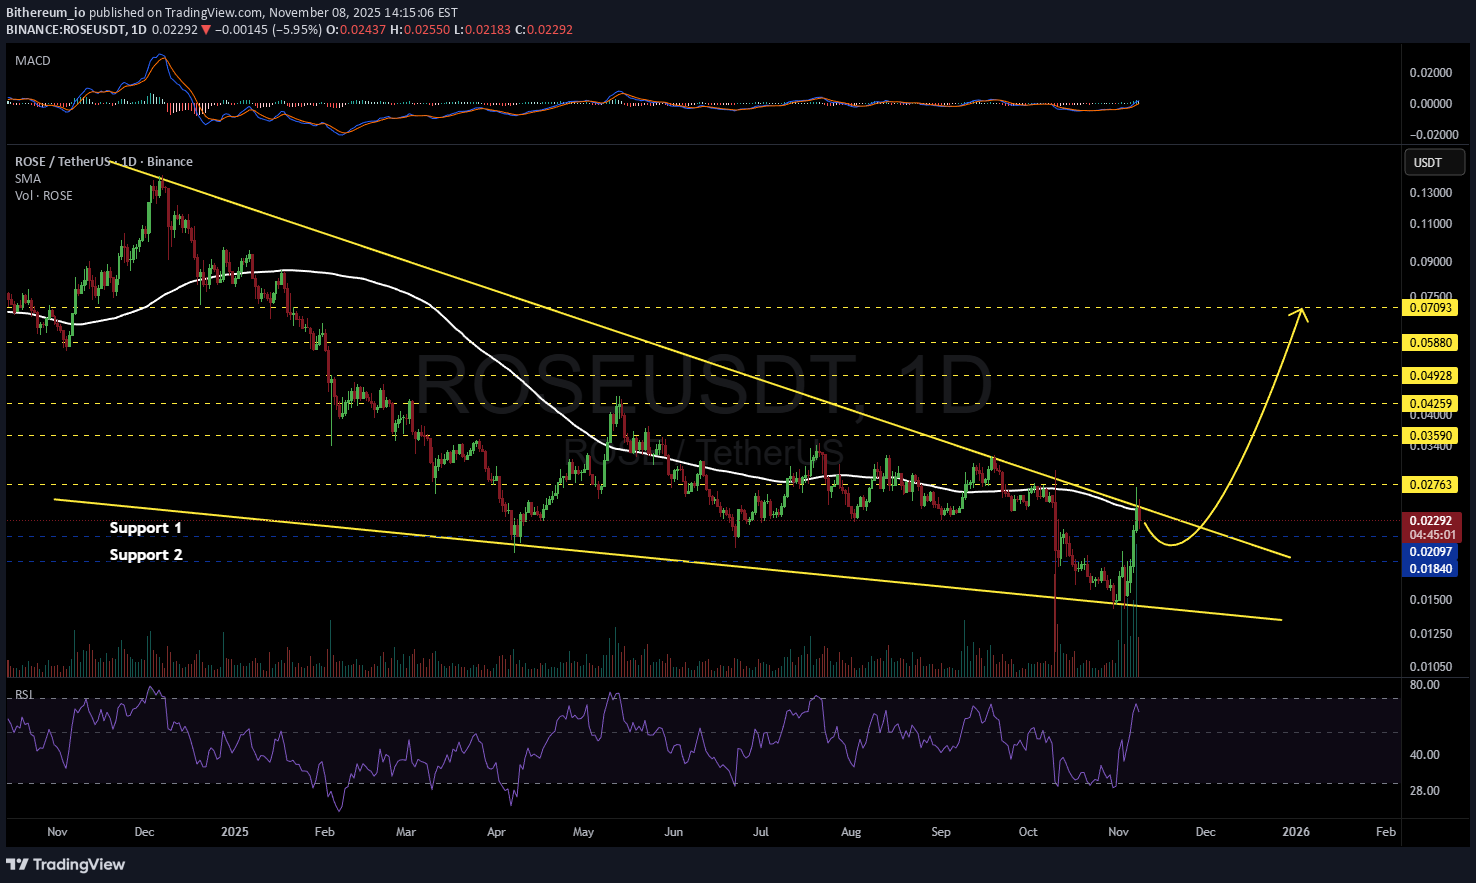
#ROSE در حال حاضر در نمودار روزانه در داخل الگوی گُوِه نزولی معامله میشود و اخیراً از مقاومت گُوِه و همچنین SMA100 روزانه رد شده است. انباشت موقعیت در حدود سطح فعلی و نزدیک به مناطق حمایتی زیر را در نظر بگیرید: 💰 $0.02097 💰 $0.01840 در صورت شکستن مقاومت الگو و SMA100 روزانه، اهداف صعودی بالقوه عبارتند از: 🎯 $0.02763 🎯 $0.03590 🎯 $0.04259 🎯 $0.04928 🎯 $0.05880 🎯 $0.07093 ⚠️ همیشه به یاد داشته باشید که از حد ضرر محکم استفاده کنید و مدیریت ریسک مناسب را رعایت نمایید.
سلب مسئولیت
هر محتوا و مطالب مندرج در سایت و کانالهای رسمی ارتباطی سهمتو، جمعبندی نظرات و تحلیلهای شخصی و غیر تعهد آور بوده و هیچگونه توصیهای مبنی بر خرید، فروش، ورود و یا خروج از بازارهای مالی نمی باشد. همچنین کلیه اخبار و تحلیلهای مندرج در سایت و کانالها، صرفا بازنشر اطلاعات از منابع رسمی و غیر رسمی داخلی و خارجی است و بدیهی است استفاده کنندگان محتوای مذکور، مسئول پیگیری و حصول اطمینان از اصالت و درستی مطالب هستند. از این رو ضمن سلب مسئولیت اعلام میدارد مسئولیت هرنوع تصمیم گیری و اقدام و سود و زیان احتمالی در بازار سرمایه و ارز دیجیتال، با شخص معامله گر است.