
readCrypto
@t_readCrypto

ما هو الشيء الذي ننصحك بشراءه من المواد الغذائية؟
سابق في الشراء
پیام های تریدر
مرشح
readCrypto
Next Volatility Period: Around December 23rd
مرحبا زملائی التجار! تابعنا للحصول على آخر التحدیثات بسرعة. أتمنى لک یوماً عظیماً! ------------------------------------- #بیتکوینUSDT لبدء اتجاه صعودی، یجب أن یرتفع السعر فوق مستوى مؤشر OBV المنخفض ویحافظ علیه. بالنظر إلى استراتیجیة التداول الأساسیة للشراء حول DOM(-60) ~ HA-Low والبیع حول HA-High ~ DOM(60)، فإن موضع السعر الحالی یمثل فرصة شراء. ومع ذلک، إذا انخفض السعر بین DOM(-60) وHA-Low، فمن المحتمل أن یکون هناک اتجاه هبوطی تدریجی، لذلک یجب علیک التفکیر فی خطة الاستجابة. إذا انخفض السعر إلى ما دون مؤشر DOM(-60)، فیجب علیک التحقق من الدعم حول مستوى 69000-73499.86. وذلک لأن المستوى 69000-73499.86 یمثل منطقة دعم ومقاومة مهمة للحفاظ على الاتجاه الصعودی من منظور طویل المدى. إذا انخفض السعر من نطاق 69,000-73,499.86، فمن المتوقع أن form اتجاه صعودی حول 42,000، وهو مستوى لم یسبق له مثیل مرة أخرى. - إذا ارتفع السعر فوق مستوى مؤشر OBV المنخفض واستمر فی اتجاهه التصاعدی، فیجب علینا التحقق من وجود اختراق صعودی بالقرب من المنطقة المحاطة بدائرة على الرسم البیانی. إذا فشل السعر فی الاختراق، فیجب أن نفکر فی خطة استجابة، لأن هذا قد یشیر إلى سوق هابطة کاملة. إذا استمر السعر فی الارتفاع فإن المستویات المستهدفة هی: - نسبة فیبوناتشی الیمنى 2.618 (133,889.92) - نسبة فیبوناتشی الیمنى 3 (151,018.77) ~ 3.14 (157,296.36) ومن المتوقع أن یعید تأسیس الاتجاه من خلال الارتفاع بالقرب من النطاق المذکور أعلاه. من المرجح أن یشهد سوق العملات سوقًا هابطًا major فی الأسبوع الذی یبدأ فی 26 ینایر 2026. - شکرا لک على القراءة. أتمنى لک التداول الناجح. -------------------------------------------------- - وهنا توضیح للصورة الکبیرة. (سوق صاعدة لمدة 3 سنوات، نمط سوق هابط لمدة عام واحد) سأشرح المزید من التفاصیل عندما یبدأ السوق الهابط. ------------------------------------------------------
readCrypto
رمزگشایی آینده ZECUSDT: آیا قیمت میتواند از 422.80 عبور کند؟
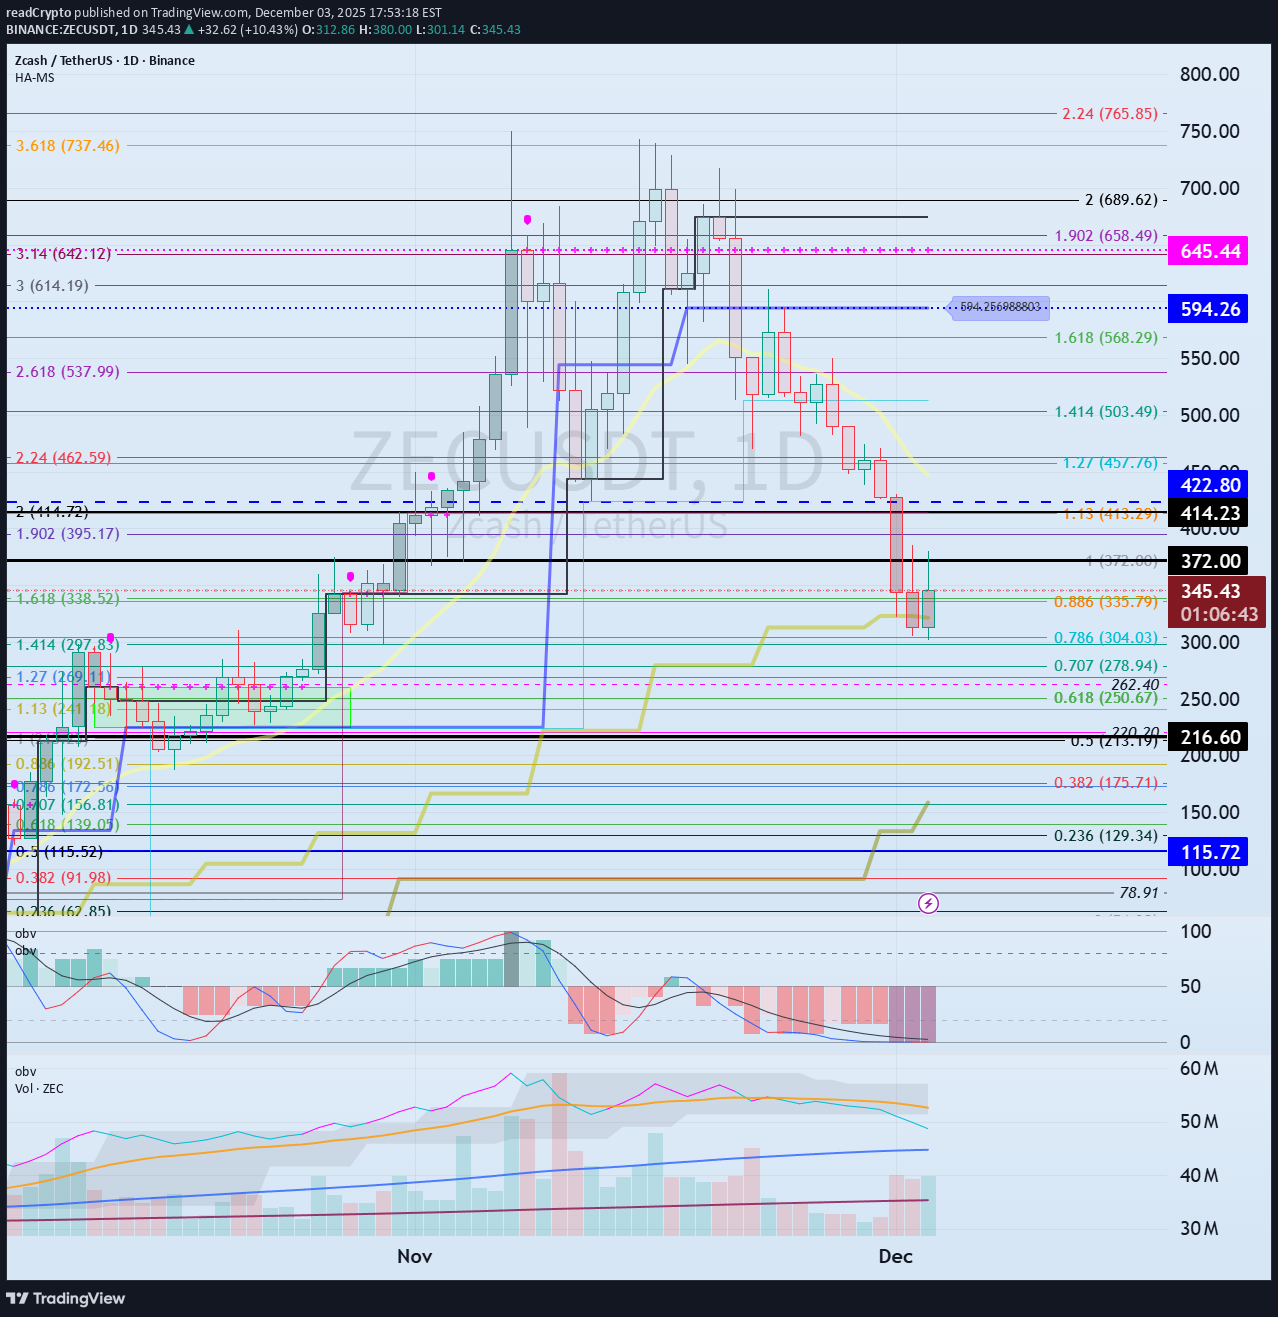
مرحبًا؟ مرحبا أیها التجار. إذا "تابعتنا"، فستحصل دائمًا على أحدث المعلومات بسرعة. أتمنى لک یوماً عظیماً. ------------------------------------- (مخطط ZECUSDT 1D) بعد الارتفاع الحاد، یظهر السعر انخفاضًا حادًا. المفتاح إلى التحول الصعودی هو ما إذا کان السعر یمکن أن یرتفع فوق 422.80 ویصمد. إذا فشل الاتجاه الصعودی، فإننا بحاجة إلى التحقق من الدعم حول 216.60. إذا انخفض إلى ما دون 216.60، فمن المرجح أن یستغرق بعض الوقت للارتفاع مرة أخرى. على الرغم من أن السعر یظهر اتجاه هبوطی قصیر المدى، حیث یقع تحت مؤشر M-Signal على الرسم البیانی 1D، إلا أنه یجب اعتباره اتجاهًا صعودیًا مستمرًا لأن مؤشر M-Signal على الرسم البیانی 1D > M-Signal على الرسم البیانی 1W > M-Signal على الرسم البیانی 1M یتم ترتیبه بهذا الترتیب. لذلک، إذا انخفض مؤشر M-Signal على الرسم البیانی 1W، فکر فی ما إذا کان یمکنه العثور على دعم بالقرب من مؤشر M-Signal على الرسم البیانی 1M وفکر فی خطة الاستجابة. ولذلک، فإن movement عندما ینخفض السعر إلى حوالی 216.60 أمر بالغ الأهمیة. هناک احتمال أن یرتفع السعر فوق مؤشر OBV المرتفع، مما یحافظ على السعر ویشیر إلى المزید من الارتفاع movement. ومع ذلک، نظرًا لأن مؤشر OBV المنخفض لا یزال أعلى من مؤشر OBV المرتفع، فمن المحتمل حدوث اتجاه جانبی movement. - شکرا لک على القراءة حتى النهایة. نتمنى لکم التداول الناجح. --------------------------------------------------
readCrypto
پیشبینی تکانههای بزرگ بازار ارز دیجیتال: تاریخ حساس و سطوح خرید و فروش حیاتی!
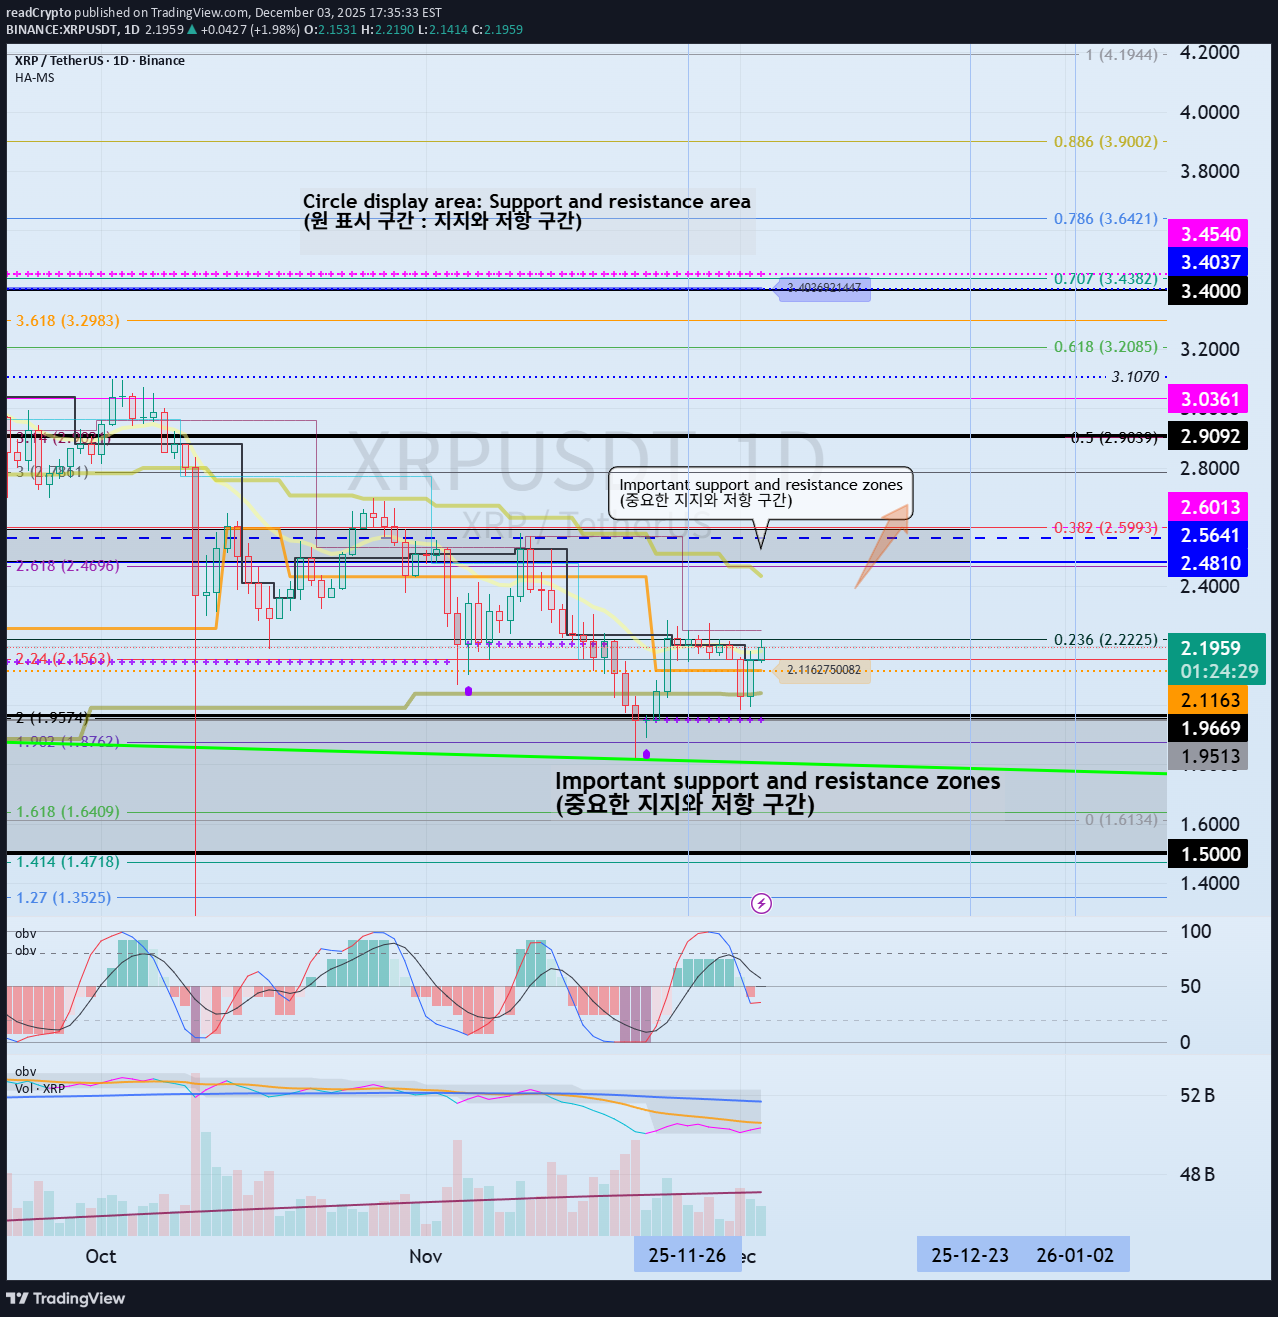
مرحبًا؟ مرحبا أیها التجار. إذا "تابعتنا"، فستحصل دائمًا على أحدث المعلومات بسرعة. أتمنى لک یوماً عظیماً. ------------------------------------- (مخطط XRPUSDT 1D) أعتقد أن الاتجاه الصاعد المتوقع سیستمر عندما یرتفع السعر فوق 2.4810-2.6013. ولذلک، فإن منطقة الشراء النهائیة هی منطقة 2.4810-2.6013. إذا انخفض السعر إلى ما دون المنطقة 1.5-19669، فیجب النظر فی اتجاه هبوطی طویل المدى. لذلک، إذا وجد الدعم حول منطقة 1.5-19669، فسیکون هذا هو الوقت المناسب للشراء من منظور طویل المدى. نظرًا لأنه من الصعب تحدید مستوى الدعم على الرسم البیانی أحادی الأبعاد وحده، فقد تم وضع علامة على مؤشرات StochRSI 80 و20 على الرسم البیانی 1M. ولذلک فإن النطاق 1.8209-1.9575 ینبغی اعتباره مستوى الدعم للاتجاه الصعودی المستمر. إذا ارتفع السعر فوق مؤشر OBV المرتفع واستقر، فمن المحتمل حدوث المزید من الارتفاع. ومع ذلک، یجب أن یخترق فوق مؤشر M-Signal على الرسم البیانی 1W. - شکرا لک على القراءة. نتمنى لکم التداول الناجح. --------------------------------------------------
readCrypto
رمز عبور صعود بیت کوین کش: آیا از محدوده حیاتی ۶۱۶ دلار عبور میکند؟
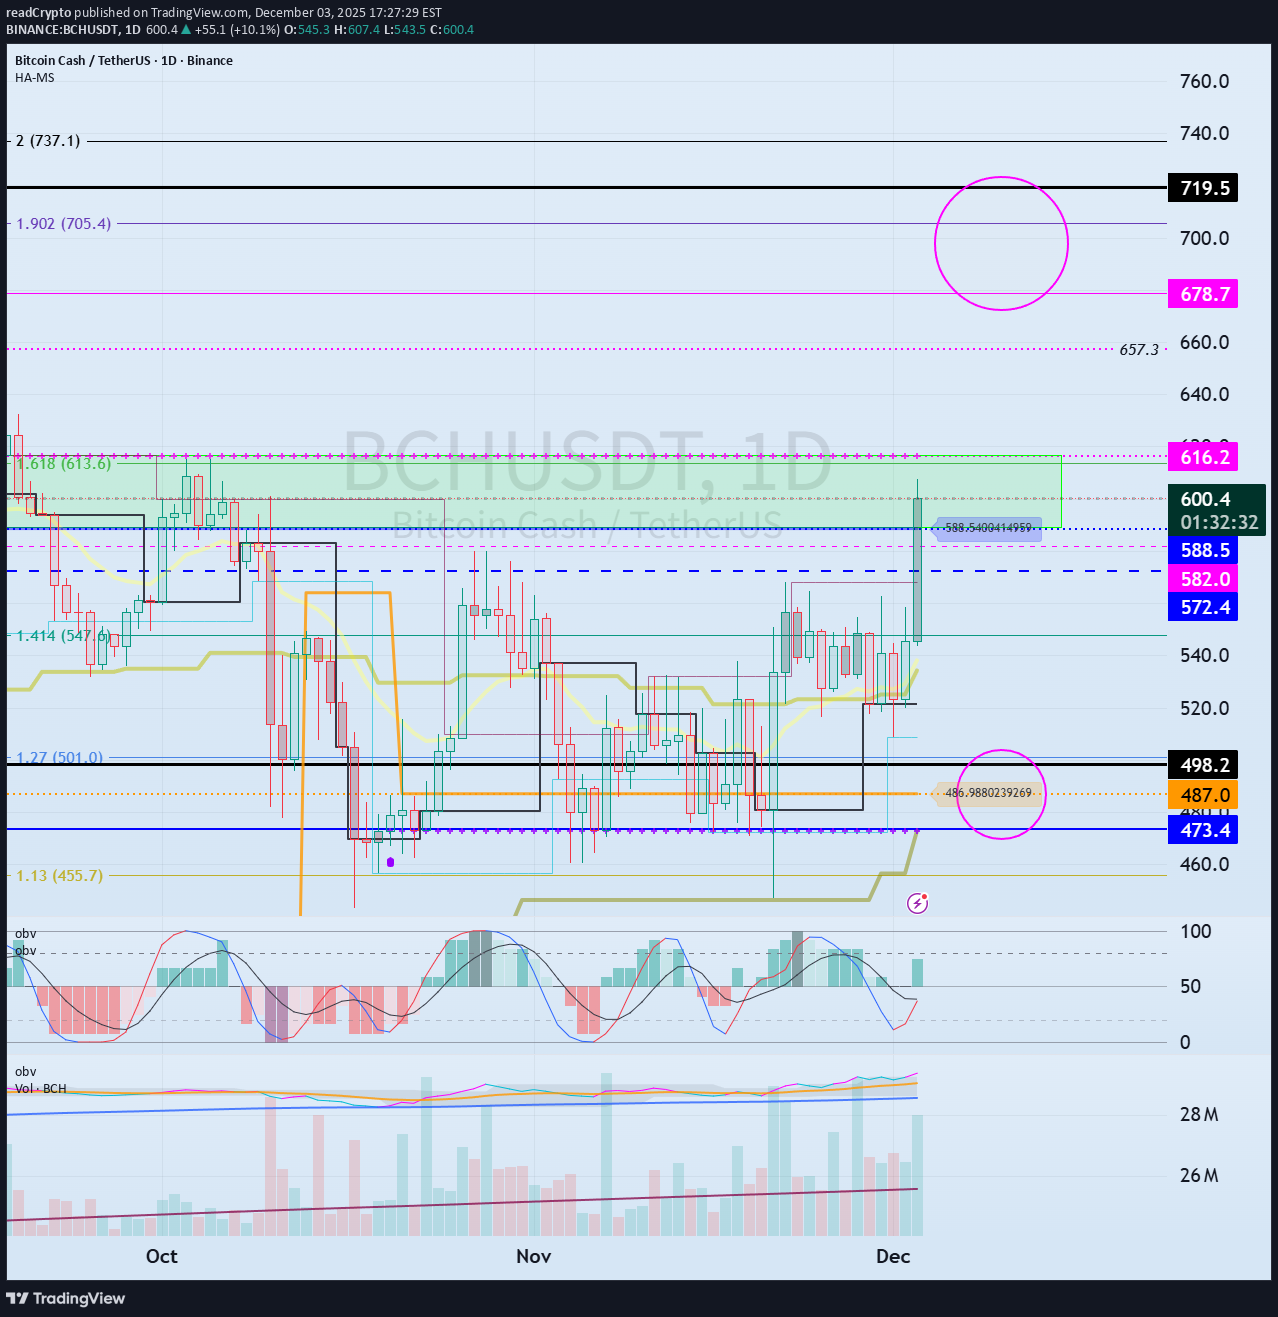
مرحبا أیها التجار! تابعنا للحصول على أحدث المعلومات بسرعة. أتمنى لک یوماً عظیماً. ------------------------------------- (مخطط BCHUSDT 1D) یرتفع الرسم البیانی 1D نحو نطاق HA-High ~ DOM (60)، مما یزید التوقعات بالاتجاه الصعودی. وبناء على ذلک، فإن السؤال الرئیسی هو ما إذا کان یمکن دعم النطاق 588.5-616.2 ویمکن أن یرتفع السعر. إذا ارتفع، فیجب علینا فحص ما إذا کان یمکنه اختراق النطاق 678.7-719.5، وهو النطاق الذی شکله مؤشر DOM (60) على الرسم البیانی لمدة شهر واحد والقمة السابقة. لمواصلة الاتجاه الصعودی عن طریق الاختراق فوق النقاط أو النطاقات الرئیسیة، یجب أن تظهر مؤشرات StochRSI وTC وOBV اتجاهات تصاعدیة. إذا کان ذلک ممکنا، - یجب ألا یدخل مؤشر StochRSI إلى منطقة ذروة الشراء. - یجب أن یبقى مؤشر TC أعلى من الصفر. - یجب أن یظل مؤشر OBV فوق الخط المرتفع. ولذلک، یجب علینا فحص تحرکات مؤشرات StochRSI وTC وOBV عندما یرتفع السعر فوق مؤشر DOM (60). إذا انخفض مؤشر StochRSI إلى ما دون 80، فسیتم اعتباره وقف الخسارة، حیث من المحتمل حدوث المزید من الانخفاضات. - شکرا لک على القراءة. نتمنى لکم التداول الناجح. --------------------------------------------------
readCrypto
آیا قیمت اتریوم بالای 2887.66 باقی میماند؟ کلید ادامه صعود کجاست؟
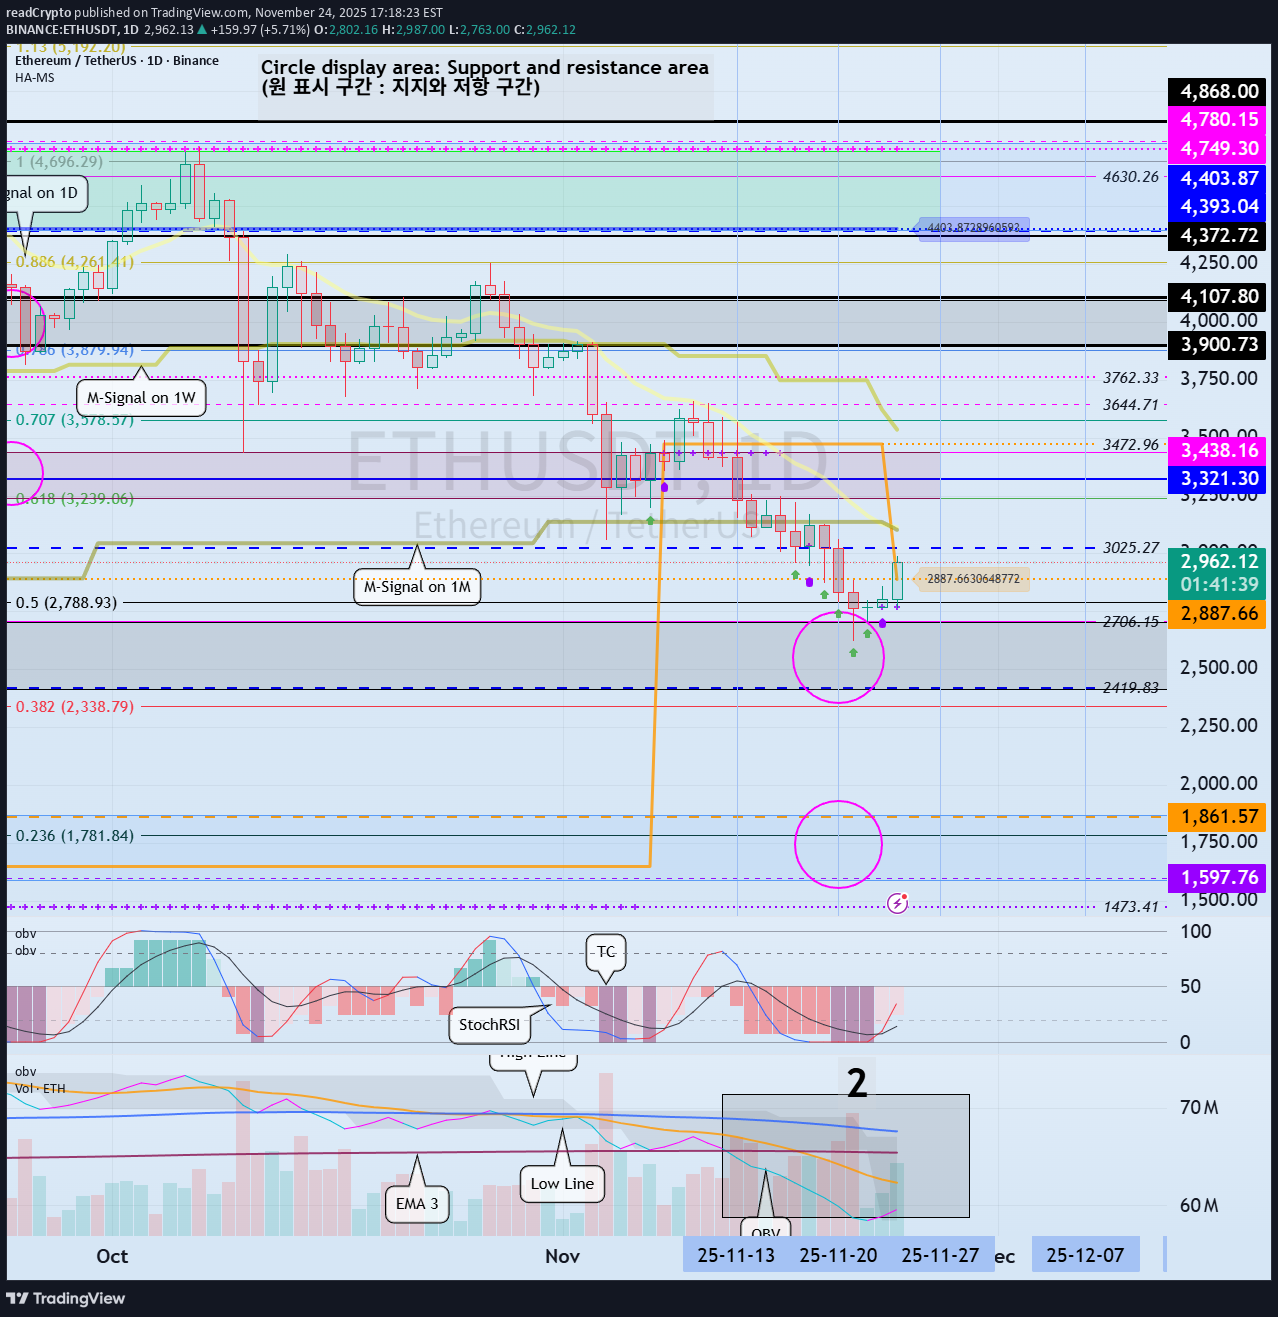
مرحبا زملائی التجار. إذا "تابعتنی"، فستتلقى دائمًا أحدث المعلومات بسرعة. أتمنى لک یوماً عظیماً. ------------------------------------- (مخطط ETHUSDT 1D) یظهر مؤشر HA-Low على الرسم البیانی 1D علامات التشکل عند 2887.66. وبما أن مؤشر HA-Low قد تشکل سابقًا عند 3472.96 ویظهر علامات التشکیل مرة أخرى، فإن تحدید ما إذا کان الدعم عند 2887.66 أمر بالغ الأهمیة. علاوة على ذلک، بما أن المؤشر یقع بالقرب من مؤشر M-Signal على الرسم البیانی 1M، فإننا نحتاج إلى معرفة ما إذا کان السعر یمکنه الحفاظ على زخمه الصعودی فوق مؤشر M-Signal على الرسم البیانی 1M. وبهذا المعنى، من المتوقع أن یؤدی الارتفاع فوق مستوى مؤشر HA-Low السابق عند 3472.96 إلى تحفیز الاتجاه الصعودی. لذلک، لضمان استمرار الاتجاه الصعودی بعد الاختراق فوق نقطة أو نطاق رئیسی، نحتاج إلى مراقبة ما إذا کانت مؤشرات StochRSI وTC وOBV تظل فی اتجاه صاعد. نظرًا لأن مؤشر OBV قد انخفض إلى ما دون مستوى EMA 3، فیجب أن یرتفع فوق مستوى EMA 3 ویظل فوقه. نحن بحاجة إلى تأکید ما إذا کان السعر یمکن أن یرتفع فوق مؤشر M-Signal على الرسم البیانی لملیون واحد بعد المرور خلال فترة التقلب هذه فی الفترة من 27 نوفمبر (26 إلى 28 نوفمبر). - شکرا لک على القراءة. نتمنى لکم التداول الناجح. --------------------------------------------------
readCrypto
تحلیل هفتگی و ماهانه بیت کوین: آیا کف قیمتی برای شروع خرس بازار مشخص شد؟
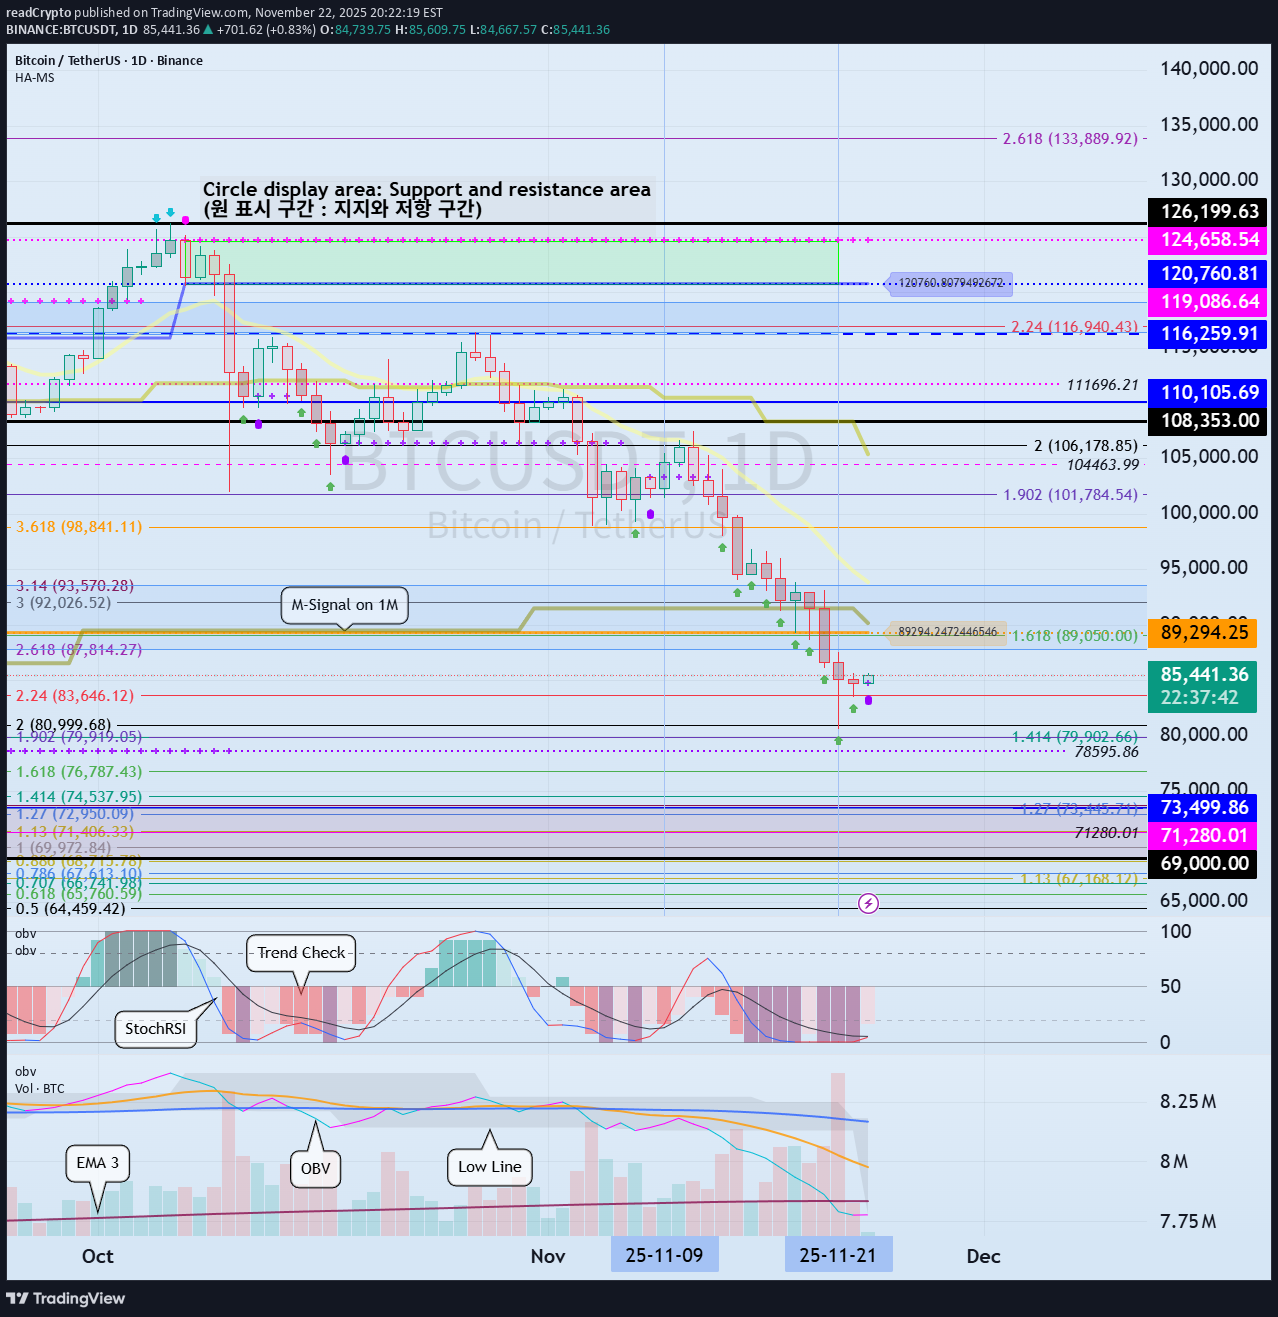
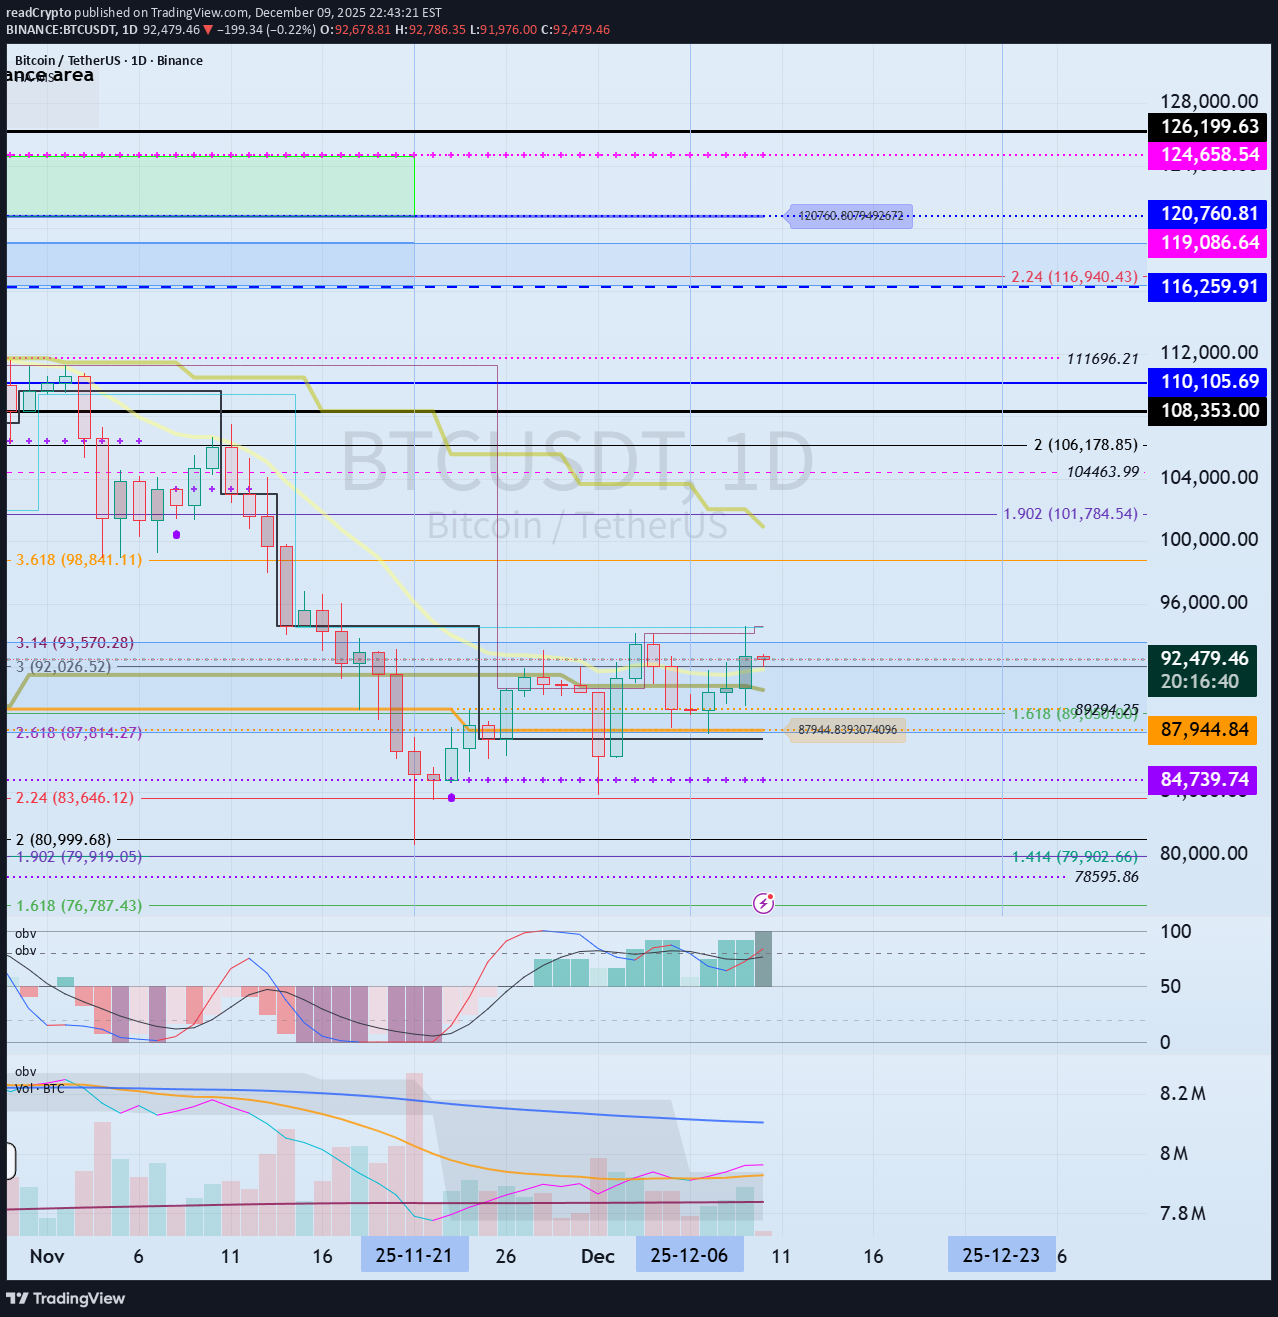
مرحبا زملائی التجار! تابعنا للحصول على أحدث المعلومات بسرعة. أتمنى لک یوماً عظیماً! ------------------------------------- (مخطط BTCUSDT 1D) انتهت فترة التقلبات. والمفتاح هو ما إذا کان یمکن أن یرتفع فوق 89294.25. إذا لم یکن الأمر کذلک، فنحن بحاجة إلى التحقق من الدعم بالقرب من 73499.86-69000. (مخطط 1W) فیما یلی مجالات مهمة عند انخفاض السعر عن النطاق الثالث: - 116259.91-119086.64 - 87814.27-93570.28 - 69000-73499.86 یمکن اعتبار الانخفاض تحت النطاق 69000-73499.86 اتجاهًا هبوطیًا طویل المدى، لذا فهذه منطقة مهمة جدًا فی الوقت الحالی. لذلک، مع اقتراب السعر من النطاق 69000-73499.86، نحتاج إلى التحقق من زیادة حجم التداول أو ظهور مؤشر HA-Low جدید على الرسم البیانی 1W. إذا تم تشکیل مؤشر HA-Low، فمن المهم تحدید ما إذا کان هناک دعم بالقرب منه. استراتیجیة التداول الأساسیة هی الشراء فی نطاق DOM(-60) ~ HA-Low والبیع فی نطاق HA-High ~ DOM(60). إذا ارتفع السعر بالقرب من مؤشر HA-Low وتحرک نحو مؤشر HA-High، فیجب اعتبار الموجة مغلقة (إعادة ضبط). على العکس من ذلک، إذا انخفض السعر بالقرب من مؤشر HA-High وتحرک نحو مؤشر HA-Low، فیجب أیضًا اعتبار الموجة مغلقة (إعادة ضبط). تعنی الموجة المغلقة (إعادة الضبط) أن الاتجاه قد تم إعادة تأسیسه. لذلک، کما ذکرنا سابقًا، یتم إنشاء استراتیجیة التداول الأساسیة. ومع ذلک، إذا ارتفع السعر فی نطاق HA-High ~ DOM(60)، فمن المحتمل أن یکون هناک اتجاه صعودی تدریجی، بینما إذا انخفض السعر فی نطاق DOM(-60) ~ HA-Low، فمن المحتمل أن یکون هناک اتجاه هبوطی تدریجی. نهایة الاتجاه الصعودی التدریجی هی انخفاض، ونهایة الاتجاه الهبوطی التدریجی هی الارتفاع. لذلک، فإن الانخفاض بعد مواجهة مؤشر HA-Low یختلف عن الانخفاض بعد مواجهة مؤشر HA-High. لذلک، یشیر الاتجاه الهبوطی التدریجی إلى فترة شراء اقتطاع، فی حین یشیر الاتجاه الصعودی التدریجی إلى فترة بیع اقتطاع. خلال الاتجاه الهبوطی التدریجی، حتى لو انخفض السعر، هناک توقع بحدوث زیادة فی السعر قریبًا، حتى تتمکن من زیادة عدد العملات المعدنیة (الرموز الممیزة) التی تمثل الربح. تتضمن هذه الطریقة التداول عند کل سعر شراء وبیع نفس الکمیة من العملات (الرموز) عندما یرتفع السعر، وبالتالی زیادة عدد العملات (الرموز) التی تمثل الربح. العملات المعدنیة (الرموز الممیزة) التی تمثل الربح هی تلک التی یبلغ سعر شرائها 0، مما قد یؤدی إلى أرباح کبیرة لاحقًا. - یمکن اعتبار الاتجاه الصعودی عندما یرتفع السعر فوق مؤشر M-Signal على الرسم البیانی 1M ویستمر. ومع ذلک، فإن النقطة التی یجب علیک الشراء فیها فعلیًا هی عندما یرتفع السعر فوق 108353.0. واستنادًا إلى الاتجاه الحالی، من المتوقع أن تکون فترة التقلب التالیة حوالی 23 دیسمبر. لذلک، یجب علیک التحقق لمعرفة ما إذا کان السعر یستقر فوق 89294.25 خلال فترة التقلب التالیة. ولذلک، یبدو من المحتمل أن یتحرک السعر move بشکل جانبی لعکس الاتجاه. بناءً على حرکة السعر، من المتوقع أن تبدأ بدایة السوق الهابطة major بعد الربع الأول من العام المقبل. ومع ذلک، إذا انخفض السعر إلى ما دون 69000-73499.86، فیجب علیک اعتبار هذا سوقًا هابطًا والتفکیر فی خطة الاستجابة. - شکرا لک على القراءة حتى النهایة. أتمنى لک التداول الناجح. -------------------------------------------------- - وهنا توضیح للصورة الکبیرة. (سوق صاعدة لمدة 3 سنوات، نمط سوق هابط لمدة عام واحد) سأشرح المزید من التفاصیل عندما یبدأ السوق الهابط. ------------------------------------------------------
readCrypto
رمزگشایی بیت کوین: آیا قیمت روی ۸۹۲۹۴ دلار حمایت میشود؟
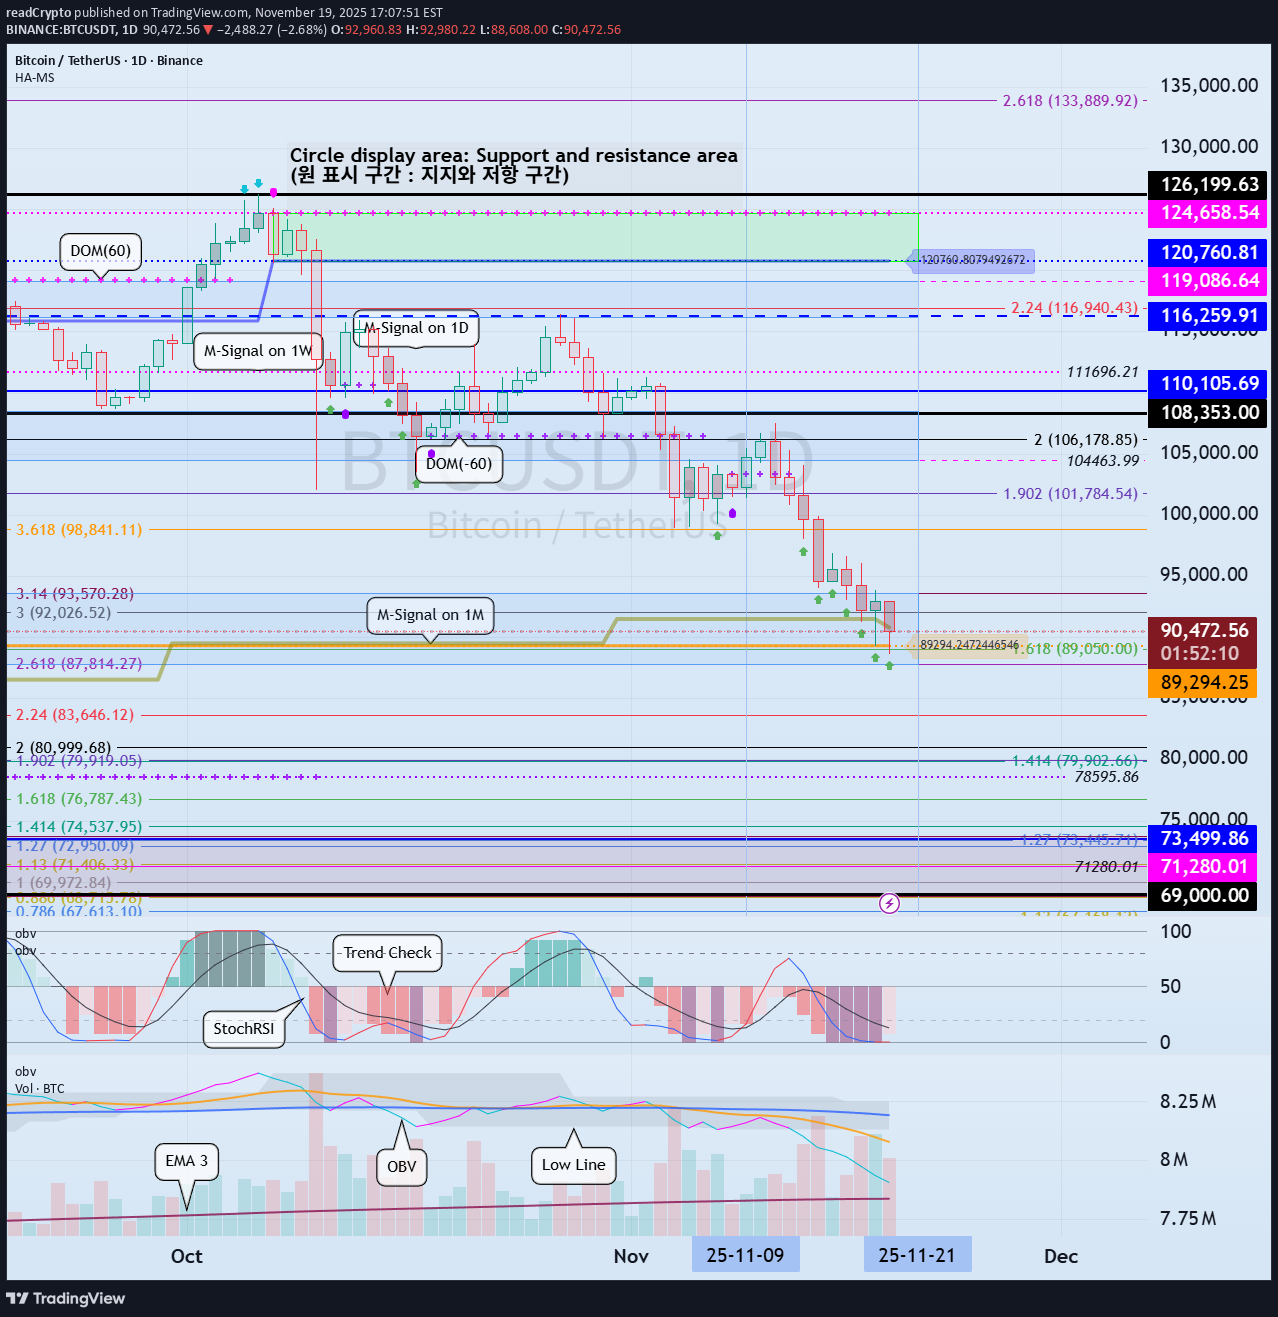
مرحبا زملائی التجار! تابعنا للحصول على أحدث المعلومات بسرعة. أتمنى لک یوماً عظیماً. ------------------------------------- (مخطط BTCUSDT 1D) ومن المتوقع أن تستمر فترة التقلب هذه حتى 22 نوفمبر. إذا فشل السعر فی العثور على الدعم والارتفاع بالقرب من مؤشر M-Siganl على الرسم البیانی لکل ملیون بعد هذه الفترة من التقلب، فمن المرجح أن ینخفض إلى مستوى 69000-73499.86. لذلک، فإن السؤال الرئیسی هو ما إذا کان بإمکانه العثور على الدعم والارتفاع بالقرب من مستوى مؤشر HA-Low عند 89,294.25 على الرسم البیانی أحادی الأبعاد. - (مخطط 1 ملیون) ویظهر اتجاه تنازلی، حیث فشل فی الوصول إلى نسبة فیبوناتشی 2.618 (133,889.92)، والتی کانت تعتبر المستوى المستهدف. ومع ذلک، إذا ظل السعر فوق مستوى 69,000.0-73,499.86، فمن المتوقع أن یحافظ على اتجاه تصاعدی على المدى الطویل. - (مخطط 1W) إذا ارتفع السعر فوق مؤشر HA-High، فمن المرجح أن form اتجاه صعودی تدریجی. وبما أن الاتجاه الصعودی التدریجی عادة ما ینتهی بالانخفاض، فقد یکون هذا الانخفاض علامة على الاتجاه الهبوطی. یمکن استخدام مؤشر M-Signal على الرسم البیانی 1M کمعیار للاتجاهات الصعودیة والهبوطیة. لذلک، إذا ظل السعر أقل من مؤشر M-Signal على الرسم البیانی 1M، فیجب اعتباره اتجاهًا هبوطیًا ویجب أخذ الاستجابة فی الاعتبار. ومع ذلک، وبالنظر إلى الاتجاه العام للبیتکوین، فإن النطاق الأکثر أهمیة هو النطاق 69000-73499.86. وطالما لم ینخفض إلى ما دون هذا النطاق، فمن المتوقع أن یحافظ السعر على اتجاه صعودی على المدى الطویل. - شکرا لک على القراءة حتى النهایة. أتمنى لک التداول الناجح. -------------------------------------------------- - هذا توضیح للصورة الکبیرة. (سوق صاعدة لمدة 3 سنوات، نمط سوق هابط لمدة عام واحد) سأشرح بمزید من التفصیل عندما یبدأ السوق الهابط. ------------------------------------------------------
readCrypto
سیگنال حیاتی M در نمودار 1 دقیقهای بیت کوین: آیا بازار صعودی میشود؟

مرحبا زملائی التجار! تابعنی للحصول على أحدث المعلومات بسرعة. أتمنى لک یوماً عظیماً. ------------------------------------- (مخطط USDT 1D) (مخطط USDC 1D) USDT هی العملة major التی تؤثر على سوق العملات. تتحرک الرسوم البیانیة USDT وUSDC فی اتجاهین متعاکسین. یبدو أن هذا الانخفاض مدفوع بتدفق الأموال من USDC. بمجرد توقف انخفاض فجوة USDC، من المتوقع أن تؤدی الأموال المتدفقة عبر USDT إلى دفع سوق العملات إلى الارتفاع. - (USDT.D مخطط 1 ملیون) لکی یظهر سوق العملات اتجاهًا تصاعدیًا، یجب أن تظل هیمنة USDT أقل من 4.91 أو تظهر اتجاهًا هبوطیًا. نحن بحاجة لمعرفة ما إذا کان السعر یمکن أن یواجه مقاومة حول مستوى فیبوناتشی 0.618 ثم یتجه نحو الأسفل. إذا لم یکن الأمر کذلک، فیجب أن نفکر فی خطة الاستجابة، حیث من المتوقع الارتفاع نحو 7.13. - (BTC.مخطط D 1M) لکی یبدأ السوق الصاعد للعملات البدیلة، یجب أن یظل أقل من 55.01 أو یظهر اتجاهًا هبوطیًا. لذلک، بالنسبة للسوق الصاعدة التی ننتظر حدوثها، یجب أن تنخفض هیمنة USDT وهیمنة BTC. إذا انخفضت هیمنة USDT بینما ارتفعت الهیمنة BTC، فسوف تظهر سوق صاعدة، مع ارتفاع BTC فقط. -------------------------------------------------- (مخطط BTCUSDT 1D) المفتاح هو ما إذا کان السعر یمکنه لمس مؤشر M-Signal على الرسم البیانی 1M ویتحول إلى الاتجاه الصعودی. عند هذه النقطة، من المهم الحفاظ على السعر فوق 89294.25. إذا لم یکن الأمر کذلک، فمن المرجح أن یکون هناک اتجاه التنحی. للتحول إلى الاتجاه الصعودی، یجب أن یظل السعر فوق مؤشر M-Signal على الرسم البیانی 1W. عند هذه النقطة، من المهم الحفاظ على السعر فوق نقطة مؤشر HA-High التی تم إنشاؤها حدیثًا والتی تبلغ 110105.69 على الرسم البیانی للشهر الواحد. إذا لم یکن الأمر کذلک، فقد یتظاهر السعر بالارتفاع ثم ینخفض مرة أخرى، لذلک علیک التفکیر فی التدابیر المضادة. هذه هی استراتیجیة التداول الأساسیة ضمن نطاق الصندوق: الشراء بین DOM(-60) وHA-Low والبیع بین HA-High وDOM(60). إذا ارتفع السعر فی نطاق HA-High ~ DOM(60) أو انخفض فی نطاق DOM(-60) ~ HA-Low، فیجب علیک التبدیل إلى تداول الاتجاه. للقیام بذلک، یجب أن نأخذ فی الاعتبار تحرکات مؤشرات StochRSI وTC (فحص الاتجاه) وOBV. للحفاظ على الاتجاه الصعودی بعد الاختراق فوق نقطة أو نطاق رئیسی، یجب أن تظهر مؤشرات StochRSI وTC وOBV اتجاهات تصاعدیة. عند هذه النقطة، 1. لا ینبغی أن یدخل مؤشر StochRSI إلى منطقة ذروة الشراء. 2. یجب أن یظل مؤشر TC أعلى من الصفر. 3. یجب أن یظل مؤشر OBV فوق الخط المرتفع. لذلک، تحقق من تحرکات مؤشرات StochRSI وTC وOBV عند مستویات الدعم والمقاومة الموضحة على الرسوم البیانیة 1M و1W و1D وفکر فیما إذا کان بإمکانک التداول وفقًا لذلک. بناءً على النطاق السعری الحالی، فإن النقاط أو النطاقات الرئیسیة هی: - 87814.27-93570.28 - 110105.69 - 120760.81-124658.54 أعتقد أن النطاقات الثلاثة المذکورة أعلاه هی نقاط أو نطاقات مهمة. لذلک، عندما یقترب السعر من هذه النطاقات، یجب علیک التحقق من تحرکات مؤشرات StochRSI وTC وOBV لتحدید خطة الاستجابة. - شکرا لک على القراءة حتى النهایة. أتمنى لک التداول الناجح. -------------------------------------------------- - هذا توضیح للصورة الکبیرة. (سوق صاعدة لمدة 3 سنوات، نمط سوق هابط لمدة عام واحد) سأشرح بمزید من التفصیل عندما یبدأ السوق الهابط. ------------------------------------------------------
readCrypto
حمایت حیاتی اتریوم (ETH): آیا قیمت پس از تثبیت در 3472 دلار اوج میگیرد؟
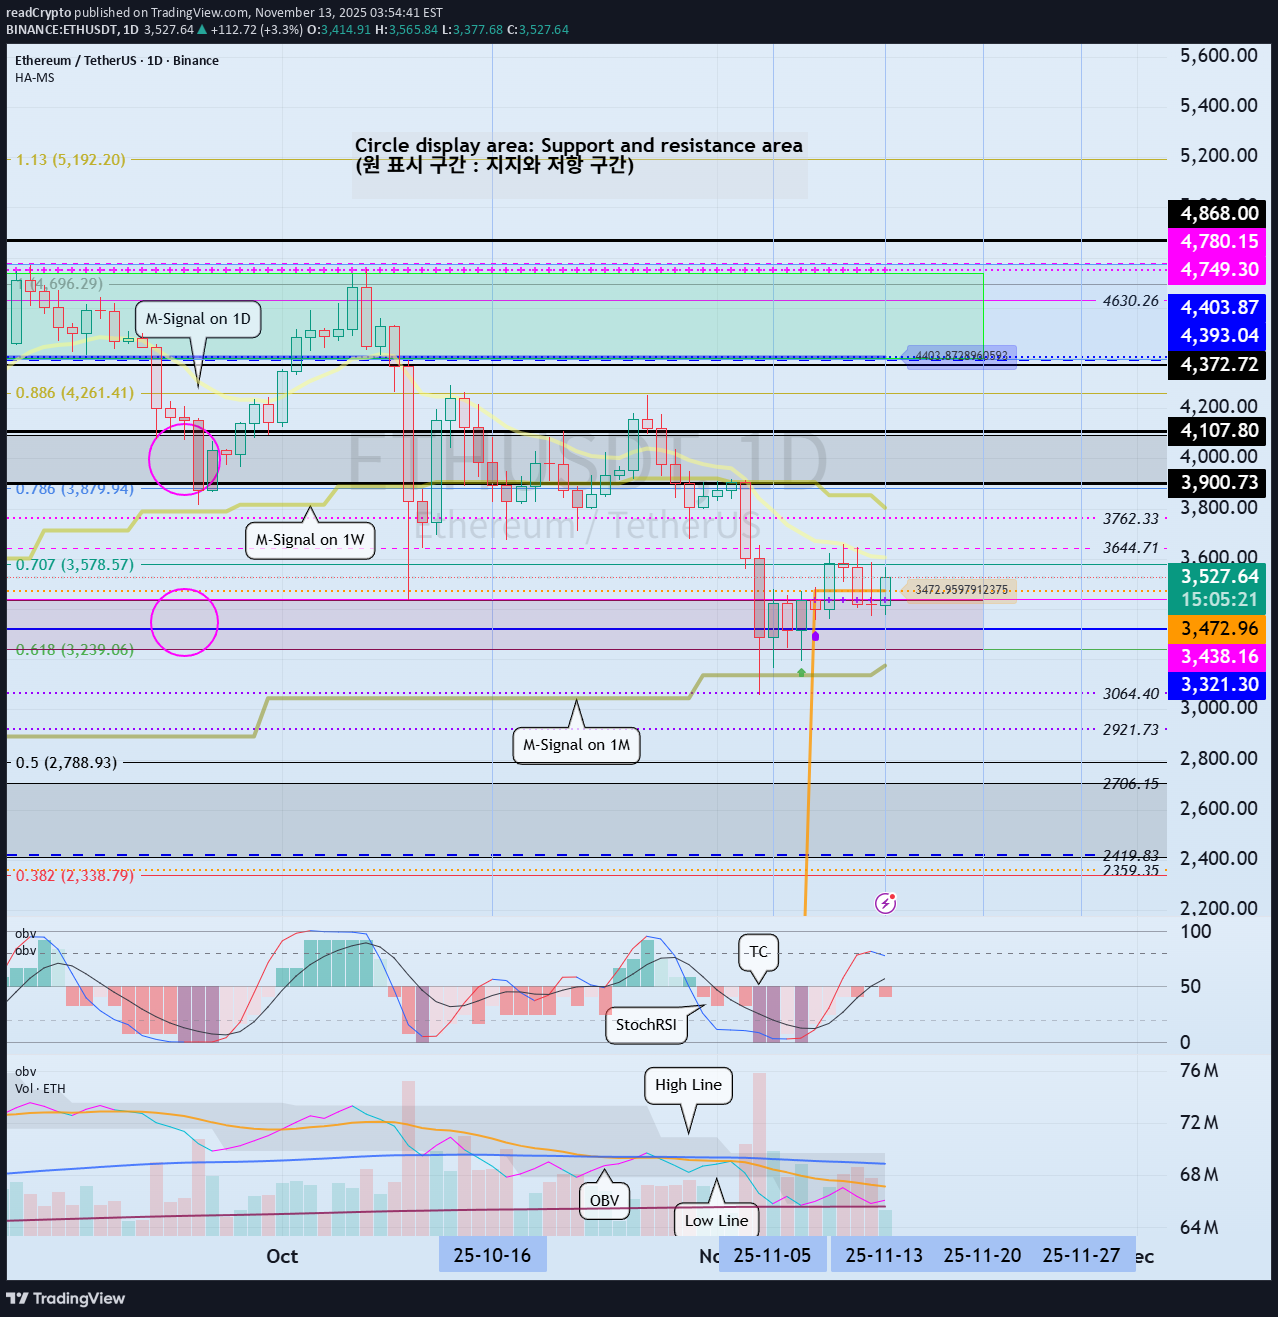
مرحبا أیها التجار! تابعنا للحصول على أحدث المعلومات بسرعة. أتمنى لک یوماً عظیماً! ------------------------------------- (مخطط ETHUSDT 1D) ومن المتوقع أن تستمر فترة التقلب هذه حتى 14 نوفمبر. بعد هذه الفترة من التقلبات، فإن السؤال الرئیسی هو ما إذا کان السعر یمکن أن یرتفع بعد الحصول على الدعم بالقرب من مؤشر HA-Low (3472.96) على الرسم البیانی أحادی الأبعاد. عند هذه النقطة، من المهم معرفة ما إذا کان السعر یمکن أن یرتفع فوق مؤشر M-Signal على الرسم البیانی 1W ویحافظ على زخمه الصعودی. إذا فشل السعر فی الارتفاع، فمن المتوقع أن یلتقی بمؤشر M-Signal على الرسم البیانی 1M مرة أخرى. ولذلک، لمواصلة الاتجاه الصعودی، یجب أن یبقى السعر فوق مستوى 3239.06-3472.96. یشیر تشکیل مؤشر HA-Low على الرسم البیانی 1D إلى انخفاض کبیر وتشکیل قاع. لذلک، حتى لو استمر الاتجاه الهبوطی، هناک احتمالیة لحدوث اتجاه صعودی فی نهایة المطاف، لذلک نحن بحاجة إلى النظر فی التدابیر المضادة. ومع ذلک، إذا التقى السعر بمؤشر HA-High على الرسم البیانی 1D أو انخفض بالقرب من مستوى HA-High، فمن المرجح أن ینخفض السعر حتى یلتقی بمؤشر HA-Low مرة أخرى أو مؤشر DOM (-60). ولذلک، یجب أن نتذکر استراتیجیة التداول الأساسیة للشراء فی نطاق DOM(-60) ~ HA-Low والبیع فی نطاق HA-High ~ DOM(60). إذا ارتفع نطاق HA-High ~ DOM(60)، فمن المحتمل أن یکون هناک اتجاه تصاعدی تدریجی، بینما إذا انخفض نطاق DOM(-60) ~ HA-Low، فمن المحتمل أن یکون هناک اتجاه هبوطی تدریجی. ولذلک، ینبغی أن تکون استراتیجیة التداول الأساسیة نهجا تجاریا مجزأة. لتحدید التداول ضمن نطاق الصندوق وتداول الاتجاه خارج نطاق الصندوق، نشیر إلى المؤشرات الإضافیة الإضافیة، StochRSI، TC (Trend Check)، وOBV. لمواصلة الاتجاه الصعودی عن طریق الاختراق فوق نقطة أو نطاق رئیسی، یجب أن تظهر مؤشرات StochRSI وTC وOBV اتجاهات تصاعدیة. 1. لا ینبغی أن یدخل مؤشر StochRSI إلى منطقة ذروة الشراء. 2. یجب أن یظل مؤشر TC أعلى من 0. 3. یجب أن یظل مؤشر OBV فوق الخط المرتفع. لذلک، من المهم ملاحظة movement حول النقاط أو النطاقات المهمة، مثل DOM(-60) ~ HA-Low وHA-High ~ DOM(60). ستکون الفترة التالیة من التقلبات حوالی 20 نوفمبر. - شکرا لک على القراءة حتى النهایة. أتمنى لک التداول الناجح. --------------------------------------------------
readCrypto
نوسانات بزرگ بعدی بیت کوین در راه است: تحلیل دقیق سطح حمایت و مقاومت!
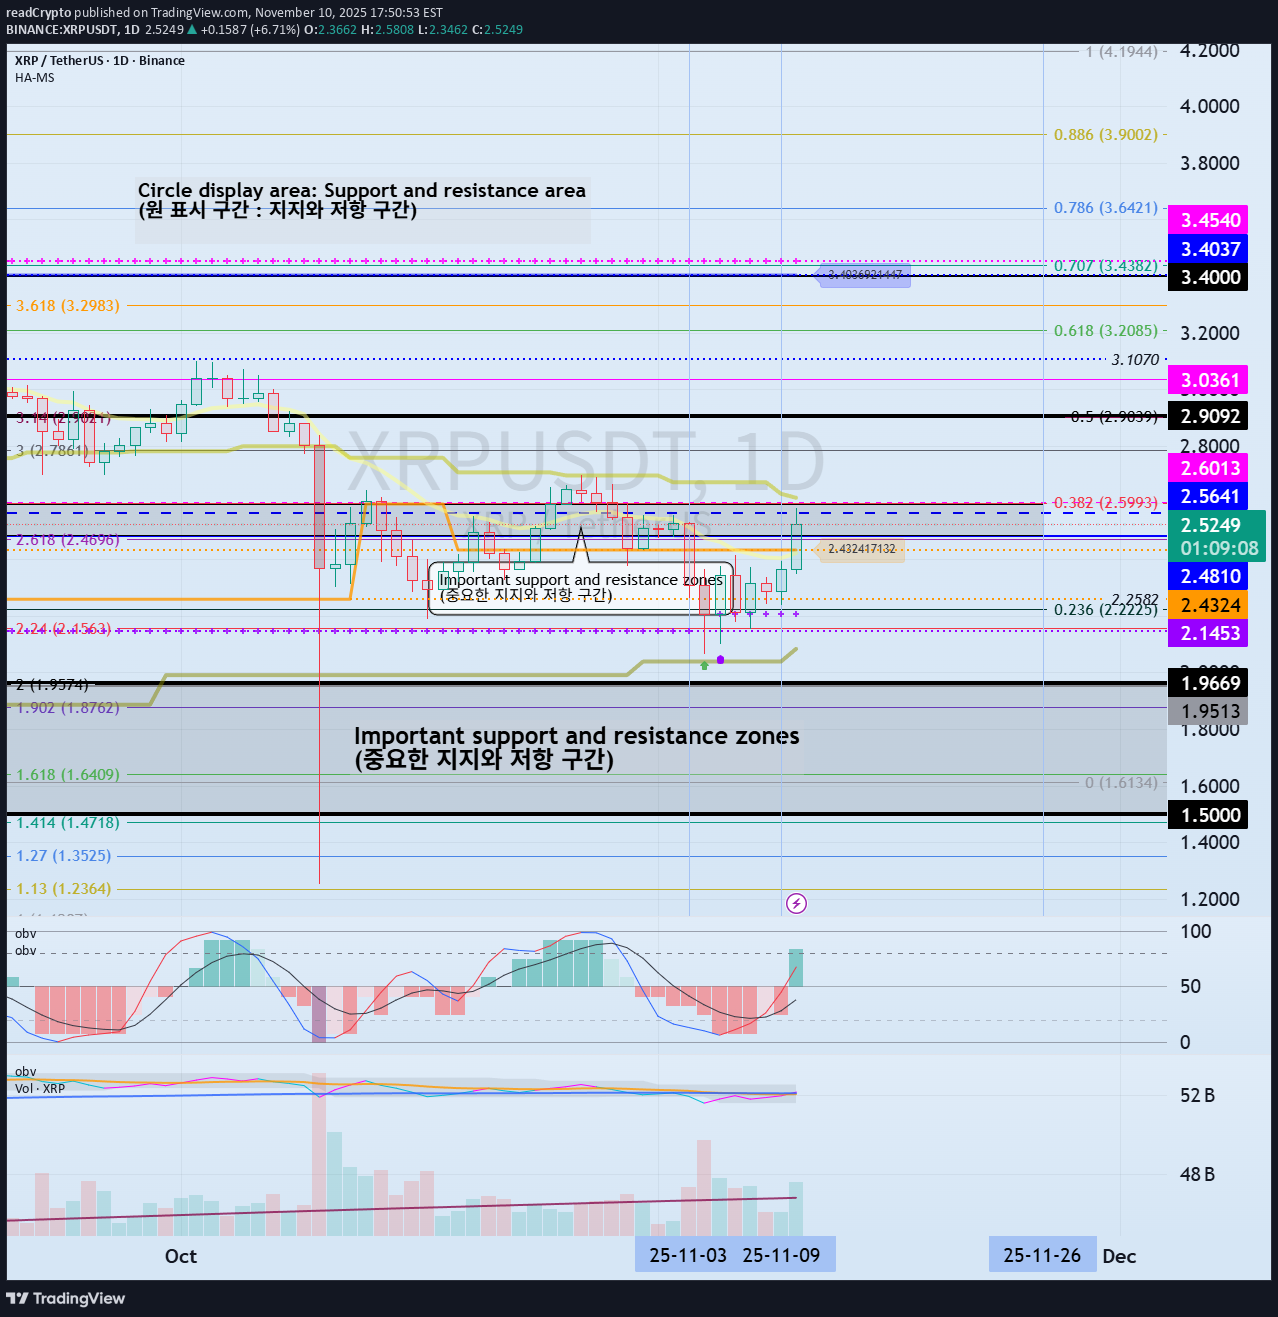
مرحبا أیها التجار! تابعنی للحصول على أحدث المعلومات بسرعة. أتمنى لک یوماً عظیماً! ------------------------------------- (مخطط XRPUSDT 1D) حالیًا، إشارة M على الرسم البیانی 1W > السعر > إشارة M على الرسم البیانی 1D > إشارة M على الرسم البیانی 1M. بالإضافة إلى ذلک، فإنه یحاول الاختراق فوق مؤشر StochRSI 80. لذلک، إذا وجد دعمًا بالقرب من مؤشر StochRSI 80 وارتفع، فمن المحتمل جدًا أن یدخل فی اتجاه صعودی. تقع منطقة المقاومة حول 3.4037-3.4540، وهو نطاق HA-High ~ DOM (60). ما ورد أعلاه هو تفسیر یعتمد فقط على الرسم البیانی أحادی الأبعاد. - یعرض الرسم البیانی أعلاه نقاط الدعم والمقاومة المرسومة على الرسوم البیانیة 1M و1W و1D. یشیر هذا إلى أن الدعم والمقاومة قد تشکلا فی النطاق 2.9092-3.0361. لذلک، قمنا بتحدید منطقة یمکننا من خلالها تنفیذ عملیة بیع على مرحلتین. وسیکون هذا التأکید حاسما للحفاظ على حالة نفسیة مستقرة وسط تقلبات الأسعار. إذا انخفض السعر إلى نطاق 1.5-1.9669، وهو المستوى الأکثر أهمیة للحفاظ على الاتجاه الصعودی، فیجب علیک مراقبة الزیادة الهائلة فی حجم التداول. إذا أظهر الدعم، فإنه یشیر إلى فرصة شراء. - شکرا لک على القراءة حتى النهایة. أتمنى لک التداول الناجح. --------------------------------------------------
إخلاء المسؤولية
أي محتوى ومواد مدرجة في موقع Sahmeto وقنوات الاتصال الرسمية هي عبارة عن تجميع للآراء والتحليلات الشخصية وغير ملزمة. لا تشكل أي توصية للشراء أو البيع أو الدخول أو الخروج من سوق الأوراق المالية وسوق العملات المشفرة. كما أن جميع الأخبار والتحليلات المدرجة في الموقع والقنوات هي مجرد معلومات منشورة من مصادر رسمية وغير رسمية محلية وأجنبية، ومن الواضح أن مستخدمي المحتوى المذكور مسؤولون عن متابعة وضمان أصالة ودقة المواد. لذلك، مع إخلاء المسؤولية، يُعلن أن المسؤولية عن أي اتخاذ قرار وإجراء وأي ربح وخسارة محتملة في سوق رأس المال وسوق العملات المشفرة تقع على عاتق المتداول.