
pakoumal
@t_pakoumal

ما هو الشيء الذي ننصحك بشراءه من المواد الغذائية؟
سابق في الشراء
پیام های تریدر
مرشح
تحلیل هفتگی بازار: چرا QQQ شما را کلافه خواهد کرد؟ (پیشبینی 5 ژانویه)

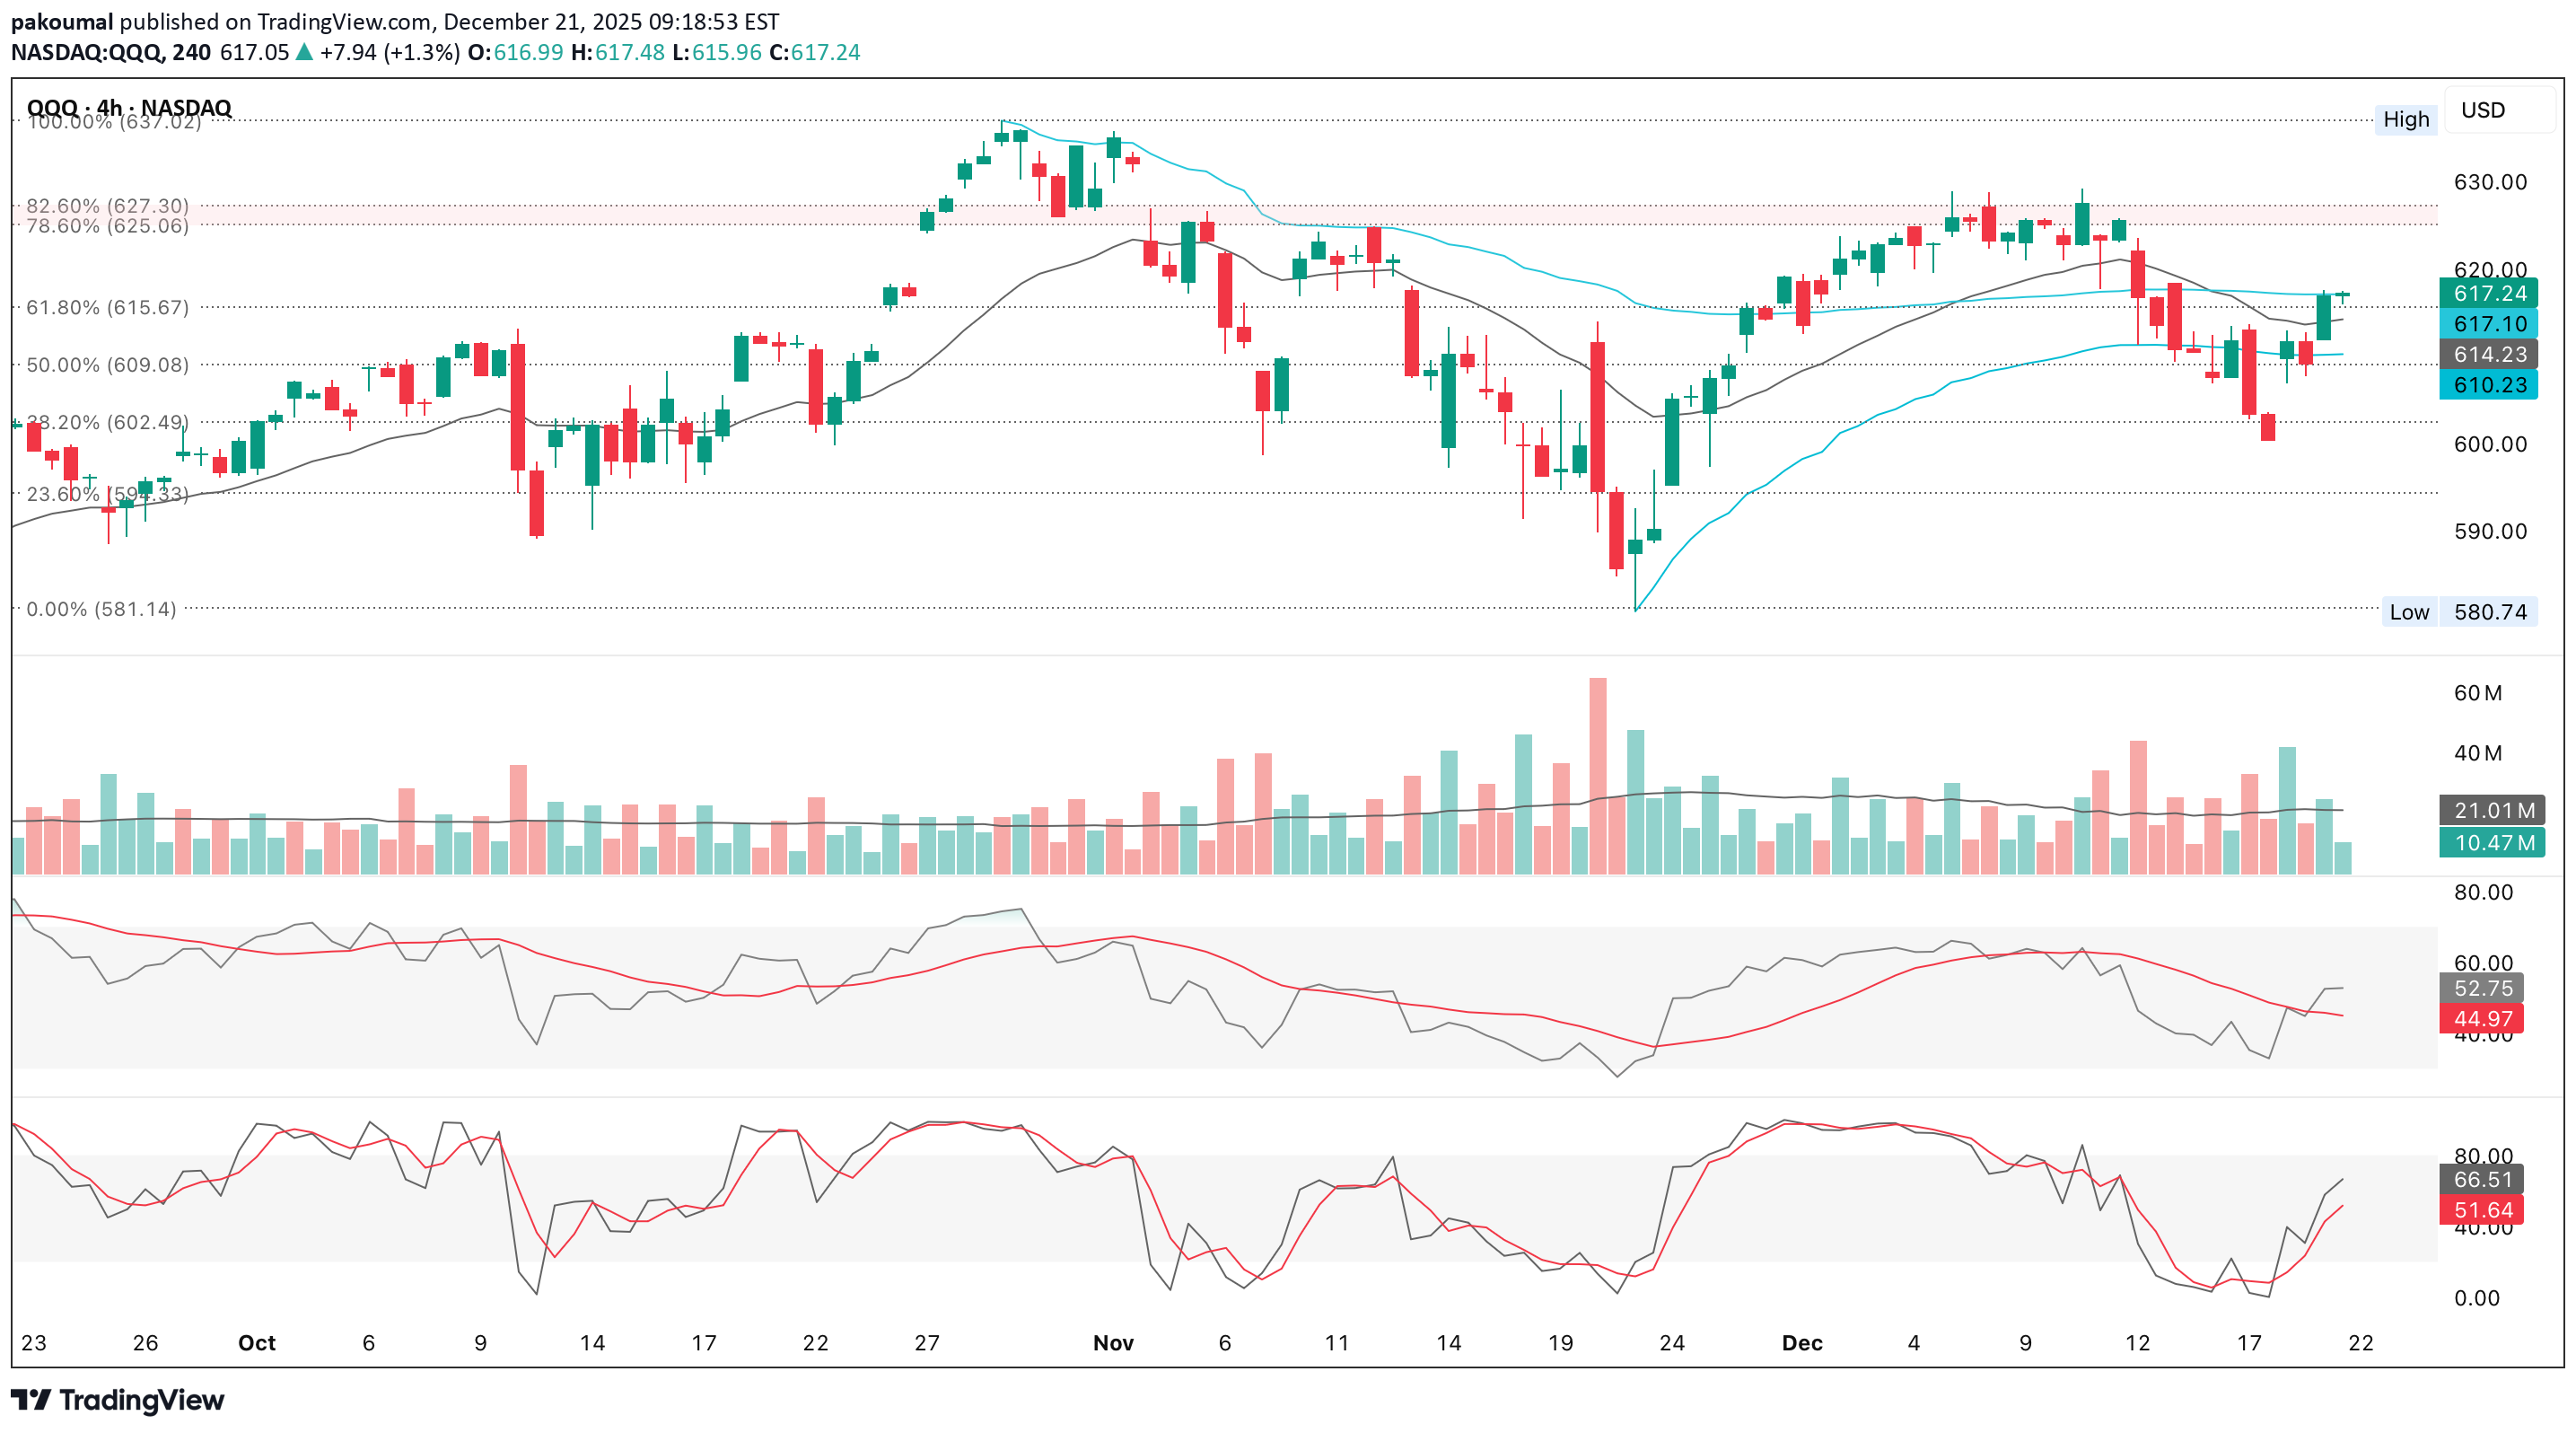
فی الوقت الحالی، تقوم QQQ بالضبط بما تفعله الأسواق القویة قبل اتخاذ القرار، أی الإحباط یسجل السعر أدنى مستویاته المرتفعة، ولکنه أدنى مستویاته منذ تلک القمة التی تمثل استمرارًا للاتجاه الکلاسیکی الإغلاق المستدام تحت مستوى 50 یومًا، خاصة مع حجم التداول الذی یفتح الطریق إلى 100 یوم (~ 602 دولارًا أمریکیًا) لا یزال الاتجاه صعودیًا، والزخم یتباطأ، والتقلبات تنکمش ومن المرجح أن یتم حلها بتوسیع النطاق - یتم تحدیده من خلال أی جانب ینکسر أولاً وبدون توسع، فإن أی move مشکوک فیه السعر الحالی (~ 613 دولارًا أمریکیًا) أعلى بقلیل من القیمة التی تتراوح بین 608 دولارًا أمریکیًا و 612 دولارًا أمریکیًا الحجم المنخفض أعلاه یجعل الاتجاه الصعودی أسهل إذا تدخل المشترون إذا انخفض السعر إلى 608 دولارًا - 612 دولارًا، فمن المرجح إحصائیًا أن یدافع المشترون القبول تحت ~ 608 دولارًا أمریکیًا من شأنه أن یقلب الوضع الهبوطی على المدى القصیر القبول فوق ~ 620 دولارًا یفضل التراجع إلى أعلى مستویات النطاق وهذا یدعم أسبوعًا محدد النطاق، ما لم یظهر محفز یتم تغطیة الاتجاه الصعودی دون توسع ویتم احتواء الاتجاه الهبوطی ما لم ینکسر الاتجاه تحقق نسبة SMH/QQQ مستویات قیاسیة جدیدة وتتسارع فوق المتوسط المتحرک الصاعد تتفوق أشباه الموصلات على QQQ بشکل حاسم القیادة ضیقة ولکنها قویة لیس هذا هو ما یبدو علیه السوق قبل حدوث تغییر واسع النطاق الفارق الدقیق هو أن المنحدر حاد → ممتد على المدى القصیر، ولکن الاتجاه سلیم، ولیس متباعدًا طالما بقی SMH/QQQ فوق متوسطه المتحرک الصاعد ولم یکسر الهیکل، فإن عملیات انسحاب QQQ قابلة للشراء إحصائیًا، ولیست نهایة للاتجاه وهذا یقلل بشکل مباشر من احتمالیة انهیار deep QQQ هذا الأسبوع یعتبر AAPL وزنًا ثقیلًا، ولکنه لا ینهار، لذا فهو یمثل عائقًا ولیس تهدیدًا یقوم MSFT بالطرح بشکل نشط من QQQ وهذا ما یفسر سبب عدم اتباع QQQ لنصف النهائی الأعلى لأن ضعف MSFT وحده لا یکسر QQQ ما لم یتبعه الآخرون یعتبر NVDA داعمًا ولیس متفجرًا ویتوافق تمامًا مع قوة SMH/ضغط QQQ بدلاً من الاختراق، لذلک یعمل NVDA کمثبت، مما یعارض مرة أخرى تسارع الاتجاه الهبوطی یظهر META لیس مؤشرا على فشل الاتجاه یدعم PLTR الرغبة فی المخاطرة، حتى مع التقلبات یعتبر TSLA بمثابة ریاح معاکسة، لکنه کان کذلک منذ أشهر - لا شیء جدید هنا من الجانب إلى الأعلى ضمن النطاق (≈60–65%) یحمل QQQ ما یقرب من 608 دولارًا - 612 دولارًا یتراوح بین 610 دولارًا - 625 دولارًا فشل فی الانهیار على الرغم من ضعف MSFT أی تراجع اشترى بسرعة وهذا هو بالضبط ما تنتجه عادةً نسب SMH/QQQ القویة التوسع الصعودی (≈25%) تجاوز ~625 دولارًا → 632 دولارًا – 637 دولارًا سیتطلب استقرار MSFT (ولیس حتى الارتفاع)، ودفع NVDA نحو أعلى النطاقات وبقاء عرض SMH/QQQ إذا تم تفعیل ذلک، فمن المحتمل أن یقوم QQQ بوضع علامة على السیولة بسرعة الانهیار الهبوطی (≈10–15%) خسارة ~ 608 دولارًا → اختبار ~ 602 دولارًا یتطلب تمدید SMH/QQQ (لم یحدث بعد)، وخسارة NVDA 180 دولارًا أمریکیًا بشکل حاسم وتسارع MSFT نحو الانخفاض وبدون ذلک، من المحتمل أن یظل الجانب السلبی واردًا وتصحیحیًا المخاطرة هی SMH/QQQ أقل من MA ( إعادة تقییم کل شیء )، NVDA < ~&470 (الضغط، لکنه لیس ممیتًا وحده) نصف النهائی یحمل الشریط من المرجح أن یحبط QQQ کلا من المضاربین على الارتفاع والدببة هذا الأسبوع أکثر من الاتجاه hard أبل میتا MSFT NVDA بلتر TSLA جاسوس QQQ
QQQ (26 December)

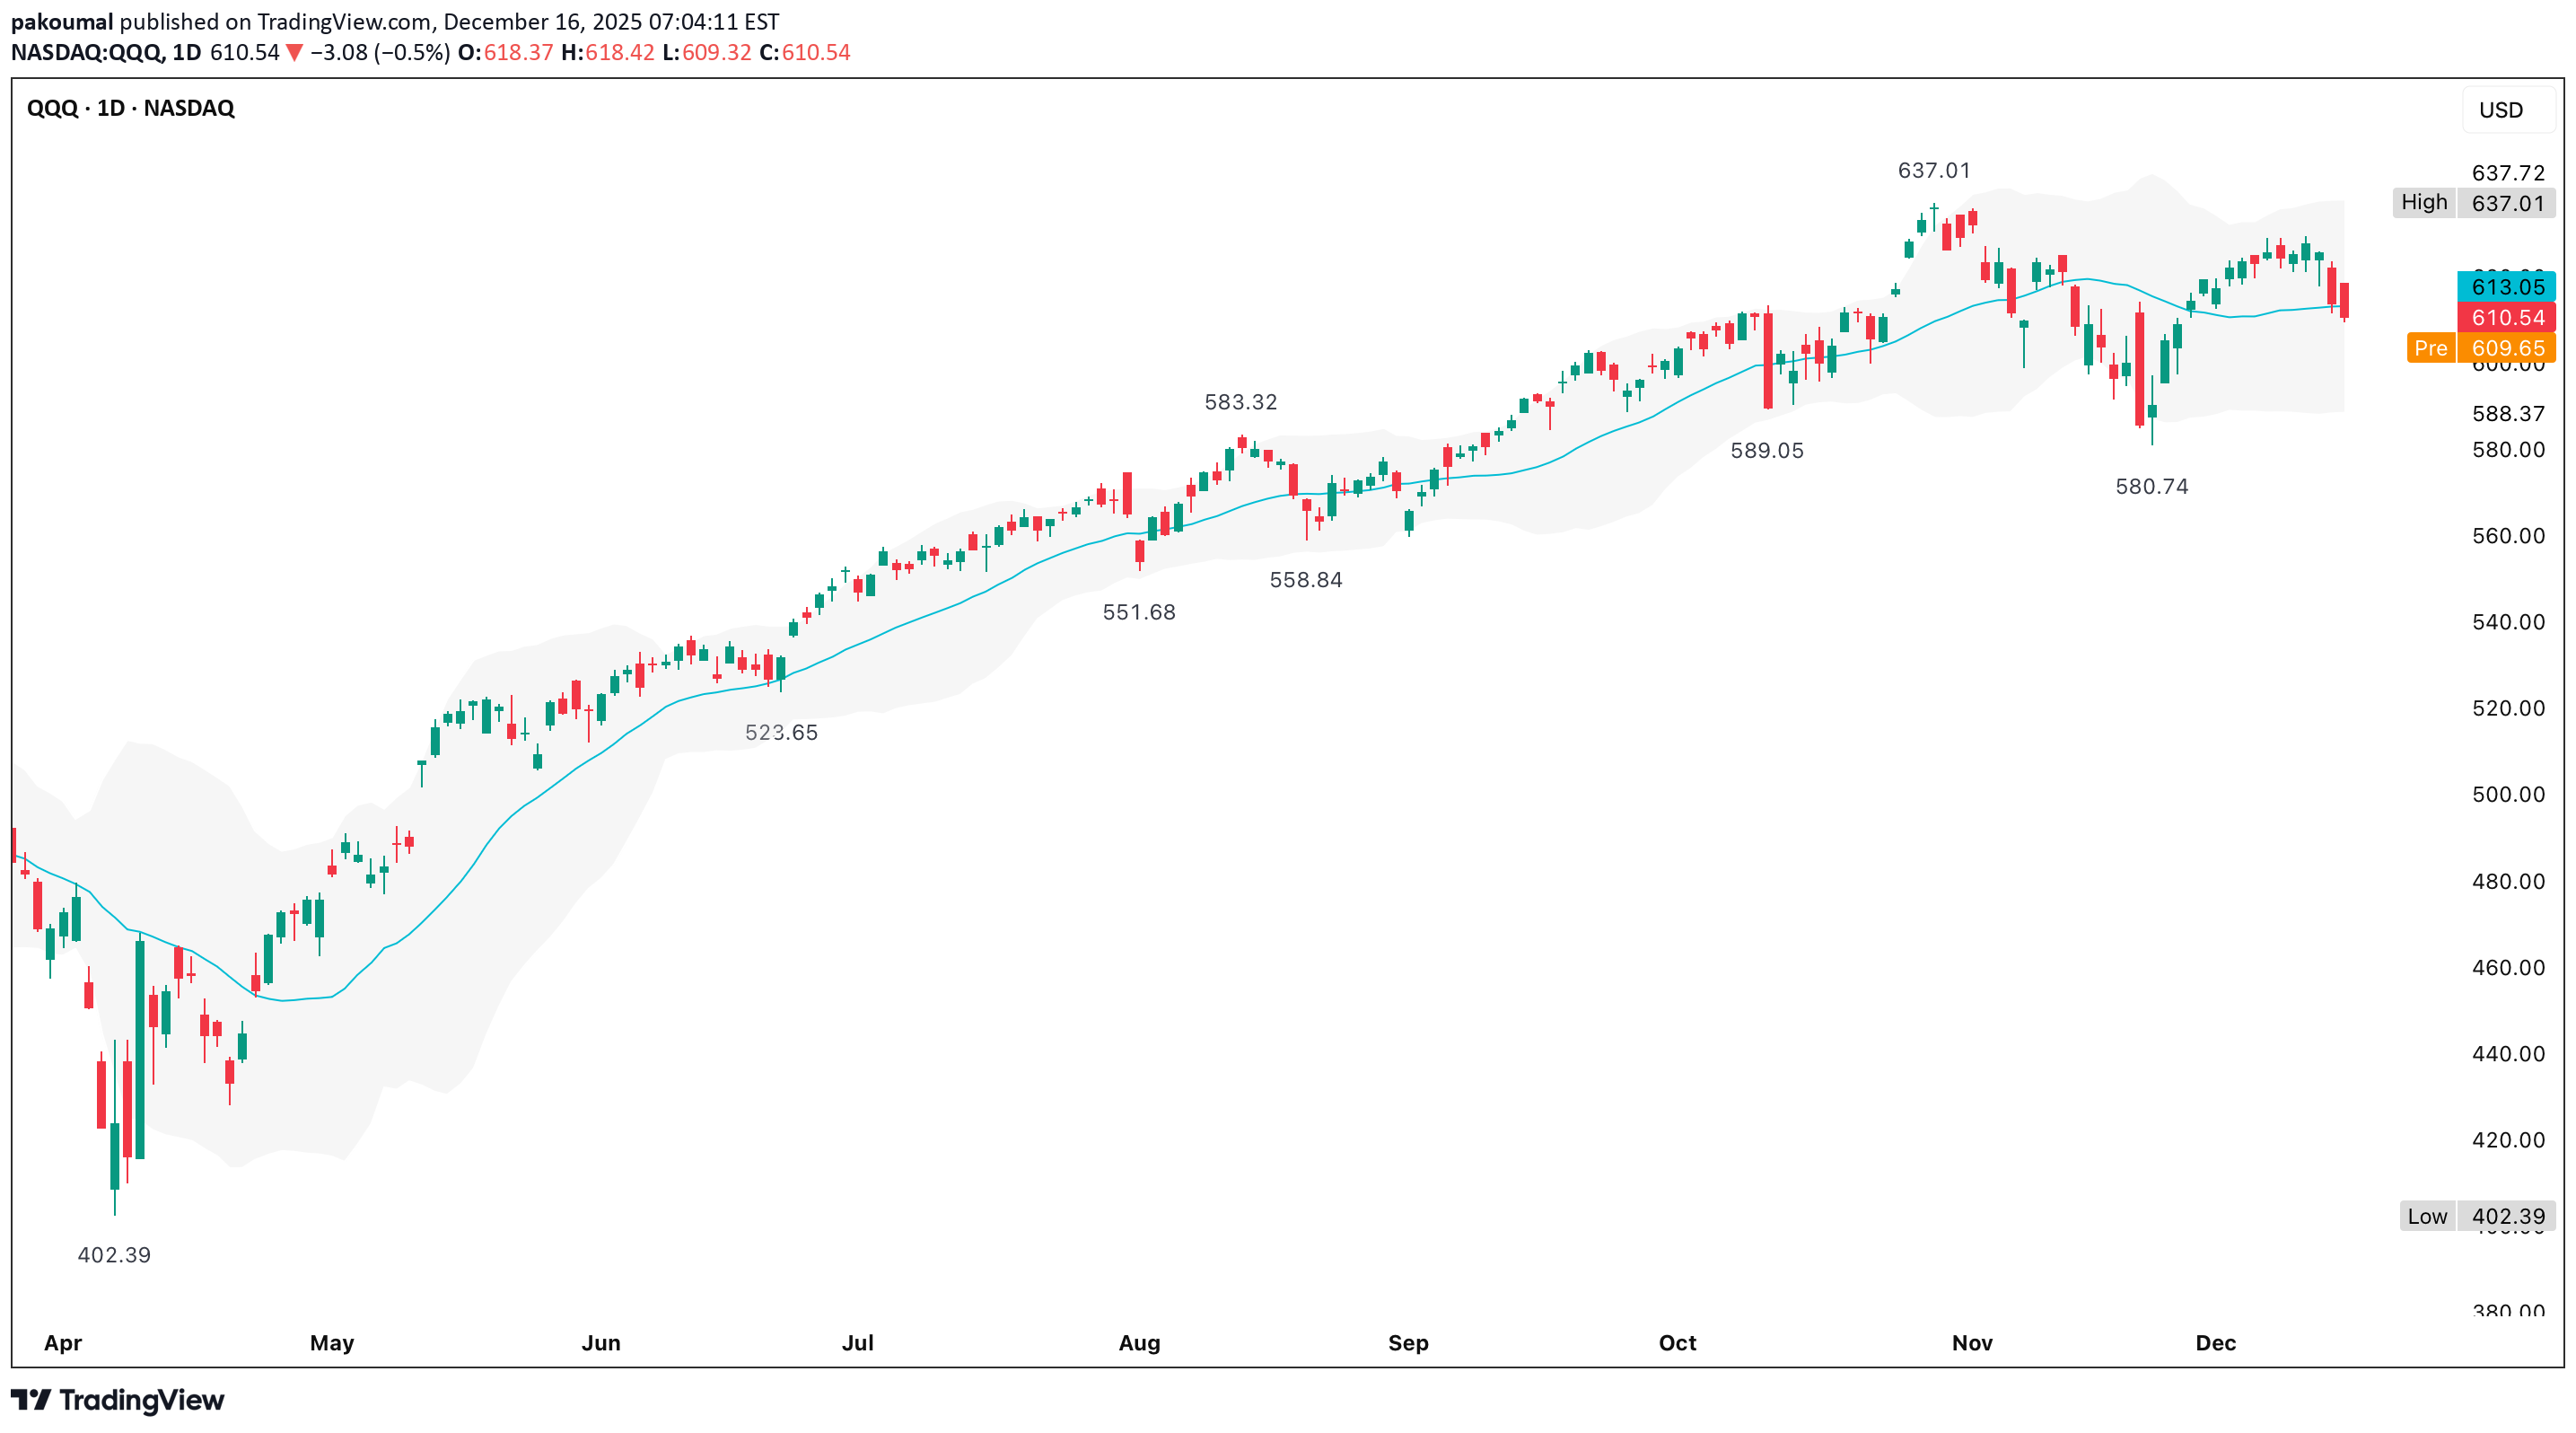
الاتجاه الأساسی صاعد (سلسلة واضحة من الارتفاعات الأعلى / الانخفاضات الأعلى منذ أدنى مستوى فی أبریل ~ 402 دولارًا) التوحید بالقرب من أعلى المستویات، ولیس الرفض ما یقرب من 600 دولار - 637 دولارًا على مدار الأسابیع الستة الماضیة تقریبًا لا یزال السعر فوق المتوسط المتحرک 20 یومًا الصاعد مع انحدار إیجابی یتم امتصاص عملیات التراجع فوق أدنى مستویات التأرجح السابقة، ولا یتم اختراقها ضاقت النطاقات مادیًا مقارنة بشهر أکتوبر ونوفمبر الضغط عند أعلى المستویات یفضل إحصائیا التوسع یعد هذا بمثابة توقف مؤقت للاتجاه، ولیس نمط القمة؛ ما لم ینکسر الهیکل طالما ظل سعر 600 دولار ثابتًا، فإن الروایات الهبوطیة سابقة لأوانها (یجب ألا یکون تحیزک الافتراضی هبوطیًا) 1. إذا أغلق السعر فوق 637 دولارًا تعامل معها على أنها استمرار للاتجاه توقع التوسع ولیس الطحن تفضل المشارکة فی الاختراق، ولیس التلاشی 2. إذا بقی السعر بین 600 دولار - 637 دولارًا السوق محاید/محدود النطاق تفضیل البیع المتمیز أو الحجم المخفض تجنب الإدانة الاتجاهیة 3. إذا أغلق السعر أقل من 600 دولار الاتجاه الصعودی متضرر هیکلیا التعرض الطویل یصبح تکتیکیًا، ولیس core توقع إعادة تعیین أعمق نحو 580 دولارًا إلى 550 دولارًا لا توجد فرضیة هبوطیة صالحة فوق 600 دولار لعب الاختراق (637 دولارًا +) الدخول عند الإغلاق الیومی> 637 دولارًا أمریکیًا مع سحب أول اختیاری إضافی بقیمة 630 دولارًا - 632 دولارًا أمریکیًا یحدث الإبطال عند إغلاق یومی أقل من 630 دولارًا هذه تجارة توسعیة متقلبة، ولیست إضافة بطیئة للاتجاه شراء التراجع (600 دولار - 615 دولار) الدخول فی یوم red إلى 600 دولار - 615 دولارًا تلیها شمعة یومیة صاعدة (ولیس الضجیج خلال الیوم) توقف عند إغلاق یومی <$600 = خروج، لا نقاش وهو یتماشى مع الاختراق السابق وارتفاع المتوسطات المتحرکة واستجابة الطلب السابقة (580.74 دولارًا) التحول الدفاعی (<600 دولار) تقلیل صافی الدلتا أضف تحوطًا هبوطیًا أو تعرضًا قصیر المدى توقع زیادة فی التقلبات وفشل متوسط الارتداد 1. فوق 637 دولارًا → اتجاهی فروق أسعار الخصم للمکالمات (30-60 DTE) تجنب المکالمات المجردة (مخاطر التوسعة الوریدیة تقطع کلا الاتجاهین) 2. داخل 600 دولار - 637 دولار → الدخل کوندور الحدید ضع فروق الائتمان فوق 600 دولار فقط 3. بالقرب من 600 دولار ← شراء غیر متماثل عملیات البیع المضمونة نقدًا (600 دولار أو 610 دولارات) تم تعیینه فی الدعم الهیکلی باعتباره أسوأ الحالات 4. أقل من 600 دولار → التأمین/التحوط وضع فروق الخصم تجنب بیع قسط الجانب السلبی اسأل نفسک فی نهایة کل أسبوع، هل أغلق QQQ أعلى أو أقل من 600 دولار؟ هل حقق ارتفاعًا أعلى أم انخفاضًا أعلى؟ هل لا یزال المتوسط المتحرک الیومی یرتفع؟ هل توسعت التقلبات أم تقلصت؟ تأتی میزتک من انتظار تحدید المستوى، ولیس من محاولة توقعه
QQQ (19 December)
طالما أن QQQ یحمل 612 دولارًا أمریکیًا، فإن المخاطر الهبوطیة تتلاشى والقبول فوق 618 دولارًا أمریکیًا یحول هذا من ارتداد إلى قاعدة تتشکل أدنى مستویاتها من ~ 600 دولار إلى ~ 612 دولارًا - 615 دولارًا یظل السعر أعلى من القیمة المستصلحة (612 دولارًا - 615 دولارًا) عبر الأطر الزمنیة وهذا یبطل سیناریو الانهیار الهبوطی الفوری مؤشر القوة النسبیة هو زخم استمراری صعودی، ولیس انعکاسًا متوسطًا یقع مؤشر ستوش فی منطقة ذروة الشراء على أطر زمنیة أقل، ولکنها لیست إشارة بیع ما لم یکسر السعر الدعم الزخم یدعم السعر، ولا یتباین ضده توسع الحجم عند الدفع عبر 612 دولارًا لا یوجد حجم بیع کبیر عند التوقف المؤقت یعد هذا شراءًا متحکمًا فیه، ولیس تغطیة صفقات البیع فقط، وهو ما یعزز قوة الارتداد 1. یعتبر 615 دولارًا أمریکیًا الآن دعمًا مهمًا ویجب أن یستمر فی التراجع إذا کان السعر ثابتًا عند 615 دولارًا، فإن السوق یقوم ببناء قاعدة 2. توقع سعر القطع عند 618 دولارًا - 620 دولارًا الرفض مهم فقط إذا انخفض السعر إلى أقل من 615 دولارًا 3.625 دولارًا إذا کسر سعر القبول 620 دولارًا، فمن المحتمل أن یتحرک السعر هنا بسرعة وهذا من شأنه أن یدعم بقوة استمرار الاتجاه الصعودی 4. خسارة 615 دولارًا أمریکیًا، ثم خسارة 612 دولارًا أمریکیًا (أو ما یعادلها بالعملة المحلیة) من شأنها أن تعید السعر إلى التوازن/القطع - وهذا لیس فشلًا فی الاتجاه بعد، ولکنه سیئ بالنسبة للمکالمات قصیرة الأجل وطالما ظل مستوى 615 دولارًا ثابتًا، فإن البقاء فی الاتجاه الصعودی له ما یبرره لقد تحول السوق من خطر فشل الارتداد إلى بناء قاعدة فقدت الدببة السیطرة عند 612 دولارًا یحتاج الثیران إلى 620 دولارًا أمریکیًا + لاستعادتها بالکامل الآن یتعلق الأمر بما إذا کان الزخم سیستمر بسرعة کافیة
QQQ Market Open Playbook
ولا یزال الهیکل المهیمن فی الفترة من تشرین الأول (أکتوبر) إلى تشرین الثانی (نوفمبر) صاعداً، ولکن من الواضح أن الزخم قد تراجع السعر الآن أدنى من VWAP الراسخ من أعلى مستوى فی نوفمبر ویحوم فوق VWAP مباشرة من أدنى مستوى فی نوفمبر لم تعد هذه منطقة تتبع الاتجاه إنه سلوک النطاق/التوزیع ما لم یتم استعادته بسرعة مؤشر القوة النسبیة ~ منتصف 50s یتدحرج للأسفل؛ مؤشر ستوکاستیک فی منطقة ذروة البیع ولا یزال یشیر إلى الانخفاض، لذا لم یتم استنفاد الضغط الهبوطی بعد یؤدی الفشل فی الاحتفاظ بحوالی 608 دولارًا - 610 دولارًا إلى فتح مستوى move نحو مستوى 580 - 585 دولارًا، وهو ما یتماشى مع الطلب السابق یعتبر الانحیاز (4H) محایدًا إلى هبوطی ما لم یتم استعادة VWAP (الارتفاع) والاحتفاظ به انهیار الوتد الصاعد نظیف ومؤکد فشلت إعادة الاختبار بعد الاستراحة بالقرب من 615 دولارًا - 618 دولارًا السعر أقل من کل من VWAPs الراسخة ویعمل الآن VWAP (المرتفع) کمقاومة زاد ضغط البیع عند الانهیار، لکن المتابعة کانت منظمة، ولیست مذعورة، مما یشیر إلى التوزیع الخاضع للرقابة، ولیس الاستسلام مؤشر القوة النسبیة (RSI) منتصف 30 s ویتجه نحو الأسفل؛ مؤشر ستوکاستیک مثبت عند مستوى منخفض لذا لا یوجد تباعد صعودی یعد التحیز (ساعة واحدة) استمرارًا هبوطیًا ما لم یستعید السعر ما بین 613 دولارًا إلى 615 دولارًا مع حجم التداول فارق بسیط مهم هو أن الأوتاد الهابطة لا تحل الاتجاه الصعودی إلا إذا کسرت مع التوسع وفی الوقت الحالی، لا یتوسع حجم التداول بشکل ملموس محاولة القاع المزدوج ضعیفة من الناحیة الهیکلیة والقاع الثانی یفتقر إلى تأکید انحراف الزخم یتقطع السعر تحت VWAP (مرتفع)، مما یحد من المحاولات الصعودیة 1. صعودی (احتمال أقل فی الوقت الحالی) عقد 608 دولار - 610 دولار کسر وعقد> 612 دولارًا الهدف 615 دولارًا - 618 دولارًا (VWAP (مرتفع) + العرض المسبق) 2. هبوطی (الحالة الأساسیة) خسارة 608 دولارًا قبول سریع أقل من 602 دولارًا، ثم 595 دولارًا، مع 580 دولارًا - 585 دولارًا کهدف الأربع ساعات الأکبر سأعید تقییم التحیز الهبوطی فی حالة حدوث أی مما یلی، استعد واحتفظ بـ VWAP الراسخ من أعلى مستوى فی نوفمبر یستعید مؤشر القوة النسبیة لساعة واحدة اختراقًا >50 و15m مع توسع واضح فی الحجم حتى ذلک الحین، تبدو المسیرات قابلة للبیع، ولیست قابلة للمطاردة یقع سعر Premarket بسعر 608.50 دولارًا تقریبًا على مستوى القرار، ولیس دعمًا یمکنک الوثوق به بشکل أعمى 1. الاستمراریة الهبوطیة (الحالة الأساسیة) الإعداد القصیر (مفضل) السعر أقل من کل من VWAPs الراسخة، وانهیار الوتد بعد الارتفاع، والزخم الضعیف دخول 612 دولار - 615 دولار VWAP (مرتفع) + رف الانهیار المسبق الدخول المثالی هو الرفض ولیس القوة توقف (بطلان) > 618.50 دولارًا (15m إغلاق) فوق VWAP (عالی) + الهیکل أی شیء أعلاه هنا ینفی الهیکل الهبوطی الأهداف 608 دولارًا - النطاق منخفض 602 دولار - 600 دولار - سیولة خلال الیوم 585 دولارًا - 580 دولارًا - هدف الأربع ساعات، VWAP الراسخ (منخفض) + الطلب المسبق ما یجب أن یکون صحیحا المسیرات متداخلة ومنخفضة الحجم یستمر VWAP(عالیة) فی الرفض فشل مؤشر القوة النسبیة فی استعادة 50 على الساعة الواحدة 2. الاتجاه المعاکس الطویل (فقط فی حالة تفعیل الظروف) الإعداد الطویل (تجارة رد الفعل، ولیس الاتجاه) الدخول بعقد یتراوح بین 608 دولارًا و610 دولارًا بعد التأکید 15m >612 دولارًا توسیع الحجم عند الاختراق لم یمض وقت طویل إذا لم تحدث هذه الأشیاء الثلاثة توقف <607.80 دولارًا Hard توقف؛ لا تسامح الأهداف 615.80 دولارًا - 618.00 دولارًا (VWAP (مرتفع) / العرض) 620 دولارًا - 622 دولارًا فقط إذا کان القبول أعلى من VWAP (مرتفع) یعد هذا الشراء بمثابة انعکاس متوسط فقط، لذا لا تفترض استمرار الاتجاه ما لم یقبل السعر أعلى من 618 دولارًا 3. الإطار الزمنی المرتفع (الأکثر أهمیة) 608.00 دولارًا الثبات فوق = النطاق لا یزال على قید الحیاة الخسارة والقبول أدناه = تسارع الهبوط إذا رأیت سریعًا move أقل من 608 دولارًا أمریکیًا، وفشلت فی الاسترداد خلال 1-2 شمعة (15m)، فهذا استمرار، ولیس خداعًا 1. المحاذاة الهبوطیة مؤشر القوة النسبیة لساعة واحدة <45 VWAP (عالیة) النفقات العامة 15m یرتد مع انخفاض حجم التداول 2. التحول الصعودی (یتطلب التأکید) مؤشر القوة النسبیة لساعة واحدة >50 تمت استعادة VWAP (عالیة) وعقدها 15m اختراق مع حجم> المتوسط السابق لا یوجد اختلاف = لا التخمین
QQQ Santa Rotation?
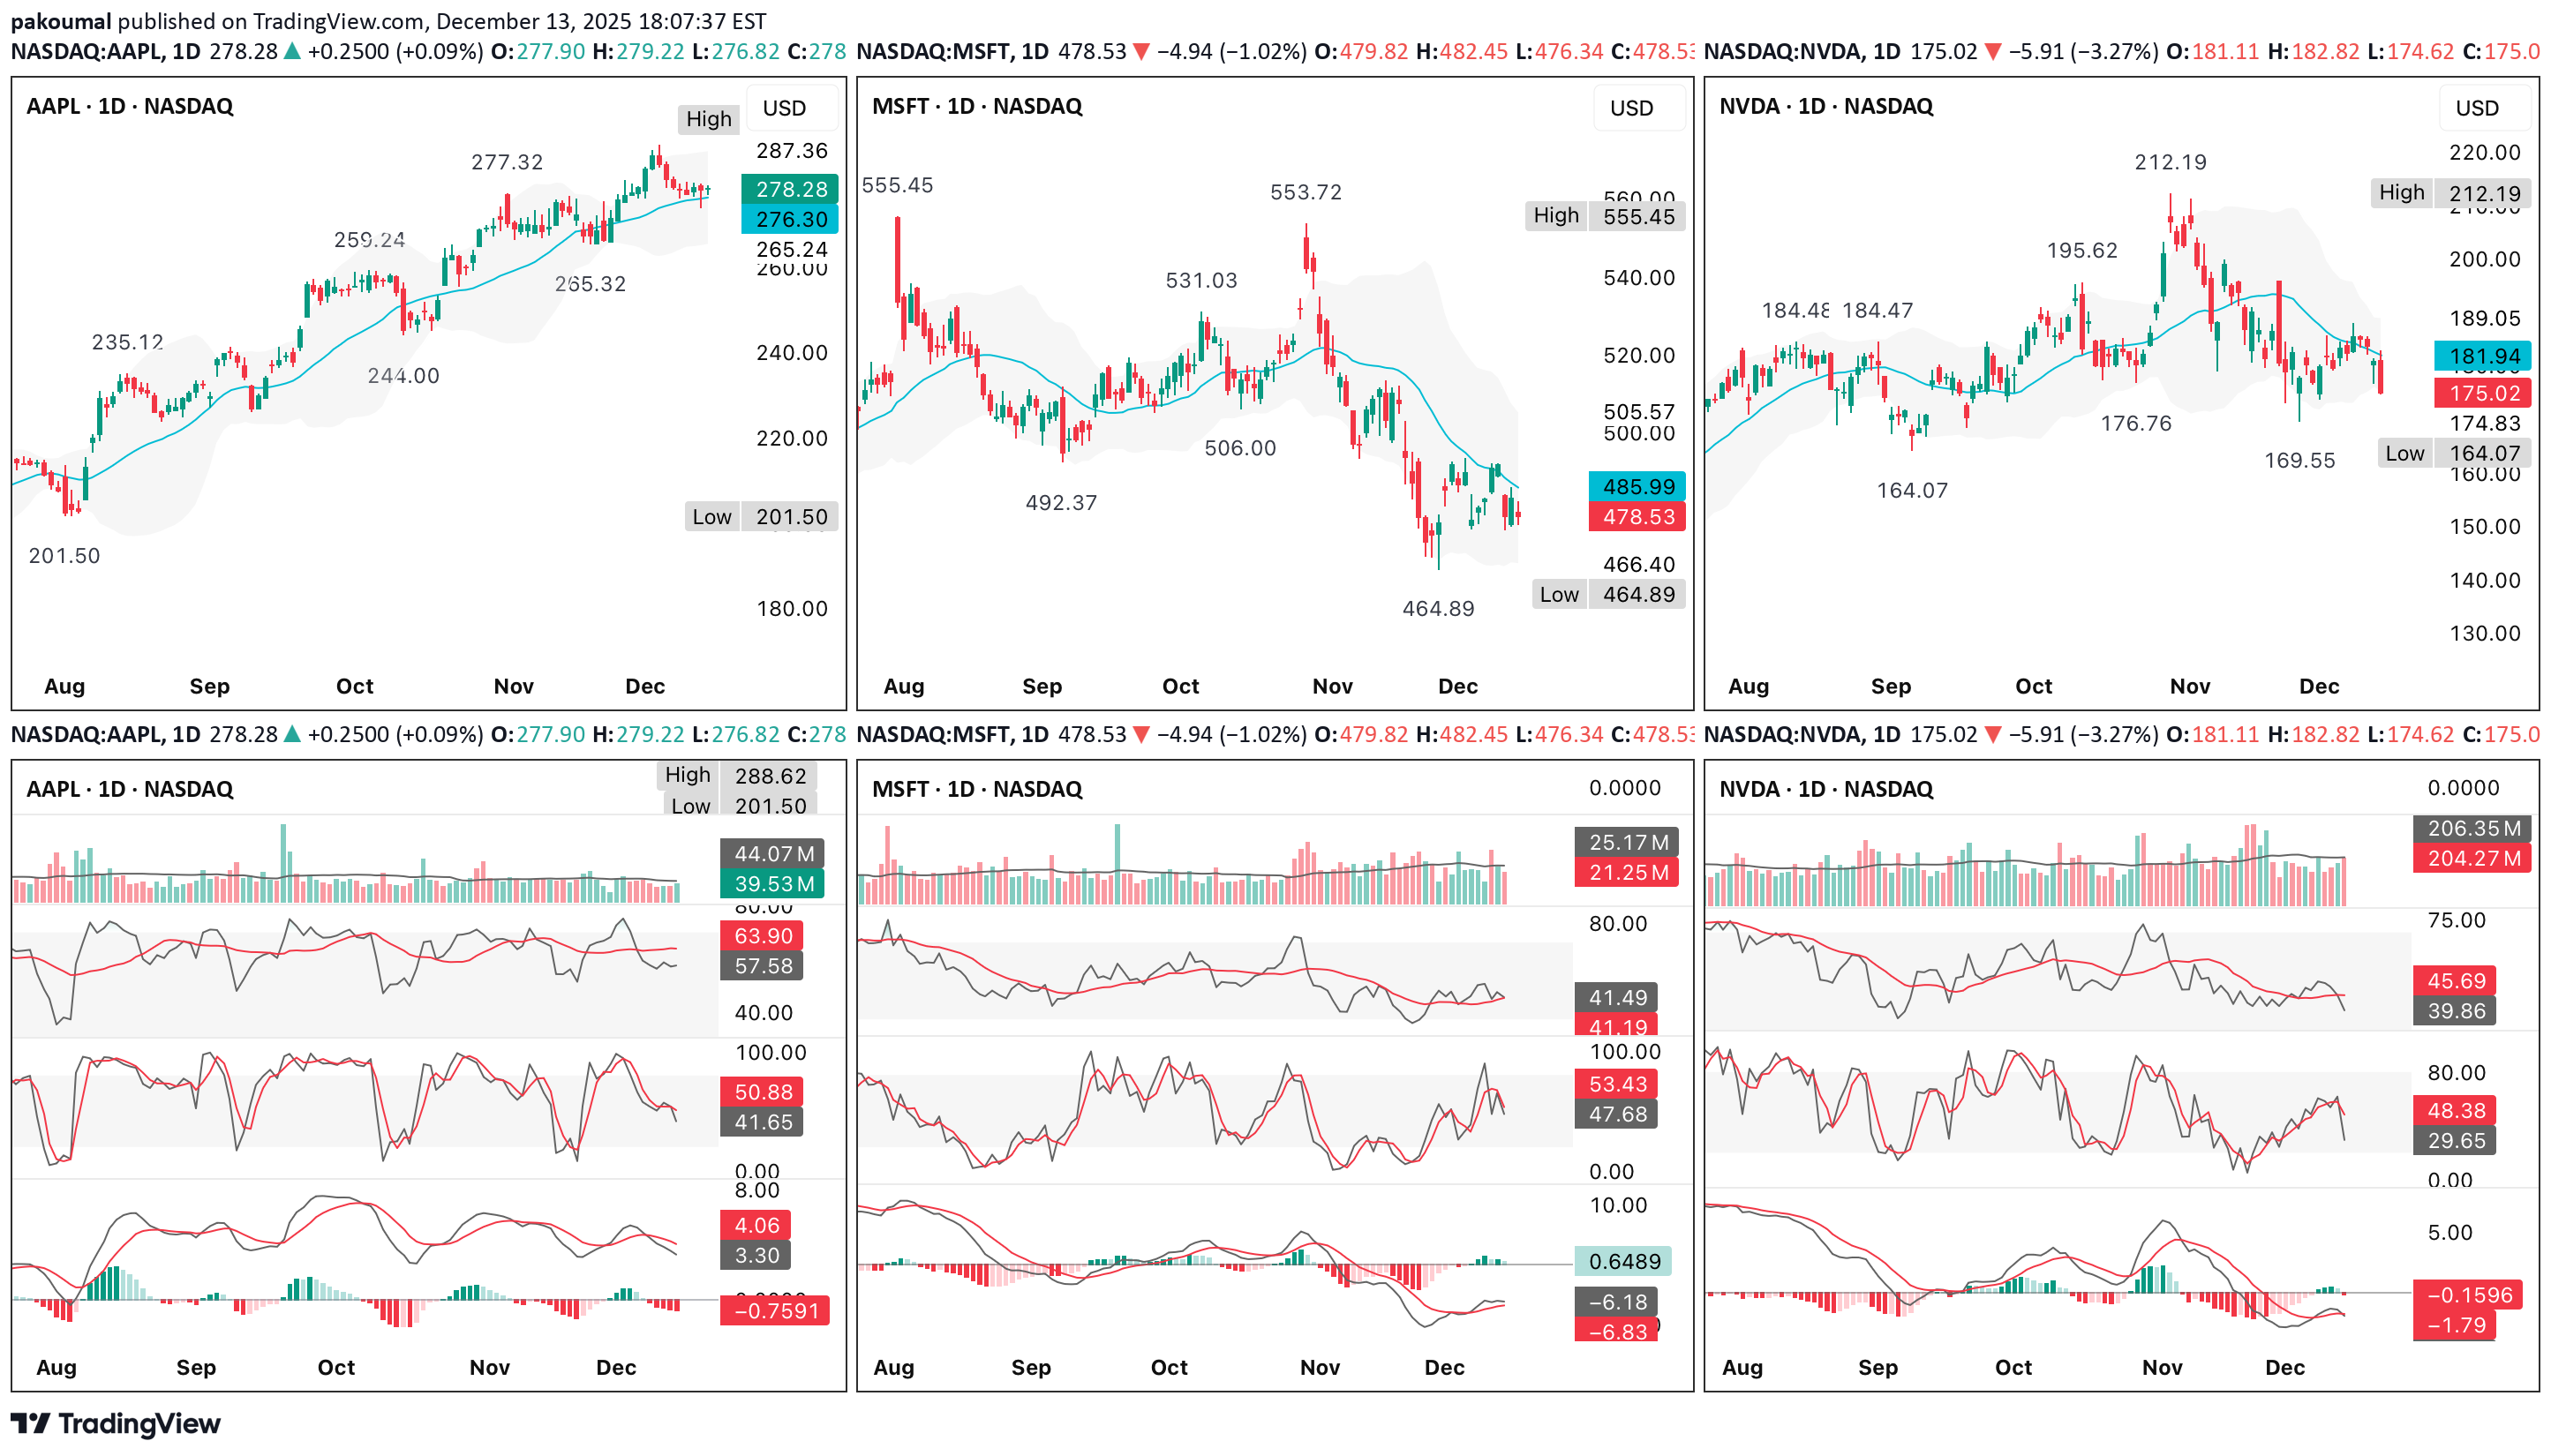
A look at the component charts lines up very cleanly with the broader QQQ direction into 2026 I am deliberately skeptical & weighting what usually leads, not what feels bullish/bearish emotionally 1. Clear leadership split or still acting well/potential leaders AAPL Above rising short-term MA, shallow pullback, no real momentum damage RSI mid–upper range, MACD only mildly negative This is not distribution behavior GOOGL Trend intact, pullback to rising MA, RSI still elevated Looks like digestion, not a trend break TSLA Relative strength standout Higher lows, bullish stochastic reset, MACD turning up This is classic “risk appetite not gone” behavior These names usually don’t hold up if a real index leg down is imminent 2. Neutral/repair mode AMZN Choppy range, sitting near mid-range support Momentum soft, but not breaking down META Sharp correction already occurred Now basing above recent lows; momentum trying to stabilize Damage done, but selling pressure clearly slowing These look more like already paid the price, not just starting to fall 3. Clear weak links NVDA Lower highs, weak bounce attempts, RSI sub-50 This is the most important chart psychologically MSFT Clean breakdown from November high Momentum still negative, rallies sold AVGO Earnings gap down with volume This is real distribution, not noise NFLX Continued downtrend, no strong reclaim yet These are dragging QQQ, but note that most of this damage is already visible, not hidden Breadth signals suggest that this is not a panic tape Across almost all charts RSI mostly 40-55, not 30s, stochastics cycling, not pinned & MACD negative but flattening, not accelerating, so this is controlled rotation, not liquidation If this were setting up a fast move to QQQ ~$590 immediately, you’d expect more RSIs < 35, more impulsive downside candles, & failed bounces across all mega-cap leaders This implies for QQQ that the most probable path (highest odds) is a bounce first, then decision Weak semis + MSFT = cap on upside AAPL/GOOGL/TSLA = downside protection That argues for a reflex rally (likely into $620-$625 area on QQQ) Followed by stall/compression, not instant ATHs Then a test of either higher low → Santa continuation or rollover to the $590s later A lower-probability, but valid alternative is if NVDA loses its recent lows decisively & AAPL breaks its rising MA Then the market probably hasn’t finished the reset That’s when the $590s become much more likely Right now, that confirmation is not present Forget narratives - these are the objective tells 1. Does NVDA fail another bounce under its 20-50d MA? If yes → drag continues 2. Does AAPL hold its rising MA on any dip? If yes → index downside limited 3. Does TSLA continue to make higher lows? Risk appetite intact if it does 4. Does AVGO stabilize instead of cascading? Big for semis sentiment If 2 of those 4 fail simultaneously, odds shift toward deeper downside If 3 of 4 hold, Santa odds rise materially This looks like a rotation-driven reset, not a market that’s done yet, but also not one about to collapse A bounce into mid/late December is the statistically cleaner path from these charts The real question is whether that bounce builds structure or fails quickly Market wants to rally, but breadth is questionable & that regime typically resolves 1 of 2 ways “Rotation Santa” (index grinds up even as laggards stay laggards) “Breadth rug pull” (leaders finally roll & index drops fast) If you get 3+ of these, odds tilt toward Santa succeeding even with semis weak & QQQ holds the prior swing low on the daily (no lower-low close) AAPL/GOOGL remain above their rising short-term trend (20ish day look) VIX is not making higher highs during down days (complacency returning) Down days are smaller-range than the earlier selloff (volatility compression) New lows list is not expanding while price chops (internal stabilization) If instead you get QQQ makes a lower-low close, AAPL breaks trend & fails the reclaim within 1-2 sessions & semis keep making fresh lows, then the “bounce to ~$620-$625 fade” becomes the base case & $590s stays in play You’re looking for structure + absorption, not fireworks into 23-27 December Higher low(s) on the 1H/4H while daily holds support Inside-day or breakout (tight range resolves up) Closes near the high of day on at least 2 of those sessions Up days on average/low volume is fine (holiday), but down days must be low volume too (no distribution) Leadership breadth improves slightly & you don’t need semis to lead, you just need fewer new breakdowns RSI on QQQ stabilizes above ~45-50 & slopes up MACD histogram stops getting more negative (flattening is enough) If you see that, the “Santa can start” signal is basically reset done = volatility compresses + leaders stop breaking + QQQ holds the low 23-27 December tells of what a failed Santa attempt looks like - this is the “looks fine… until it doesn’t” pattern Gap up/early strength gets sold & closes mid-to-low range (2+ times) Failure at a key reclaim level (prior breakdown level or VWAP zone) within 24-48 hours One big trend day down that breaks the range (holiday weeks hate that & if it happens, it’s meaningful) Semis continue to make new lows & it starts pulling down the “strong ones” (AAPL breaks trend, GOOGL loses MA, etc) Breadth worsens while index is flat/up (classic divergence) If that happens, the most common path is quick rejection from the bounce zone (~$620-$625 area), then a liquidation leg toward the next major support (~$590) The 3 “reset is done” triggers that I actually use QQQ higher low + reclaim of the prior day’s VWAP/anchored VWAP AAPL doesn't lose its rising trend on a closing basis (or loses/reclaims within 1 day) NVDA stops making lower lows (it can stay weak, but it just can’t keep accelerating down) QQQ AAPL AMZN AVGO GOOGL META MSFT NFLX NVDA TSLA
QQQ (12 December)
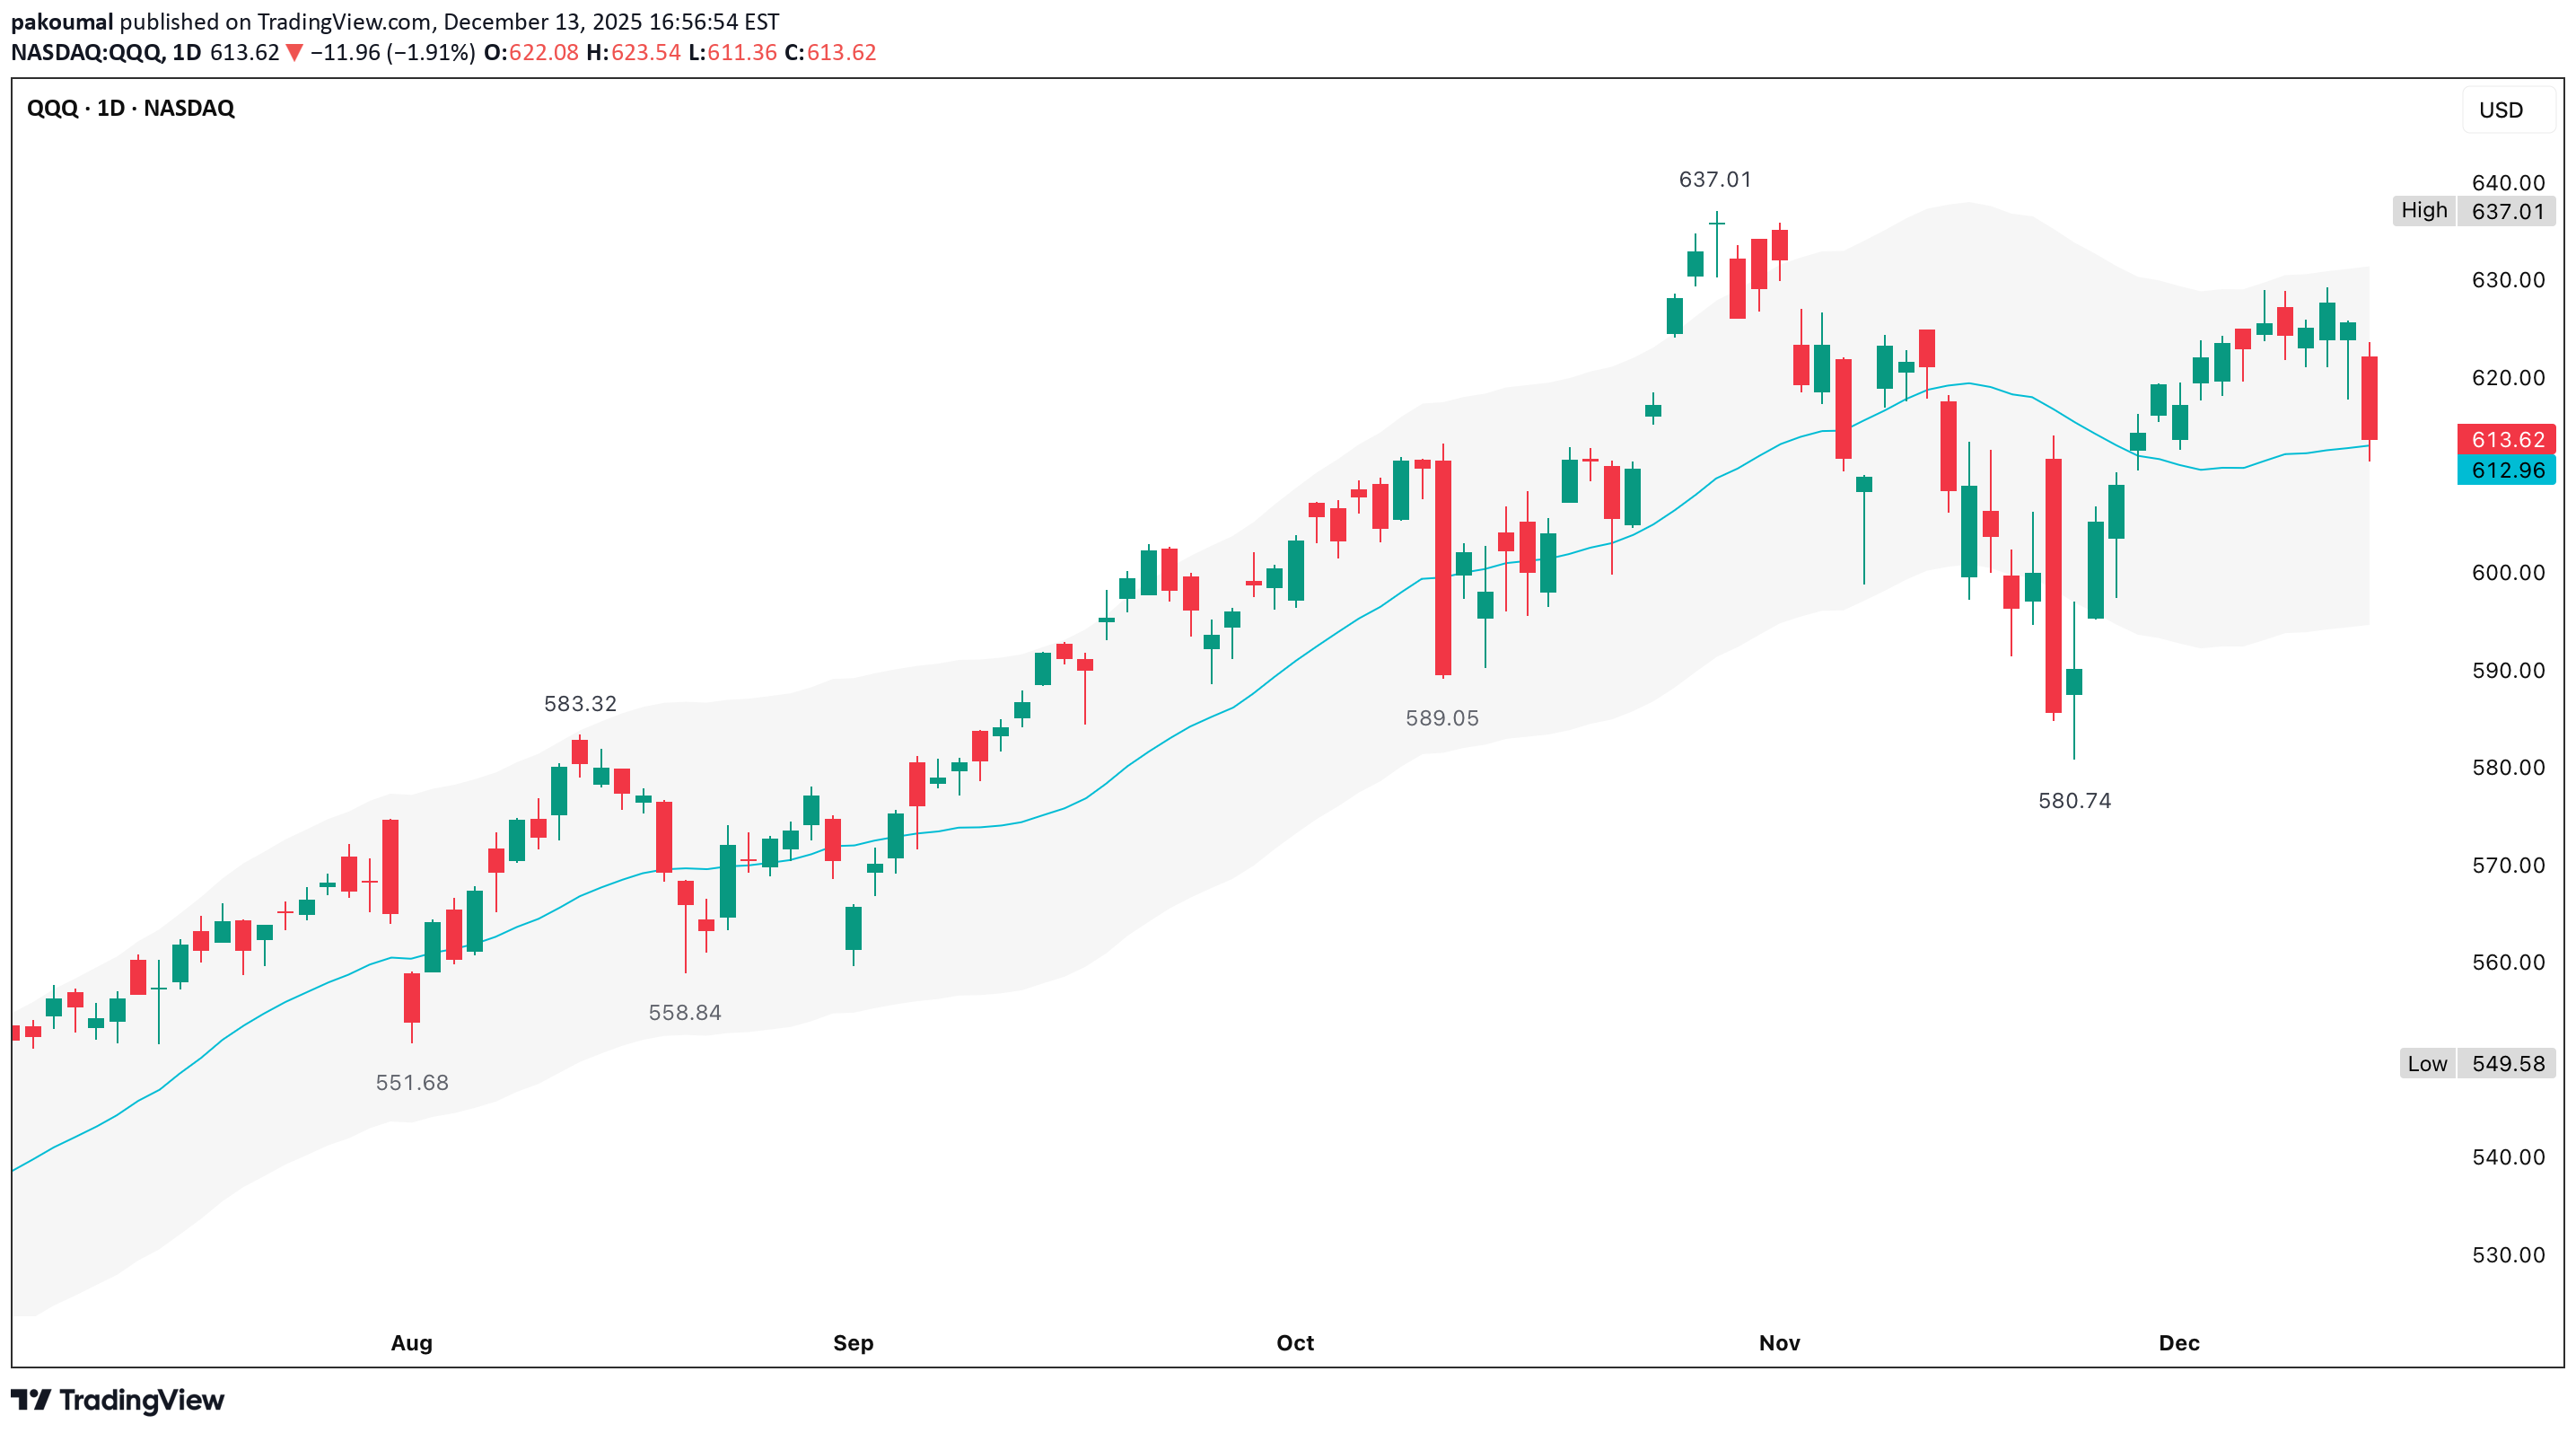
A ±3% envelope around the 20d MA does 3 important things 1. Upper band Marks short-term trend extension Rallies that fail from here often lead to multi-week digestion 2. 20d MA Control line for short-term trend Chop around it = balance, not resolution 3. Lower band (~-3%) Where momentum resets actually complete Where successful Santa rallies most often launch Price is slightly below the 20d MA & still well above the −3% band Recent selloffs have tagged the 20d MA, but not the lower band & that tells us that the reset is in progress, but not finished When Santa rallies succeed, price either 1) touches or briefly pierces the −3% band, then reclaims the 20d MA OR 2) spends enough time between midline & lower band that volatility collapses The key is whether sellers are forced to exhaust themselves & that exhaustion point lines up with ~$590-$600 The cleanest sequence for a high-quality Santa set-up is that price drifts/flushes into the −3% band & we see long lower wicks, smaller red bodies, failed follow-through on down days & price reclaims the 20d MA since Santa rally starts from inside value, not above it This leads to grind higher quietly, carry into early January & avoid sharp January reversals A weak or fake Santa rally happens when price never touches the −3% band Rallies start from above the 20d MA, upper band is hit quickly & momentum rolls again in early January The chart still argues for at least one push toward the lower band (~$590s) before a durable Santa rally - not because Santa can’t happen without it, but because momentum has not been fully neutralized & the market hasn’t forced capitulation from late longs Santa-ready = price has touched the −3% band & reclaimed the 20d MA Not Santa-ready = price still oscillating above the lower band This ±3% / 20d MA view confirms everything from the weekly MACD It visually explains why $590-$600 keeps showing up Santa rallies that start after a lower-band test are stronger & last longer Santa rallies that start before it are more fragile The weekly MACD is saying that momentum is rolling, not reversing & in strong bull markets, this exact MACD behavior typically resolves via price moving sideways-to-down until momentum resets & the trend continues - not how a major top appears The MACD is not deeply negative which argues against panic-style selling, but it does demand time or price, or both The weekly MACD does not resolve with a quick bounce to $625, or a shallow 2-3% dip It usually resolves with a 5-8% pullback, or several weeks of chop From the ~$637 high 5% ≈ $605 6-7% ≈ $595 to 590 Which lines up exactly with weekly 20 MA & prior breakout structure Structure strongly favors price visiting ~$590 since that actually resets momentum The weekly trend is bullish & weekly momentum is resetting Daily structure is corrective, 4H AVWAPs suggest balance & the 1H wedge pattern is a short-term pressure When all of those align, the most common resolution is drift/chop to a test of $590-$600, consolidate a base & rally A $620-$625 bounce can still happen inside that process, but it’s secondary, not required Test $590s, then base ~55% (base case) Chop $600-$620, no resolution ~25% ATHs without touching $590 ~15% Sharp breakdown below $580 ~5% The weekly MACD confirms a reset is underway & that reset most cleanly completes near $590-$600 A $620-$625 bounce is optional, not necessary Any move into $590-$600 that holds weekly structure is bullish, not bearish The higher-probability outcome is a test of the $590s before any Santa-rally-style push to new highs Historically, QQQ does not print new ATHs while weekly momentum is actively resetting since that reset almost always completes before the seasonal tailwind expresses itself So if there is a Santa rally, it’s far more likely to start from lower prices, not launch from mid-reset levels A move into the $590s completes a 5-7% pullback, resets weekly momentum cleanly, flushes late longs & sets up positioning for a late-December/early-January run This sequence aligns perfectly with typical late-year behavior Santa rallies that actually stick, not fail Markets prefer to rally from fear, not from complacency The one thing that would flip this quickly is if & only if price closes on the daily above $625, followed by strong acceptance Seasonality is subordinate to structure The market is resetting, not breaking Santa rally odds improve after a dip, not before $590s before ATHs is the cleaner, more durable path Any dip into the $590s that holds weekly structure is bullish fuel, not danger This SMH/QQQ ratio chart is the missing piece & it materially tilts the odds toward the base case The ratio is still in a clear uptrend, it's above its rising MA, so long-term structure is higher highs, higher lows, which means semiconductors are still outperforming QQQ on a medium-term basis, so despite the AVGO-driven selloff, leadership has not broken & that matters a lot The pullback is a mean-reversion, not a regime change In strong markets, relative strength pulls back to the MA, then either consolidates & resumes higher, or rolls over decisively (which has not happened) Semis are ~40% of QQQ’s momentum contribution QQQ rarely makes a sustained leg lower without semis underperforming The ratio holding implies any QQQ downside is corrective & not the start of a broader drawdown That supports bounce attempts, shallow-to-moderate retraces & defense of higher MAs (50d & 100d MA) This slightly changes the probability weights in my opinion vs a $590 test as highest single outcome Bounce to $620-$625, stall ~45% Bounce & range $615-$630 (no immediate $590) ~25% Breakdown to $590 test ~20% Breakout & reclaim $632+ ~10% So $590 is still very much in play, but it is less inevitable than it looked without the ratio & this is exactly why relative strength matters The $590 test would be much more likely if SMH/QQQ closes below its MA & then fails to reclaim it within ~3-5 sessions If that happens semis stop leading & QQQ likely seeks the 100d MA (~$590-$596) If ratio stabilizes and turns up, QQQ holds above $610, then the $625 test becomes constructive, not corrective I believe this ratio shows that the cause (profit-taking) is validated, the damage is contained & that the sequence still favors bounce, consolidation/decision & either delayed ATHs or a shallow reset What it argues against is an immediate waterfall to $590 The SMH/QQQ ratio says leadership is intact That reduces (does not eliminate) the odds of an immediate $590 flush A bounce toward $620-$625 is now even more likely The next decision happens at $625, not $590; unless, semis lose relative strength CPI & NFP next week are much more likely to affect intraday volatility than weekly direction since they are unlikely to invalidate the $590-$600 reset thesis unless the data meaningfully re-prices the rate path, which Powell explicitly tried to prevent so treat CPI/NFP days as liquidity events & not trend confirmation days Powell effectively said Don’t overreact to individual prints - policy is about the trend Watch where price closes, not the spike If the market uses data to explore lower value & then fails to continue, that’s bullish If it uses data to bounce, but cannot reclaim key levels, the reset continues The data does not replace the technical process - it only colors it
QQQ Implied Move Range
QQQ's implied expected move is calculated using the current option chain to find the ATM straddle (cost of ATM call + ATM put for nearest expiry) Expected Move (≈ 1σ) ≈ $0.85 × (ATM Straddle Premium) The result gives a one-standard-deviation range (≈ 68% probability) for the underlying’s move over the option’s life For a short horizon (“by tomorrow”), pick the front-month (or nearest-term) options that expire soon & use their straddle; alternatively, use annualized implied volatility (IV) converted to daily/weekly via the standard volatility-scaling formula Move = S × IV × SQRTΔ t /365 Where S = underlying price & Δ t = number of days to expiry This yields a symmetric “+/-” band, but it does not forecast direction - only the magnitude (volatility expectation) The front-month or nearest options typically price in a short-term move of roughly +/-1% to +/-1.5% around the current price, ~$625, which suggests a likely trading range for tomorrow of roughly $618 to $634 (-1% to +1.5%) The implied move is derived from option-markets’ aggregated expectations - it doesn’t tell you direction Actual price can & often does, break outside the straddle-implied band; especially, if there's a surprise (Fed tone, macro data, headlines) The implied move reflects volatility pricing If implied volatility collapses (after the event), realized moves may be smaller If IV remains elevated or rises, moves may exceed the band The “+/-1%-1.5%” range is a typical result for front-month options under normal volatility In a “event week” (like FOMC), implied volatility can be distorted, meaning the real move could be larger, or the band may understate risk Use the $618-$634 band as a “probability envelope” Markets seem to expect QQQ to stay somewhere in that range under “normal” conditions If you expect a dovish surprise - the upper half (near $629-$634) is reasonable If you expect a hawkish or cautious tone - then the lower half (near $620–$618) is better If you expect a major surprise or risk-off - plan for possible breakouts beyond that band (to either side) 1. FOMC 27 July 2022 QQQ closed @ $306.81 the day before FOMC 1 day close was $309.81 3 day close was $315.27 Actual 1 day move was +0.98% Actual 3 day move was +2.76% The 1 day move stayed within the typical implied move (~+/-1-1.5%) The 3 day move exceeded the common expected-move envelope (~+/-2-3%), driven by a surprise dovish tone 2. FOMC 14 December 2022 QQQ closed @ $297.50 the day before FOMC day close was $285.94 3 day close was $268.60 Actual 1 day move was -3.9% Actual 3 day move was -9.7% This massively exceeded the typical implied move band Implied range around that meeting was ~+/-1.5-2% & the realized move was far greater Powell pushed back on easing conditions 3. FOMC 22 March 2023 QQQ closed @ $305.00 the day before FOMC 1 day close was $309.42 3 day close was $315.57 Actual 1 day move was +1.45% Actual 3 day move was +3.47% The 1 day move landed right inside the expected band The 3 day move pushed to the upper edge or slightly beyond the common ~+/-3% implied envelope A mild dovish shift + banking-crisis risk-off reversal supported tech 1. QQQ usually stays within the implied move on Day 1 Roughly +/-1–1.5% is historically typical Breaks above +/-2% tend to occur only on strong surprises 2. QQQ frequently breaks the implied move by Day 3-5 The 3-5 day window often includes volatility expansion, trend continuation if the Fed surprises & mean-reversion if the first move was emotional 3. Surprises create the largest deviations Hawkish surprises are the biggest downside breaches (December 2022) Dovish surprises are sizable upside breaches (July 2022) 4. Base-case FOMC outcomes generally stay within the implied band Typical outcomes settle into the +/-1-1.5% Day 1 move, but still tend to fade over 3-5 days Around 70-80% of the time, QQQ stays within a “1σ” band after FOMC 20-30% of the time, it breaks out with a big move (usually driven by a surprise) The 3 day window is actually slightly more prone to exceed the band than 1 day or 5 day This suggests that 3-5 sessions after FOMC is where the real repricing happens 🕊️ Dovish Day 1 +0.5% to +1.5% Day 3 +1% to +3% if the narrative sticks Day 5 some giveback is common = net +0.5% to +2% 🧸 Base Case (“hawkish cut”/cautious) Day 1 –0.5% to +0.5% (within 1σ band) Day 3 drift –0.5% to –1.5% Day 5 further mild weakness = total -1% to -2.5% 🦅 Hawkish Day 1 -1% to -2.5% (near or beyond 1σ band) Day 3 -2% to -4% total Day 5 is either stabilization or a small overshoot lower = –3% to –5% total in a stronger shock Something like the base-case band happens ~70-80% of the time A true “shock” move (outside band, +/-3–5%) occurs roughly 1 in 4 to 1 in 5 meetings Directionally, given current positioning yield re-steepening + QQQ’s extension, I’d assign higher odds of a base or mildly hawkish outcome, so statistically, the 3-5 day fade is still my default The 3-5 session window is where the bigger, more directional, macro-driven moves happen In the current macro setup, the bias is toward the base/mildly hawkish path, which historically lines up with a contained Day 1 move, then a drift lower over the following 3-5 sessions +/-1.5% (1 day) Upside $625 × 1.015 ≈ $634 Downside $625 × 0.985 ≈ $616 +/-3% (bigger, 3-5 day) Upside $625 × 1.03 ≈ $644 Downside $625 × 0.97 ≈ $606 +/-5% (shock/tail scenario) Upside $625 × 1.05 ≈ $656 Downside $625 × 0.95 ≈ $594 1. If we close >$634, it nudges into “strong dovish” territory & day 3-5, holding above $625-$630 keeps the “wave 5 extension” idea alive; even then, a later retest of $620-$625 is typical behavior 2. A drift toward $608-$615 lines up with historical negative median returns & if QQQ breaks below ~$615 & closes there on Day 3-5, odds increase that we’re in bigger corrective territory, not just a quick shakeout
QQQ End of a Corrective Bounce?
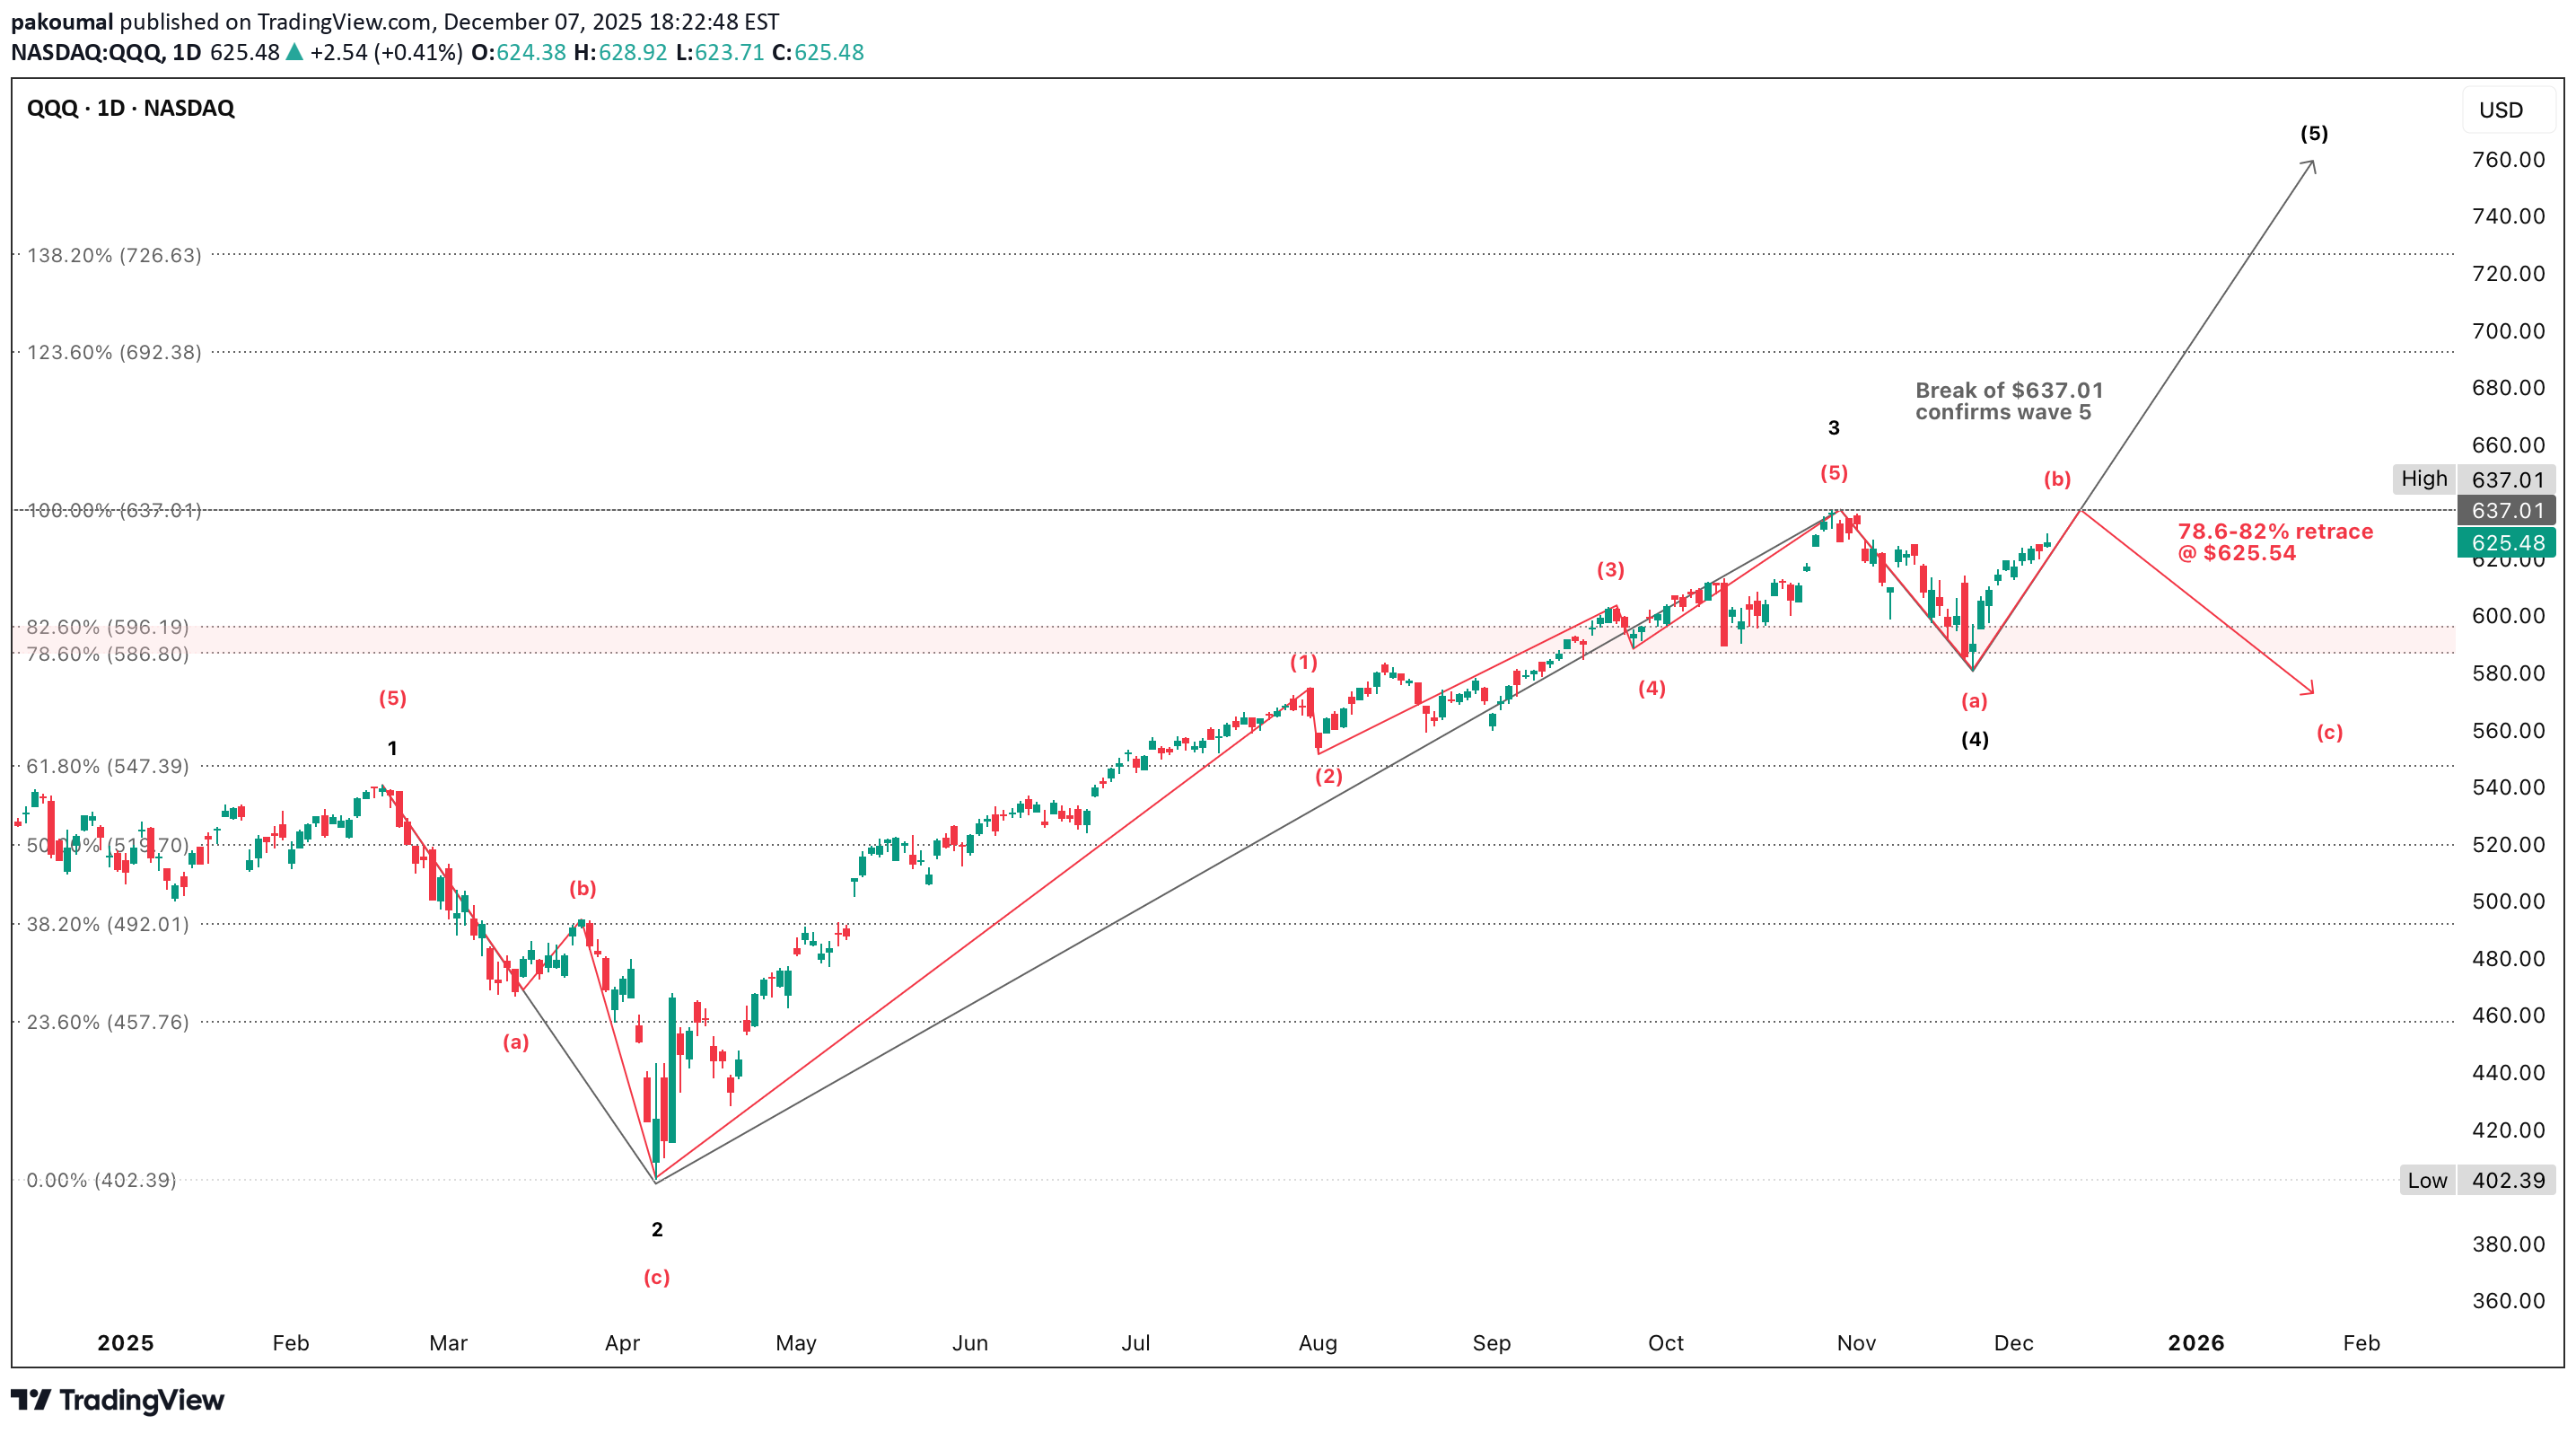
کان ارتداد عید الشکر حقیقیًا وصحیًا من الناحیة الفنیة مع انعکاس حاد على شکل حرف V بقیمة 585 دولارًا تقریبًا استعاد المشترون المتوسطات المتحرکة الرئیسیة (20 یومًا و50 یومًا)، وتحولت مؤشرات التذبذب إلى الأعلى وکسر السعر قاع الذعر دون مقاومة أدى إجراء الأسبوع الماضی إلى إنشاء ملف محکم تحت سقف واضح، وغالبًا ما یتم حل هذا النوع من الإعداد بعد وجود محفز (FOMC) QQQ عند نقطة انعطاف حقیقیة - لیس من الواضح أنها تتصدر، ولا تندلع بشکل واضح کل من التراجع أو الاختراق معقول من الناحیة الفنیة التراجع ممکن بالنظر إلى الزخم الممتد، وحجم التداول الضعیف، والمقاومة الواضحة التی تبلغ 631 دولارًا - 637 دولارًا، والعدید من المکونات قویة، ولکنها لا ترتفع وإشارات الإرهاق الأخرى على المدى القصیر مما یجعل خطر التلاشی ذا مصداقیة من الناحیة الفنیة. لا یزال الاختراق ممکنًا لأن هیکل الاتجاه سلیم، ودافع المشترون عن کل انخفاض لمدة أسبوعین، وترتفع AVWAP على المدى القصیر تحت السعر (الدعم) ولا توجد إشارات انعکاس، لذا یمیل السوق إلى drift صعودًا خلال الأحداث. المسار الأکثر واقعیة هو التباطؤ البطیء إلى ما بین 630 و633 دولارًا فی بدایة هذا الأسبوع، وبعد اللجنة الفیدرالیة للسوق المفتوحة، یختار السوق مساره. إذا لم یکن لدى المشترین قناعة، فسیتم التراجع نحو 612 دولارًا إلى 605 دولارًا إذا حصل المشترون على محفز، فسیکون هناک اختراق فوق مستوى 637 دولارًا الحالة الأساسیة "الارتداد إلى اللجنة الفیدرالیة للسوق المفتوحة ثم التلاشی" مدعومة بالکامل من خلال الرسوم البیانیة، لکنها لیست النتیجة الصحیحة الوحیدة یظل الاختراق ممکنًا من الناحیة الفنیة إذا تم استعادة 637 دولارًا أمریکیًا بحجم کبیر استمر ارتفاع QQQ فی عید الشکر فی التماسک الذی شهده الأسبوع الماضی، ویستعد المؤشر الآن عند مقاومة فی حالة متوازنة ومحایدة من الناحیة الفنیة حتى یتمکن من الارتفاع إلى منطقة 630 دولارًا - 633 دولارًا فی وقت مبکر من الأسبوع، ولکن سیتم تحدید move الحقیقی (التراجع أو الاختراق) بعد اللجنة الفیدرالیة للسوق المفتوحة. الموجة 5 والموجة ب غالبًا ما تبدو متشابهة حتى یتم کسر مستوى رئیسی واحد أو الاحتفاظ به، وفی الوقت الحالی، السعر هو حیث یظل کلا الحسابین صالحین من الناحیة الفنیة & لهذا السبب أشعر بالخسارة - إنه غامض بطبیعته، لکن هناک مستویات دقیقة تحل الغموض 1. یجب أن یکسر السعر أعلى مستوى سابق عند 637.01 دولارًا أمریکیًا دون أی استثناءات یجب أن تحقق الموجة 5 قمة أعلى مقارنة بالموجة 3 2. یجب أن تظهر الموجة 5 شموعًا متوسعة، مما یؤدی إلى تحسین الاتساع وحجم أقوى على السوق دفع من خلال عصابات المقاومة الآن move خارج الموجة أ تبدو تصحیحیة، وغالبًا ما تبدأ الموجة 5 باختبار رجعی تصحیحی؛ ومع ذلک، فإنه یحتوی على مظهر أ – ب – ج تصحیح صعودی، ولیس بدایة لساق جدیدة للأعلى، وهذا بمثابة علم أصفر للحالة الصعودیة 1. إذا رفض السعر المقاومة، فقم بالموجة ب تم تأکید وتم إبطال الموجة 5 یتوقف السعر غالبًا عند مستوى تصحیح 78.6-82%، وهو أمر شائع بالنسبة للموجة ب قمم من المفترض أن ینخفض السعر إلى ما دون 632 دولارًا - 637 دولارًا، ثم یکسر 600 - 605 دولارًا وربما یتسارع هبوطیًا إلى 570 دولارًا 2. إذا أغلق السعر فوق 637 دولارًا، فسیتم تأکید الموجة 5، فترة 3. إذا رفض السعر 630 دولارًا - 637 دولارًا وانخفض إلى ما دون 612 دولارًا، فستکون الموجة ب تم تأکید المسار هذا هو الدعم الأکثر أهمیة على الرسم البیانی کسر 612 دولارًا وکان الارتداد تصحیحیًا لذا موجة ج هو التالی الارتداد من الموجة أ یبدو الانخفاض أشبه بالموجة ب التصحیح من بدایة الموجة 5 نظرًا لأن عمق الارتداد (~ 78.6٪) یناسب الموجة ب حجم تداول متناقص ومؤشرات تذبذب ممتدة دون تأکید الاتجاه والسعر مثبت تحت المقاومة major عادة لا تبدأ الموجة 5 بحجم ضعیف وشموع متداخلة، ولکنها تبدأ بالموجة ب التجمعات غالبا ما تفعل ذلک نحن لا نؤکد الموجة ب أعلى حتى یکسر السوق الدعم من الناحیة الهیکلیة، الرسم البیانی سلیم ولا ینتهک أی hard قواعد إلیوت موجة ب غالبًا ما یتراجع بنسبة 61.8-78.6%، أو أحیانًا بنسبة 100% من الموجة أ یقع الارتفاع الحالی أقل بقلیل من 78.6-82٪ (630 دولارًا - 632 دولارًا) وقد یصل إلى 637 دولارًا إذا اندفع السوق نحو الحدث/المحفز موجة ج تتکشف فی 5 موجات فرعیة نظیفة، غالبًا فی move موازیة للموجة أ ویهبط عادةً بالقرب من مستوى تصحیح 61.8% للموجة الدافعة السابقة والهدف الواقعی هو 560 دولارًا - 575 دولارًا الموجة ج یعد الهدف حول 572 دولارًا معقولًا إذا استمر التصحیح 0.618 × موجة أ (~32 نقطة) 1 × موجة أ (الأکثر شیوعًا، ~52 نقطة) 1.618 × موجة أ (خلال التصحیحات القویة والحادة، ~ 84 نقطة) یقع 572 دولارًا بین 0.618 و1 توقعات للموجة ج یهبط بشکل مثالی تقریبًا على مستوى تصحیح 50% لتقدم الموجة 3 بأکملها
QQQ VWAP Based Entries
When price moves from below to above an AVWAP decisively, it signals short covering & a shift in control from sellers to buyers & when 2 or more AVWAPs converge liquidity concentrates, reversals or breakouts often happen there & these are the spots where traders take reversal trades, breakout entries, or stop placements Right now, the 3 & 21 November AVWAPs are separated, meaning trend strength When they converge, it signals compression 1. Using AVWAPs as a dynamic stop-loss is one of the simplest & most effective uses If you're long above the 21 November AVWAP, the rising blue AVWAP is your dynamic stop A close below it should signal an exit It reflects the average buyer cost basis, not arbitrary price levels 2. An AVWAP is a useful trend filter Price above rising AVWAP(s) suggests a long bias Price below falling AVWAP(s) suggests short bias When price chops around a flattening AVWAP, stay out AVWAP is a trend health indicator 3. AVWAP + candlesticks = clean entry signals The strongest signals come when price pulls back into an AVWAP, prints a small reversal candle (hammer, doji, engulfing) & ATR is declining (just like now) since these become high-quality continuation entries As a high-level playbook, anchor VWAPs at major pivots (highs, lows, breakdowns, earnings gaps), trade pullbacks into rising AVWAPs during uptrends & trade rejects from falling AVWAPs in downtrends Use converging AVWAPs as inflection points Use the nearest rising AVWAP as your stop Anchor to the close if the candle represents an event you want to capture (breakout, breakdown, a clear reversal bar, a candle where closing price indicates the market's verdict, earnings, FOMC, etc) Anchor to (H+L+C)/3 (the “typical price”) when you want a smoothed, less-biased VWAP for longer-term structures or swings Typical price reduces noice from intraday spikes & avoids sensitivity to one extreme print or over-reaction to the tails on the candle (AVWAP from swing highs/lows or the start of a trend) Price is above all AVWAPs This means all meaningful “cost basis cohorts” are beneath price The market is structurally repaired, at least in volume-weighted terms Overhead resistance from anchored supply does not exist right now This is a very different situation from when AVWAPs are stacked above price The ATH AVWAP is rising & firmly below price This is one of the best signs of long-term trend health in AVWAP analysis When the ATH AVWAP is rising, decisively reclaimed & acting as near-term support, it usually tells you the prior correction has been fully absorbed Longs from the top are no longer underwater Selling pressure from those prior buyers is neutralized Trend followers using AVWAP logic have flipped their filters back to “risk-on” This is an objective, mathematical read & not a prediction The 3 & 21 November AVWAP are now support layers 3 November (red) are breakdown-day sellers who are now underwater & this is a bullish dynamic because they can’t apply pressure 21 Nov (blue) are capitulation low buyers, still profitable & in control - primary support Together, these form a layered support around $605-$612, or the area where dip-buyers have historically stepped-in A stop-loss location for AVWAP-based trading systems Now that price is above all 3 major AVWAPs, the focus shifts to behavior around the ATH AVWAP & since price is above it already, there are only 2 meaningful reads 1. Bullish continuation setup 2. Price may pull back to the ATH AVWAP ($618) Find buyers (hammer, doji, small-range reversal) & then move away This is one of Brian Shannon’s highest-probability setups (reclaim AVWAP → pullback → higher low → continuation) Potential warning setup because trend deterioration begins with this move Price closes below the ATH AVWAP Then stays below it for multiple sessions Slope begins to flatten or roll over This would be your first objective sign that the trend is losing strength from an anchored-volume standpoint The chart shows the exact 3 level anchored VWAP system that institutional traders use A correction-low AVWAP (21 November) A breakdown-event AVWAP (3 November) A structural high AVWAP (ATH) This lets you map out short-term trend control (blue), intermediate-term supply absorption (red) & higher-timeframe trend health (gray) & right now, all of them say the same thing Price is in a state of repaired, orderly trend with all major AVWAPs providing support beneath ATH AVWAP Defines trend health at the highest timeframe visible on your chart Swing traders, late buyers at the highs, trend-following algos When price is above the ATH AVWAP then the uptrend is structurally intact When price is below it then long-term players are underwater, trend is suspect QQQ is above the ATH AVWAP (~$618) This means that ATH buyers are profitable again The first high-quality pullback often tags this line in early trend repair phases A reclaim → retest → hold sequence is extremely bullish behavior 3 November breakdown AVWAP Tracks sellers from major breakdowns or panic candles Funds that sold into weakness, systematic risk-off flows If price is above it then that entire selling cohort is underwater These traders become forced buyers on pullbacks or breakouts AVWAP ~$610 Price is above it then supply from that breakdown is absorbed This AVWAP becomes support on deeper pullbacks If price tags it then watch for immediate dip-buying 21 Nov AVWAP - capitulation Tracks the cost basis of buyers who stepped in at the emotional low Aggressive reversal traders, deep-value algos, CTA re-leveraging This is the most important rising support line in the model When price is above it, the reversal cohort is still in control A close below it often signals trend exhaustion AVWAP ~$605 Price is well above it & the slope is rising aggressively As long as price respects this AVWAP, the recovery trend remains clean If price pulls back to it then this is a high-odds rotation/continuation buy point Long-Term AVWAP This is the long rising AVWAP on your chart (~$592) It acts as deep trend support The line separating bull vs bear structure The highest timeframe “fair value” of the entire trend leg A tag here marks trend reset, not breakdown A break below this layer shifts the market into caution This long AVWAP is safely under price so the long-cycle trend remains intact When all layers are stacked in ascending order like this, you get a fully aligned bull structure, clean pullback architecture, no overhead VWAP resistance, multi-cohort profit alignment & strong continuation behavior This model is about control, not prediction & right now, the bullish alignment is simply a fact of structure These levels come directly from how institutions trade AVWAPs 1. ATH AVWAP (~$618) is the light pullback, common after a fast push off a low Signals to watch for include a hammer/doji at the AVWAP Lower wick rejection ATR contraction & reversal Reclaim → hold → push This is the first layer most swing traders buy 2. 3 November AVWAP (~$610) This is the mid-depth pullback It’s usually triggered when short-term longs trim Expect a strong buyer reaction 1-2 days of stabilizing candles Momentum traders stepping back in This is a very strong continuation level in AVWAP systems 3. 21 November AVWAP (~$605) This is the high-value dip This line is VWAP traders’ favorite It represents the true reversal cohort’s cost basis It has been respected perfectly It rises steadily each day It marks the “line of trend continuation” If price reaches this AVWAP, this is often the highest-probability buy in the entire structure Rejecting here = trend continuation Closing below = trend fatigue 4. Long-Term AVWAP (~$592) This is the deep reset, not a casual dip If price ever hits this momentum is gone, trend is resetting, higher timeframe traders reassess, hedge funds rotate & isk allocation shifts This is not a breakdown, but it is a significant tone-change You rarely see this tested unless markets enter a broader digestion phase Given the current AVWAP spacing & slope $618 (ATH AVWAP) is highly actionable $610 (3 November AVWAP) is a strong level $605 (21 November AVWAP) is an institutional-grade support When price is above all 3, VWAP traders don’t look for tops - they monitor control transitions
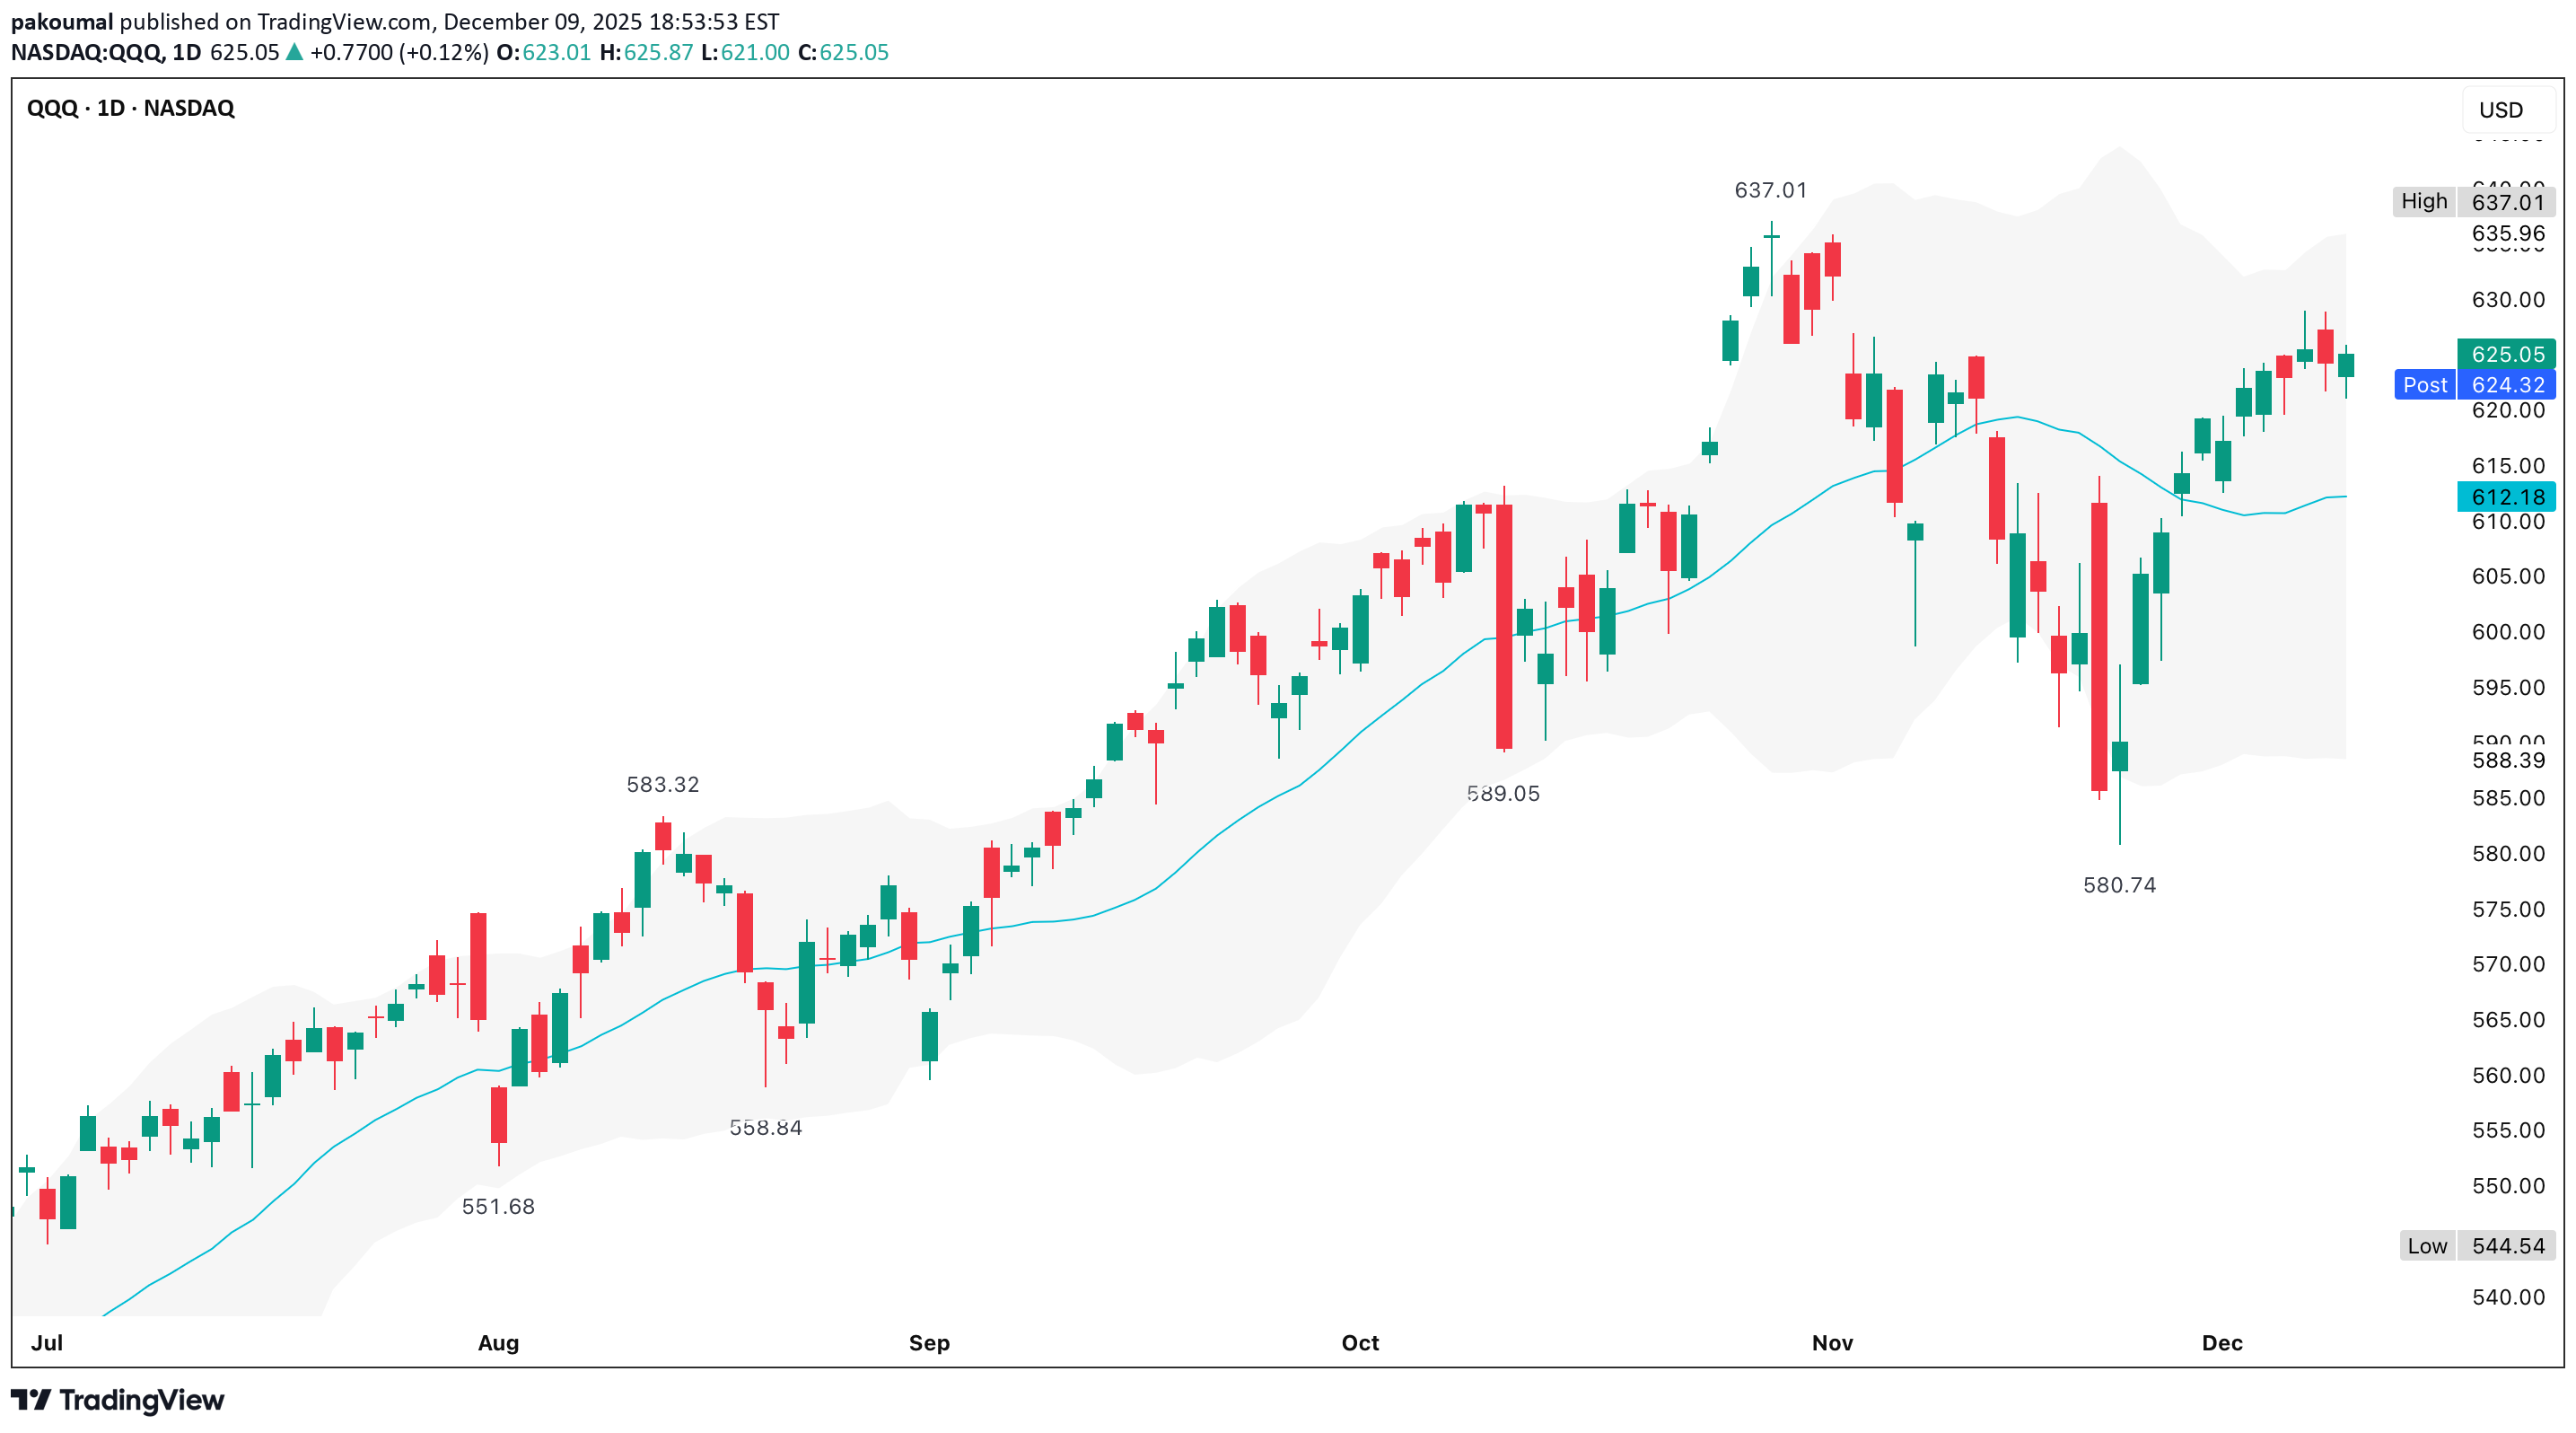
QQQ (5 December)
عندما یصل QQQ إلى قمة الإطار الزمنی الیومی، فإنک عادةً ما ترى امتدادًا مفرطًا للنطاق العلوی، وفتائل رفض متعددة، وشموع هبوطیة غامرة، وتکوین مرتفع منخفض واضح، وانهیار EMA وتقلص الزخم + تقلبات متزایدة، لکن الرسم البیانی یظهر العکس. ارتد السعر بشکل واضح من النطاق الأوسط ویتحرک فی النصف العلوی من قناة بولینجر هذا هو السلوک المستمر - ولیس هیکل الانعکاس الاتجاه الیومی سلیم وصحی لا یوجد إغلاق أسفل منتصف مؤشر بولینجر (20d MA) لا یوجد انعکاس حاد یعنی لا یوجد مخالفة لهیکل أکتوبر المنخفض أعلى مستویاته منذ المحور حول 589 دولارًا وهذا اتجاه صعودی، مع عدم وجود دلیل فنی على القمة 637 دولارًا هو ATH نادرًا ما یتصدر QQQ عند إعادة الاختبار الأول إما أن یکون (1) یتماسک تحت المقاومة ثم ینکسر، أو (2) یتظاهر بانخفاض بسیط ثم ینکسر یُظهر الإعداد الحالی توسعًا متحکمًا فیه، وظروف الاتجاه، وعدم وجود ارتفاع فی التقلبات، والتزام سلس بدعم النطاق المتوسط وتکوین قمم أعلى داخل النطاقات. هذا صعودی الشمعة الأخیرة باللون الأخضر، وتغلق بالقرب من الجزء العلوی band بحجم تداول قوی وأغلق QQQ فوق 625 دولارًا - وهو ارتفاع أعلى مقارنة بالأسبوع الماضی، مما یشیر إلى الاستمرار، ولیس التوزیع. 1. محاولة الاختراق نحو 630 دولارًا - 635 دولارًا 60% الاتجاه + الموضع فی band یفضل الاتجاه الصعودی 2. التراجع إلى 620 دولارًا - 615 دولارًا قبل الارتفاع إلى الأعلى 30% إعادة الاختبار القیاسی لهیکل النطاق المتوسط 3. Deep الانعکاس نحو مستوى 580 دولارًا 10% لا یوجد نمط تتصدر؛ یتطلب صدمة کلیة
إخلاء المسؤولية
أي محتوى ومواد مدرجة في موقع Sahmeto وقنوات الاتصال الرسمية هي عبارة عن تجميع للآراء والتحليلات الشخصية وغير ملزمة. لا تشكل أي توصية للشراء أو البيع أو الدخول أو الخروج من سوق الأوراق المالية وسوق العملات المشفرة. كما أن جميع الأخبار والتحليلات المدرجة في الموقع والقنوات هي مجرد معلومات منشورة من مصادر رسمية وغير رسمية محلية وأجنبية، ومن الواضح أن مستخدمي المحتوى المذكور مسؤولون عن متابعة وضمان أصالة ودقة المواد. لذلك، مع إخلاء المسؤولية، يُعلن أن المسؤولية عن أي اتخاذ قرار وإجراء وأي ربح وخسارة محتملة في سوق رأس المال وسوق العملات المشفرة تقع على عاتق المتداول.