تحليل التحليل الفني pakoumal حول QQQX في رمز في 13/12/2025

QQQ (12 December)
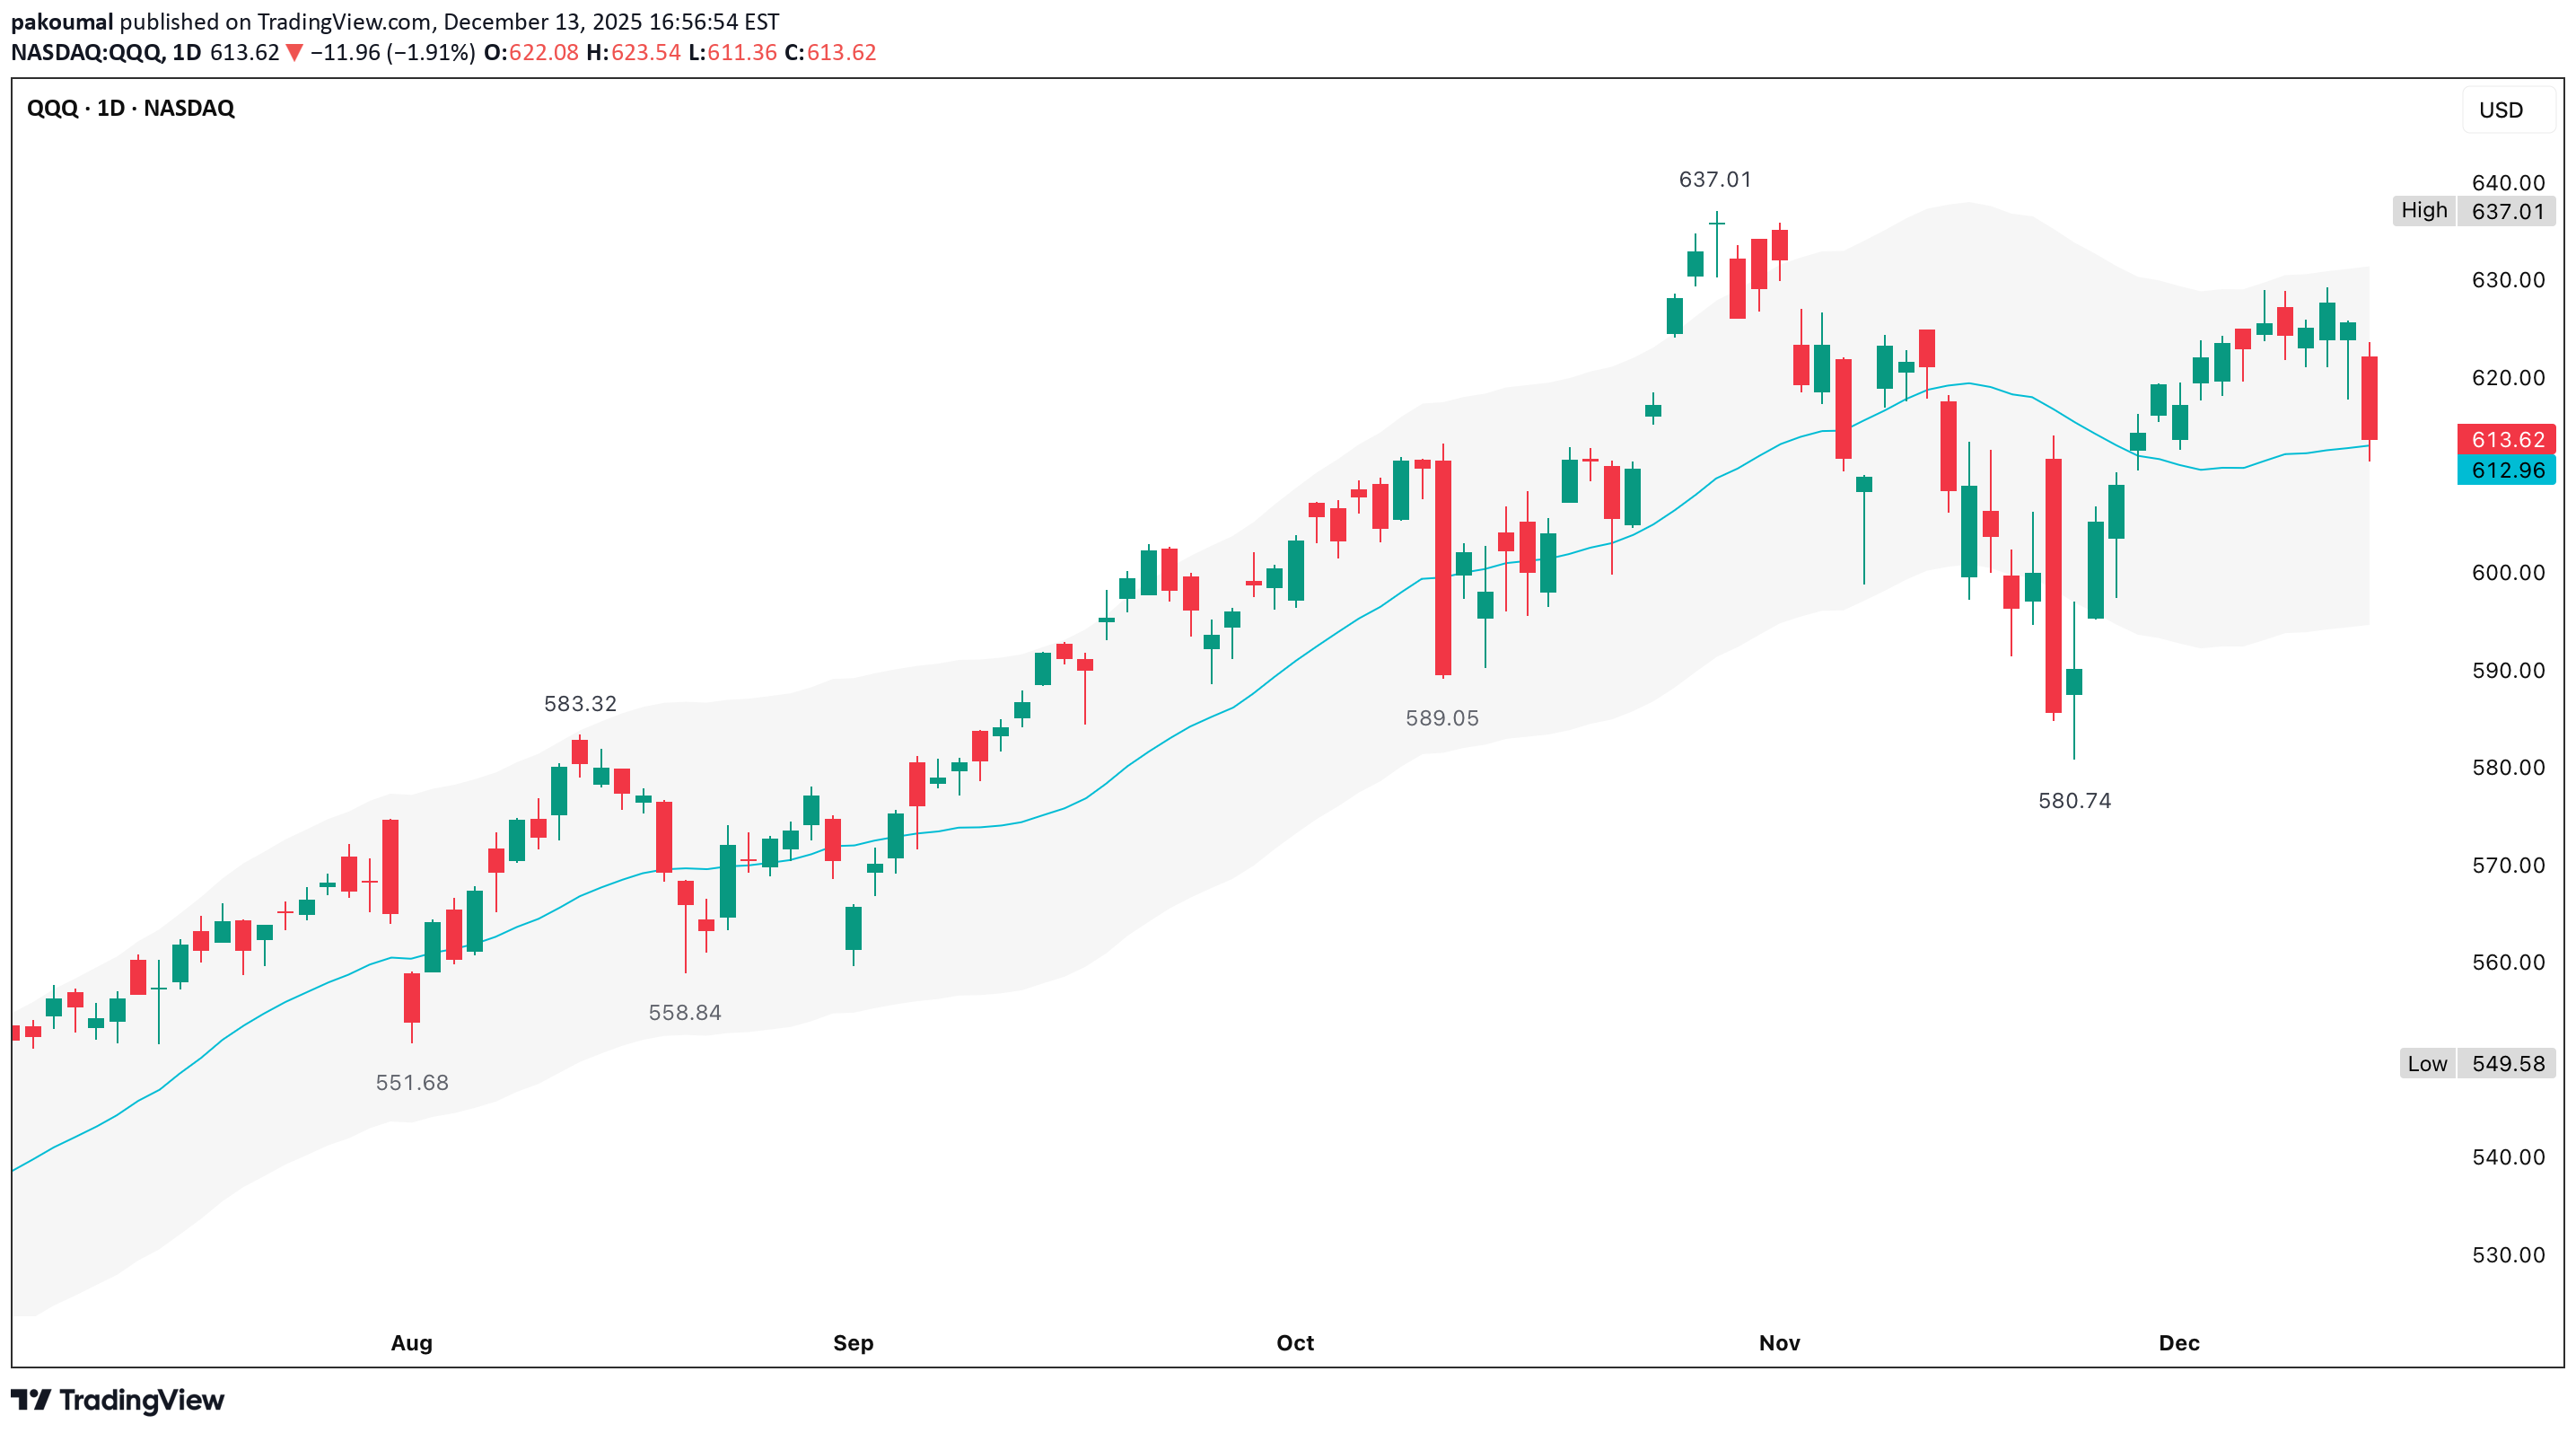
A ±3% envelope around the 20d MA does 3 important things 1. Upper band Marks short-term trend extension Rallies that fail from here often lead to multi-week digestion 2. 20d MA Control line for short-term trend Chop around it = balance, not resolution 3. Lower band (~-3%) Where momentum resets actually complete Where successful Santa rallies most often launch Price is slightly below the 20d MA & still well above the −3% band Recent selloffs have tagged the 20d MA, but not the lower band & that tells us that the reset is in progress, but not finished When Santa rallies succeed, price either 1) touches or briefly pierces the −3% band, then reclaims the 20d MA OR 2) spends enough time between midline & lower band that volatility collapses The key is whether sellers are forced to exhaust themselves & that exhaustion point lines up with ~$590-$600 The cleanest sequence for a high-quality Santa set-up is that price drifts/flushes into the −3% band & we see long lower wicks, smaller red bodies, failed follow-through on down days & price reclaims the 20d MA since Santa rally starts from inside value, not above it This leads to grind higher quietly, carry into early January & avoid sharp January reversals A weak or fake Santa rally happens when price never touches the −3% band Rallies start from above the 20d MA, upper band is hit quickly & momentum rolls again in early January The chart still argues for at least one push toward the lower band (~$590s) before a durable Santa rally - not because Santa can’t happen without it, but because momentum has not been fully neutralized & the market hasn’t forced capitulation from late longs Santa-ready = price has touched the −3% band & reclaimed the 20d MA Not Santa-ready = price still oscillating above the lower band This ±3% / 20d MA view confirms everything from the weekly MACD It visually explains why $590-$600 keeps showing up Santa rallies that start after a lower-band test are stronger & last longer Santa rallies that start before it are more fragile The weekly MACD is saying that momentum is rolling, not reversing & in strong bull markets, this exact MACD behavior typically resolves via price moving sideways-to-down until momentum resets & the trend continues - not how a major top appears The MACD is not deeply negative which argues against panic-style selling, but it does demand time or price, or both The weekly MACD does not resolve with a quick bounce to $625, or a shallow 2-3% dip It usually resolves with a 5-8% pullback, or several weeks of chop From the ~$637 high 5% ≈ $605 6-7% ≈ $595 to 590 Which lines up exactly with weekly 20 MA & prior breakout structure Structure strongly favors price visiting ~$590 since that actually resets momentum The weekly trend is bullish & weekly momentum is resetting Daily structure is corrective, 4H AVWAPs suggest balance & the 1H wedge pattern is a short-term pressure When all of those align, the most common resolution is drift/chop to a test of $590-$600, consolidate a base & rally A $620-$625 bounce can still happen inside that process, but it’s secondary, not required Test $590s, then base ~55% (base case) Chop $600-$620, no resolution ~25% ATHs without touching $590 ~15% Sharp breakdown below $580 ~5% The weekly MACD confirms a reset is underway & that reset most cleanly completes near $590-$600 A $620-$625 bounce is optional, not necessary Any move into $590-$600 that holds weekly structure is bullish, not bearish The higher-probability outcome is a test of the $590s before any Santa-rally-style push to new highs Historically, QQQ does not print new ATHs while weekly momentum is actively resetting since that reset almost always completes before the seasonal tailwind expresses itself So if there is a Santa rally, it’s far more likely to start from lower prices, not launch from mid-reset levels A move into the $590s completes a 5-7% pullback, resets weekly momentum cleanly, flushes late longs & sets up positioning for a late-December/early-January run This sequence aligns perfectly with typical late-year behavior Santa rallies that actually stick, not fail Markets prefer to rally from fear, not from complacency The one thing that would flip this quickly is if & only if price closes on the daily above $625, followed by strong acceptance Seasonality is subordinate to structure The market is resetting, not breaking Santa rally odds improve after a dip, not before $590s before ATHs is the cleaner, more durable path Any dip into the $590s that holds weekly structure is bullish fuel, not danger This SMH/QQQ ratio chart is the missing piece & it materially tilts the odds toward the base case The ratio is still in a clear uptrend, it's above its rising MA, so long-term structure is higher highs, higher lows, which means semiconductors are still outperforming QQQ on a medium-term basis, so despite the AVGO-driven selloff, leadership has not broken & that matters a lot The pullback is a mean-reversion, not a regime change In strong markets, relative strength pulls back to the MA, then either consolidates & resumes higher, or rolls over decisively (which has not happened) Semis are ~40% of QQQ’s momentum contribution QQQ rarely makes a sustained leg lower without semis underperforming The ratio holding implies any QQQ downside is corrective & not the start of a broader drawdown That supports bounce attempts, shallow-to-moderate retraces & defense of higher MAs (50d & 100d MA) This slightly changes the probability weights in my opinion vs a $590 test as highest single outcome Bounce to $620-$625, stall ~45% Bounce & range $615-$630 (no immediate $590) ~25% Breakdown to $590 test ~20% Breakout & reclaim $632+ ~10% So $590 is still very much in play, but it is less inevitable than it looked without the ratio & this is exactly why relative strength matters The $590 test would be much more likely if SMH/QQQ closes below its MA & then fails to reclaim it within ~3-5 sessions If that happens semis stop leading & QQQ likely seeks the 100d MA (~$590-$596) If ratio stabilizes and turns up, QQQ holds above $610, then the $625 test becomes constructive, not corrective I believe this ratio shows that the cause (profit-taking) is validated, the damage is contained & that the sequence still favors bounce, consolidation/decision & either delayed ATHs or a shallow reset What it argues against is an immediate waterfall to $590 The SMH/QQQ ratio says leadership is intact That reduces (does not eliminate) the odds of an immediate $590 flush A bounce toward $620-$625 is now even more likely The next decision happens at $625, not $590; unless, semis lose relative strength CPI & NFP next week are much more likely to affect intraday volatility than weekly direction since they are unlikely to invalidate the $590-$600 reset thesis unless the data meaningfully re-prices the rate path, which Powell explicitly tried to prevent so treat CPI/NFP days as liquidity events & not trend confirmation days Powell effectively said Don’t overreact to individual prints - policy is about the trend Watch where price closes, not the spike If the market uses data to explore lower value & then fails to continue, that’s bullish If it uses data to bounce, but cannot reclaim key levels, the reset continues The data does not replace the technical process - it only colors it