
fibcos
@t_fibcos

ما هو الشيء الذي ننصحك بشراءه من المواد الغذائية؟
سابق في الشراء
پیام های تریدر
مرشح
fibcos
سقوط بیت کوین تازه شروع شده است: زنگ خطر برای ریزش بزرگ BTC!
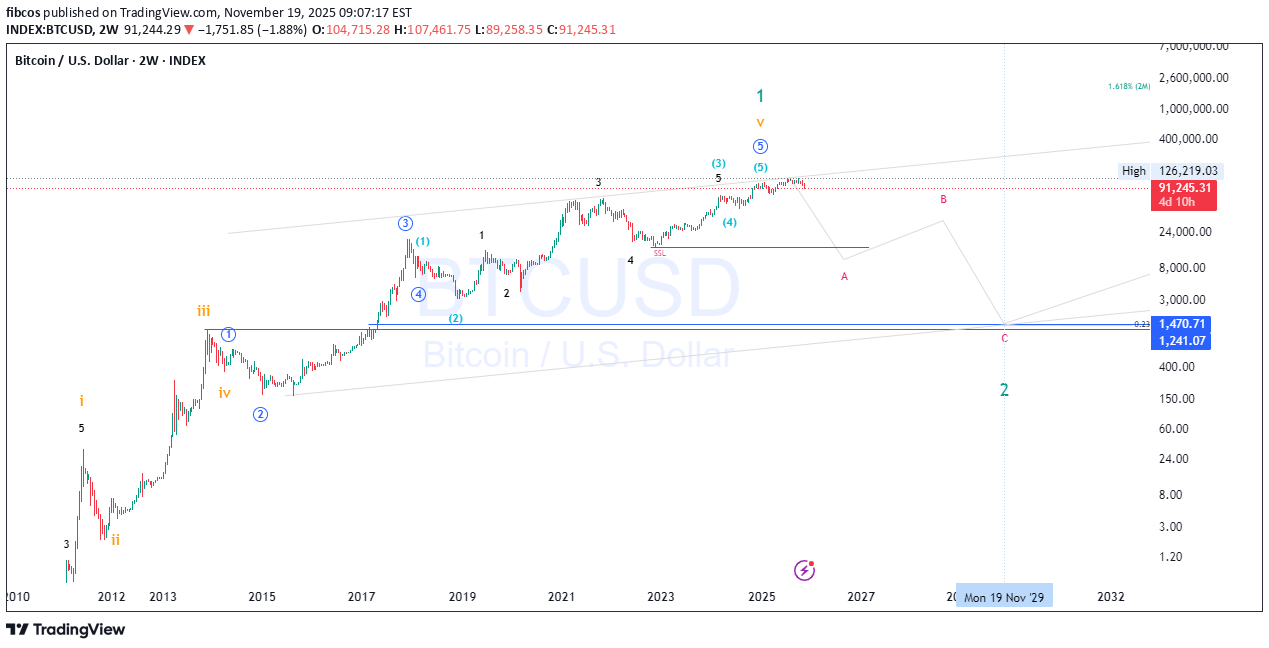
⚠️ الانعکاس BITCOIN العظیم — العاصفة التی لا أحد مستعد لها ⚠️ لسنوات Bitcoin بیتکوین مقابل الدولار صعدت بغطرسة ملک مقتنع بأن عرشه أبدى. لکن کل إمبراطوریة تسقط. والرسم البیانی… لقد کان الرسم البیانی یهمس بالحقیقة قبل وقت طویل من أن یرغب أی شخص فی سماعها. والیوم، أصبح هذا الهمس بمثابة الصراخ. 📉⚡ 🔥 1. لقد انکسرت الموجة الأخیرة، وکذلک الوهم ال ماکرو ویف 5 أعلى هو فی. التقاء مثالی. الإرهاق التام. نشوة مثالیة. نفس النمط الذی أنهى کل Bitcoin دورة ضخمة... تمت طباعته مرة أخرى. لم یکن هذا قمة. لقد کان ال أعلى. فی اللحظة التی أطلقت فیها دورة الثور أنفاسها الأخیرة. 💀📈 🩸 2. لقد غادرت Smart Money المبنى بالفعل فی حین احتفلت تجارة التجزئة "بالارتفاعات الجدیدة"، حققت Smart Money ما یلی: • وقف الصید • الاستیلاء على السیولة • کتل الکسارة • نطاقات التوزیع • زرع مدمر • وأنظف کسر هیکل السوق BTC تم عرضه منذ عام 2018 المؤسسات لا تشتری الانخفاضات. هم تفریغ الجبل . الجمهور لا یرى ذلک – حتى الآن. ⚡ 3. انهیار هیکل السوق على غرار الأعوام 2014 و2018 و2021 بدأ موت کل دورة بنفس الطریقة: تراجع لطیف… رفض مفاجئ.. ثم أ فشل التأرجح العنیف , تلیها هیکل HTF ینکسر إلى النصف. هذا التسلسل الدقیق یحدث الآن . هذا لیس تصحیحا. هذا هو إعادة ضبط الدورة . 🎯 4. تراجعات فیبوناتشی لا تکذب - إنها تحذر لقد عادت کل موجة ماکرو حقیقیة 2 فی التاریخ إلى: 🔻 0.786 🔻 0.886 🔻 1.0 – 1.618 امتدادات أین یجتمعون هذه المرة؟ 👇 🔮 6,000 دولار – 1,250 دولار الأرض المنسیة لهوس 2017... تم تجنب المستوى BTC لمدة 8 سنوات. لکن الدورة تتطلب التوازن. والتوازن یعود دائما. 🌪️ 5. انقلبت حرکة السعر من الثقة إلى الذعر لقد تغیرت الشموع الطابع: • إغلاق ضعیف • فتائل طویلة من الرفض • مسیرات فاشلة • اختلال التوازن إلى الأسفل • مصائد الثیران فی کل مکان • إزاحة عنیفة نحو الأسفل هذا لا یبرد. هذا هو الاسترخاء. 📉 6. دخلت سیکولوجیة دورة السوق أحلک مراحلها لقد خرجنا للتو النشوة. نحن فی الرضا عن النفس. یأتی التالی: 😨 القلق 😱 الخوف 💀 الاستسلام 🔥 الغضب 🌑الاکتئاب فقط بعد ذلک یبدأ التراکم الجدید. ولهذا السبب أصبحت Wave 2 سیئة السمعة. إنه یدمر ما بنته الموجة 1. 🚨 الحکم: السقوط فی طریقه – ونحن مبکرون من 126 ألف دولار إلى 90 ألف دولار لم یکن الانهیار. لقد کان مجرد الشرارة الأولى فی غابة ملیئة بالأوراق الجافة. بالکاد بدأت الموجة A. سوف تخدع الموجة B. سوف تدمر الموجة C. یبقى هدف نهایة اللعبة: 🎯 1,250 دولار - 6,000 دولار إعادة ضبط الدورة. التطهیر. فرصة العقد – لکن فقط بعد أن تحرق النار کل ما فوقها. 🔥 هذا لیس خوفا. هذه هی البنیة والریاضیات وعلم النفس والسیولة والوقت نفسه. وکلها تشیر إلى نفس الاتجاه. أسفل، أسفل، أسفل 🔥 اتبع هذه الفکرة لتظل متقدمًا على الماکرو التالی move. 📈 سنقوم بتحدیث الرسم البیانی مع ظهور الهیکل - الموجة A، ومصیدة الموجة B، ومنطقة الاستسلام الکاملة للموجة C. 💬 إسقاط أفکارک أدناه - أوافق أو لا أوافق، سیقرر الرسم البیانی. 🚀 قم بتشغیل الإشعارات حتى لا یفوتک الانهیار الحرج التالی. ⚠️ إخلاء المسؤولیة: هذا التحلیل للأغراض التعلیمیة والإعلامیة فقط. لیست نصیحة مالیة. قم دائمًا بإدارة المخاطر واتخاذ القرارات بناءً على أبحاثک الخاصة واستراتیجیتک الشخصیة. #Bitcoin #BTC #Crypto #CryptoAnalogy #TradingView #BTCUSD #BearMarket #ElliottWave #SmartMoney #PriceAction #MarketCycle #Fibonacci #TechnicalAnalogy #CryptoCrash #CryptoWarning
fibcos
تله نهنگها در انتظار Zcash: آیا سقوط به زیر 350 دلار قطعی است؟
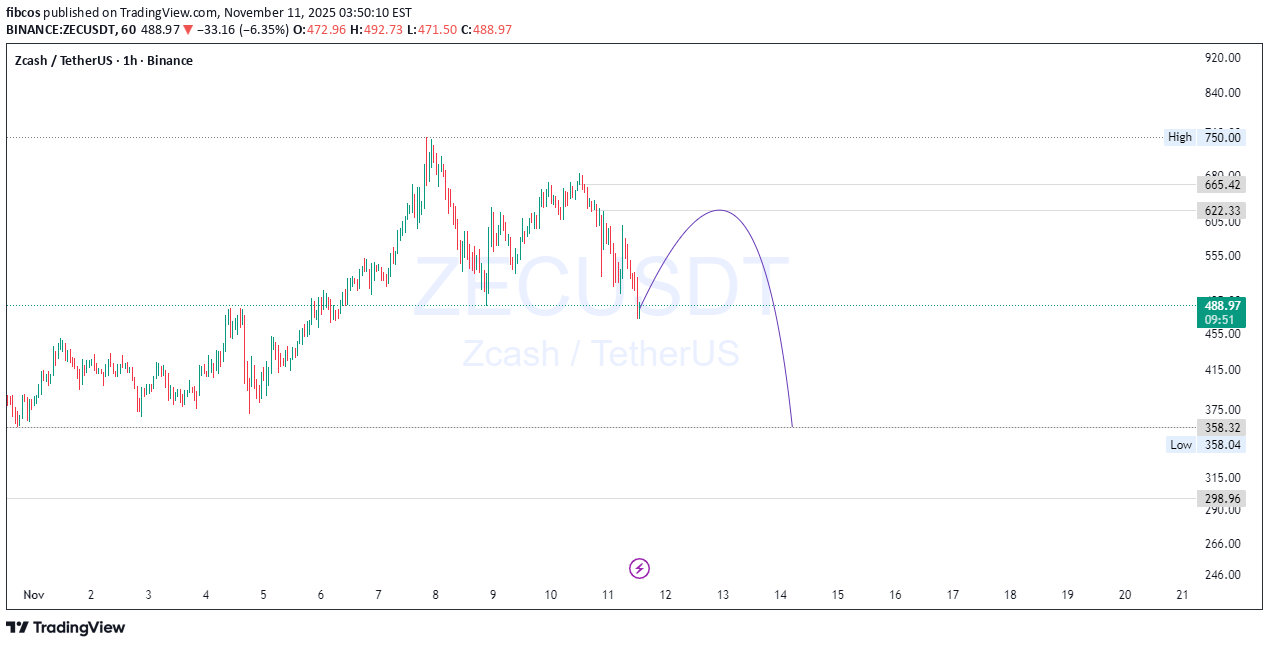
🧠 ZEC/USDT – فخ الأموال الذکی قبل الهبوط؟ Zcash جرفت السیولة للتو إلى ما دون أدنى مستوى رئیسی على المدى القصیر 👀 - تتفاعل الآن من منطقة الطلب، لکن الحجم یؤکد ضعف النیة الصعودیة. توقع أ الاستیلاء على السیولة + مرحلة التوزیع قبل أن یغوص السعر نحو 300 دولار – 350 دولارًا النطاق، والذی یتماشى مع عملیات ملء اختلال التوازن فی الإطار الزمنی الأعلى والطلب غیر المخفف أدناه. قد تکون Smart Money هی الهندسة الأخیرة فخ الثور قبل تخفیض السعر الحقیقی یبدأ. 📉 انتبه للرفض من منطقة العرض 620-650 دولارًا لتأکید move! #ZECUSDT #Zcash #CryptoAnalogy #PriceAction #SmartMoneyConcepts #LiquidityGrab #BearishSetup #CryptoTraders #TradingView #Fibonacci #SwingTrade #MarketStructureBreak #Wyckoff #SMC 💬 ما هو انحیازک – فخ الثور أم الانعکاس؟ أسقط أفکارک أدناه 👇
fibcos
هشدار طلا: تله هوشمندانه برای فروش / منتظر سقوط سنگین قبل از جهش به ۵۱۰۰ باشید!
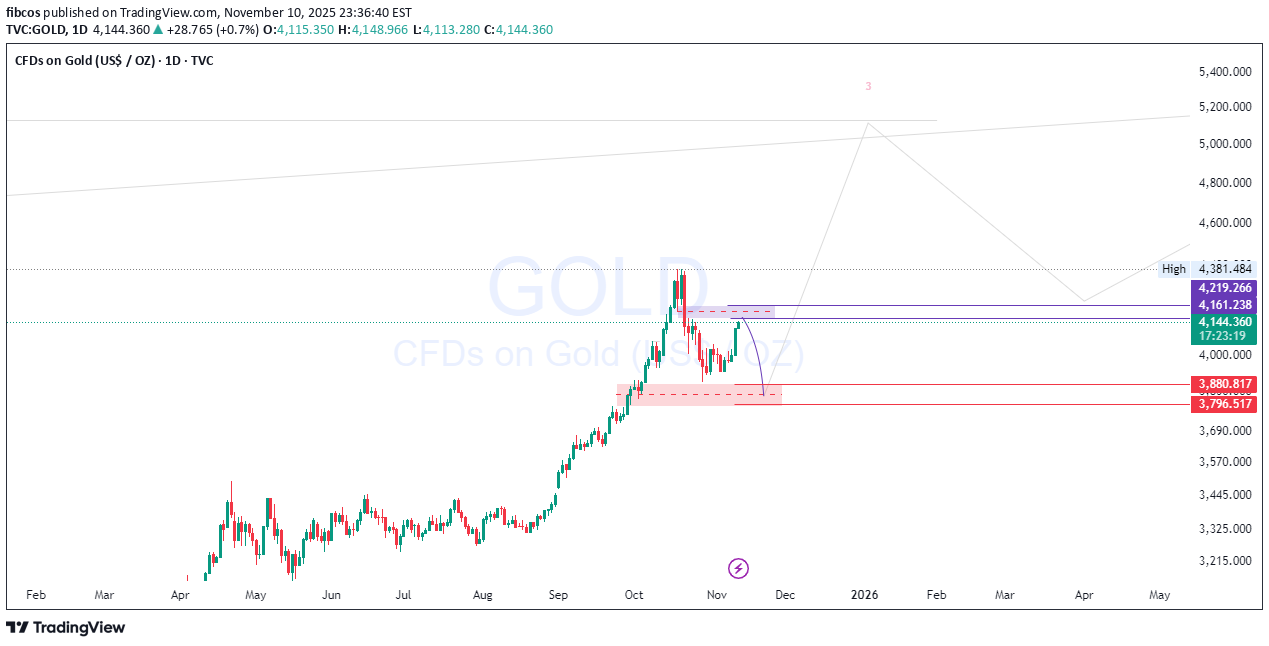
💥 الذهب: الأموال الذکیة تنصب الفخ! 💰 توقع الانخفاض إلى 🟩 3800 قبل اختراق مستوى 5,100 دولار. لا تطارد – اتخذ موقفًا ذکیًا. 🚀 الذهب کان لا یمکن إیقافه - حیث سجل ارتفاعات أعلى وترک المتداولین العاطفیین وراءهم. ولکن الآن... جارٍ تحمیل مصیدة الأموال الذکیة ⚠️ لقد وصل السعر إلى 🟥 4160-4220 منطقة متمیزة وحیث تتکدس السیولة وتقوم المؤسسات بإعداد إیراداتها القادمة بهدوء. قبل الارتفاع الصعودی الهائل ل 5,100 دولار+ ، توقع أخیرًا com.shakeou t - تراجع مصمم ل تدفق صفقات البیع بالتجزئة و إعادة تحمیل عملیات الشراء المؤسسیة قریب 🟩 3880-3800. سوف الذعر الحشد. سوف یتراکم pros. تحلى بالصبر، وتداول بذکاء. 🧠✨ 📊 انهیار الأموال الذکیة: 🧠 قواعد اللعبة المؤسسیة: السیولة تستقر فوق أعلى المستویات الأخیرة 🧲 🟥 4160-4220 = منطقة توزیع الأموال الذکیة 🟩 3880–3800 = منطقة إعادة تراکم الخصم توقع أ انخفاض مزیف → انعکاس صعودی متفجر 💡 خطة التجارة: 🔻 منطقة البیع: 🟥 4,161 – 4,219 🎯 الأهداف: 🟩 3,880 - 3,800 (منطقة عودة طویلة مثالیة) 🚀 الهدف النهائی: +5,100 دولار أمریکی (بمجرد الاحتفاظ بالخصم OB) 🟨 مؤثرات حرکة السعر: اکتساح السیولة فوق أعلى مستویات الهیکل 🩸 فجوة القیمة العادلة + محاذاة کتلة الطلب ⚙️ الإطار الزمنی الأعلى لا یزال BOS سلیمًا 💪 تصحیح الموجة 2 على طراز إلیوت قبل التوسعة التالیة 🌊 🧭 نظرة عامة على التحیز: 🟥 على المدى القصیر: تصحیح هبوطی مسیطر علیه 🟩 منتصف المدة: استمرار صعودی متفجر → $5,100+ 💭 العقلیة: تداول الفخ — ولیس العاطفة . ⚠️ إخلاء المسؤولیة: هذا المحتوى ل للأغراض التعلیمیة والإعلامیة فقط. إنه کذلک لا تشکل نصیحة مالیة. قم دائمًا بتطبیق التحلیل الخاص بک وإدارة المخاطر قبل التداول. 💡 🔥 اتبع بالنسبة لإعدادات Smart Money + Price Action التی لا تشارکها البنوک الکبرى! 💬 التعلیق أدناه - هل تبیع المصیدة أم تنتظر شراء الانخفاض؟ ⚡ هیا نرکب الذهب move معًا - بالدقة ولیس بالعاطفة. #Gold #XAUUSD #SmartMoneyConcepts #PriceAction #LiquiditySweep #OrderBlock #SwingTrading #Commodities #GoldAnalogy #FVG #TradingView #InstitutionalTrading #MarketStructure #GoldForecast #Forex
fibcos
مسیر مخفی فیبوناچی متا: آیا آماده رسیدن به ۴۰۰۰ دلار هستید؟ (پیشبینی موج ۳)
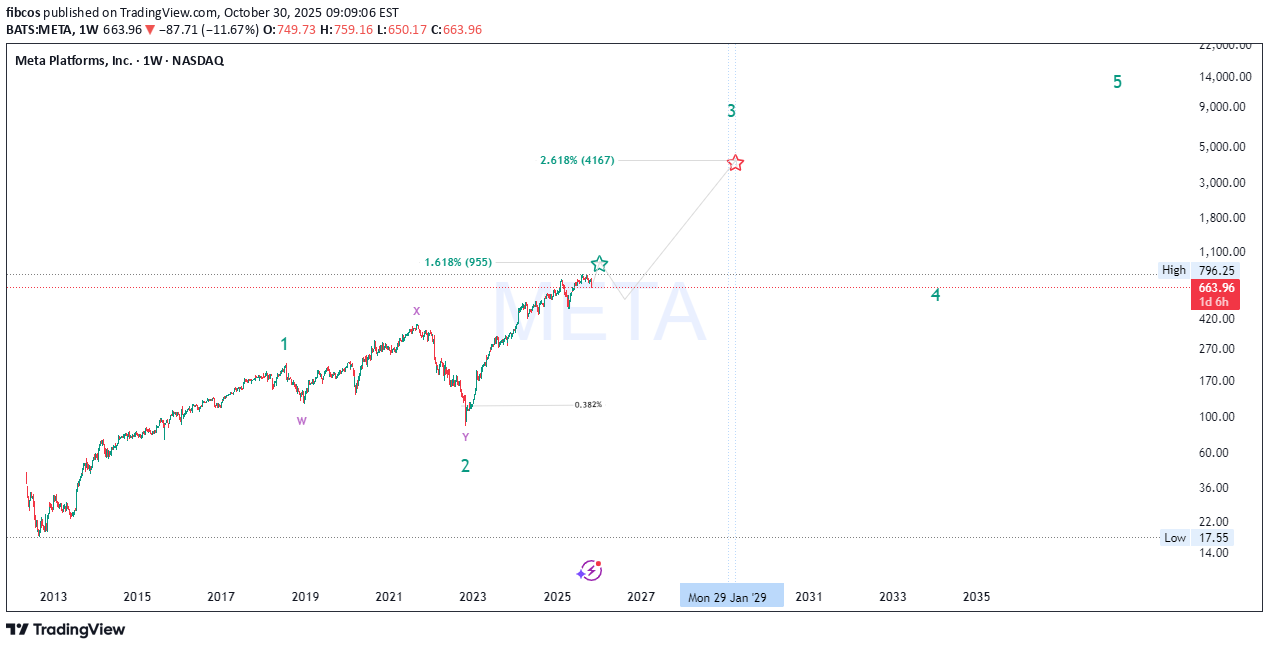
🚀 موجة إلیوت طویلة المدى من META + توقعات ماکرو للأموال الذکیة 🌊 هیکل موجة إلیوت (662 → 955 → 4000+) یبدو أن META تتقدم من خلال أ major دورة فائقة الاندفاع ذات 5 موجات على الإطار الزمنی الأسبوعی: الموجة 1: الانطلاق الأولی من التراکم (2015-2021)، مدفوعًا بالنمو فی هیمنة الإعلانات وروایات التوسع المتغیر. الموجة 2: Deep هیکل W-X-Y التصحیحی إلى أدنى مستوى لعام 2022 عند 90 دولارًا تقریبًا - وهی مرحلة کلاسیکیة لاکتساح السیولة وإعادة تجمیعها لعدة سنوات. الموجة 3 (قید التنفیذ): هذا هو عادة الموجة الأقوى والأوسع ، مع محاذاة توقعات فیبوناتشی بالقرب من 2.618 ملحق ≈ 4,160 دولارًا ، مستهدفًا الفترة 2028-2029 بناءً على الزخم الحالی. الموجة 4: من المتوقع form إعادة توزیع ماکرو أو نطاق یتراوح بین ~ 900 دولار - 1000 دولار قبل الموجة المکافئة النهائیة 5، ومن المحتمل أن تمتد نحو 10 آلاف دولار + . 💡 التقاء الموجة: 1.618 امتداد فیبوناتشی للموجة 1 → الموجة 3 یحاذی حولها 955 دولارًا ، بصفته المقاومة major الأولى (والمنطقة العالیة الحالیة لدیک). 2.618 امتداد فیبوناتشی → هدف الماکرو التالی 4,160 دولار مما یؤکد الزخم الاندفاعی الصعودی. 🧠 مفاهیم الأموال الذکیة (SMC) یمثل قاع 2022-2023 أ مرحلة “التهجیر + إعادة التراکم”. مع استیعاب المؤسسات للسیولة تحت مناطق الطلب السابقة. تظهر حرکة السعر الحالیة (منتصف عام 2025). رد فعل نطاق قسط حیث من المرجح أن تحقق الأموال الذکیة أرباحًا جزئیة قبل مرحلة التراکم التالیة. توقع ارتداد إلى منطقة فیبوناتشی 0.382-0.5 (420-500 دولار) لإعادة موازنة أوجه القصور قبل الاستمرار نحو أهداف الموجة الکلیة 3. منطقة إعادة التراکم الرئیسیة: 420 دولارًا - 500 دولار - ترقب تأکید BOS (کسر الهیکل) واکتساح السیولة إلى ما دون أدنى مستویاتها المتساویة. 🔍 محاذاة فیبوناتشی ارتداد 0.382 یمثل إعادة دخول الموجة 4 المثالیة. 1.618 و 2.618 امتدادات تتماشى تمامًا مع نقاط التقاء الموجة 3 و5 - التوسع الاندفاعی للکتب المدرسیة. تم تأکید کل منطقة امتداد من خلال عملیات مسح السیولة وشموع الإزاحة السابقة، مما یزید من موثوقیة فیبوناتشی 📈. 📊 هیکل السوق وحرکة السعر تحتفظ META بـ أ هیکل السوق الصاعد القوی من الارتفاعات الأعلى (HH) والقیعان الأعلى (HL) منذ عام 2023. ال التصحیح الأخیر بنسبة 9٪ (-69 دولارًا) ومن المرجح أن یکون ذلک بسبب انتزاع السیولة على المدى القصیر، ولیس الضعف الهیکلی. طالما أن السعر ثابت أعلاه 420 دولارًا ، هیکل السوق الصعودی الکلی لا یزال سلیما. یظهر ملف تعریف الحجم تراکم کبیر یتراوح بین 300 إلى 450 دولارًا مما یشیر إلى أن الأموال الذکیة لا تزال فی وضع صعودی على المدى الطویل. 💰 التقاء أساسی أساسیات META تلحق بالتقنیات: ضخمة AI CapEx و استرداد الإعلانات تعزیز نمو EPS 📊 تقلص معدل حرق Metaverse ، تحسین الربحیة إعادة شراء الأسهم توفیر أرضیة لتصحیحات الأسعار تدعم بیئة الماکرو تناوب القیادة التقنیة ، وتظل META المستفید الرئیسی من دورة التآزر AI + الاجتماعی data 🔄 🔮 عرض دورة السوق نحن ندخل "مرحلة التوسع" من دورة الابتکار الأوسع. 2018-2022 = تراکم / الکفر 2023-2025 = العلامات المبکرة / إدخال الأموال الذکیة 2025-2029 = مرحلة المشارکة العامة (المرحلة 3) 💥 ما بعد 2029 = النشوة / التوزیع (الموجة 5) 😱 ⚙️ المستویات الرئیسیة للمشاهدة مناطق الدعم: 420 دولارًا - 500 دولارًا (إعادة دخول الموجة 4) مستویات المقاومة: 955 دولارًا → 4,160 دولارًا (أهداف الموجة 3) الإبطال: کسر مستمر أقل من 300 دولار عند الإغلاق الأسبوعی 📈 ملخص تظل META واحدة من الأقوى الرسوم البیانیة الصعودیة الکلیة فی التکنولوجیا الکبیرة - مع محاذاة مثالیة عبرها موجة إلیوت، SMC، فیبوناتشی ، و نظریة الدورة الأساسیة . نحن نشهد حالیا منتصف المرحلة من الموجة 3 ، مع إعادة التموضع المؤسسی قبل المحطة العمودیة التالیة. ویمکن توفیر الصبر والدقة حول منطقة إعادة التراکم (420 إلى 500 دولار). الإعداد الذهبی قبل موجة التوسع القادمة 🚀🌕 #META #ElliottWave #SmartMoneyConcepts #Fibonacci #Wave3 #BullMarket #AIStocks #TechnicalAnalogy #TradingView
fibcos
تحلیل موج الیوت: مسیر انفجاری انویدیا (NVDA) تا ۲۶,۰۰۰ دلار!
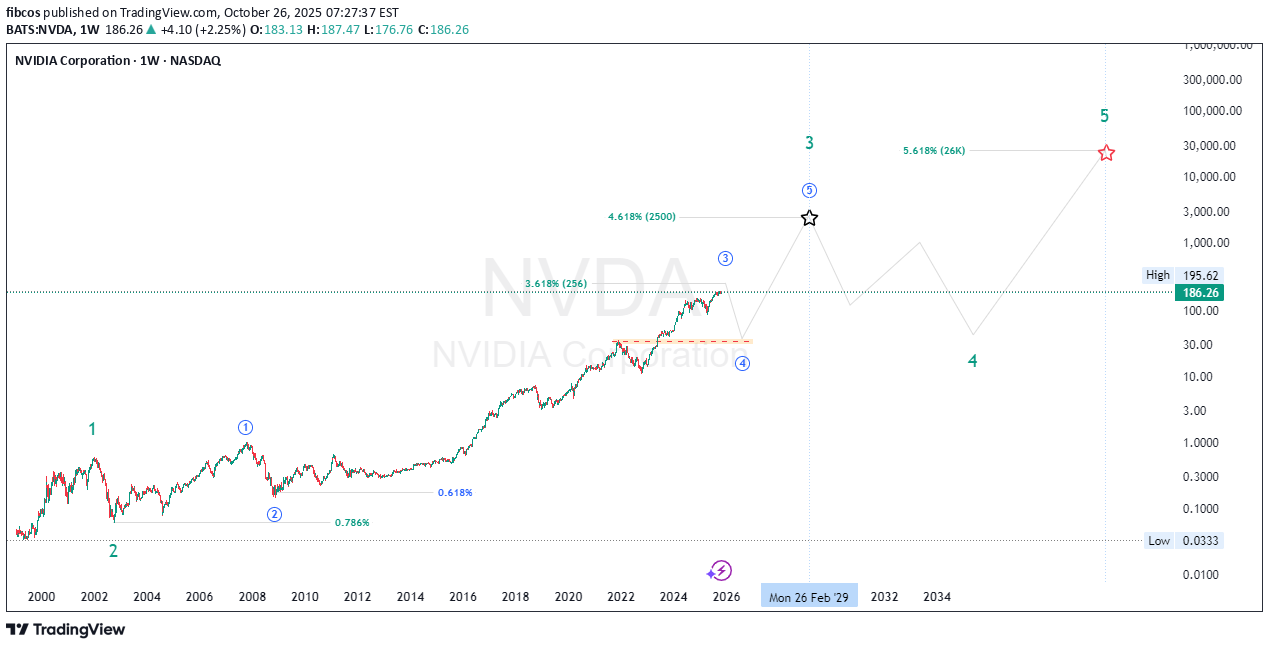
Summary: “Elliott Waves, Fibonacci, and Smart Money align perfectly — NVIDIA’s long-term chart points to an AI-powered Supercycle with massive upside." 💎📊 🚀 NVDA | The Supercycle of the AI Era! 💚 🌀 Elliott Wave Supercycle Breakdown NVIDIA’s price action over the past two decades is a textbook example of a multi-decade Elliott Wave Supercycle — where technical , fundamentals , and Smart Money flows perfectly align to form a once-in-a-generation structure 🌎 Let’s break it down step-by-step 👇 Super Cycle Wave (1) — launched in the early 2000s, marking NVDA’s first growth phase during the birth of consumer GPUs 🎮. Super Cycle Wave (2) — deep correction into 2002, retracing a 0.786 Fibonacci, cleansing early euphoria and creating the foundation for institutional accumulation 💼. Then began the Super Cycle Wave (3) — the most powerful phase of all. Within it, we have distinct macro sub-waves: 1️⃣ Macro Wave (1) — ended in 2007 , aligning with the first institutional wave of adoption. 2️⃣ Macro Wave (2) — retraced 0.618 in 2008 , coinciding with the global financial crisis (perfect Smart Money shakeout). 3️⃣ Macro Wave (3) — the current dominant leg, fueled by exponential AI and data center growth . It’s extending toward the 3.618 Fibonacci extension (~$256) , confirming wave strength and institutional conviction. 4️⃣ Macro Wave (4) — expected between 2026–2027, likely retracing 0.236–0.382, a natural cooling period before the next breakout. 5️⃣ Macro Wave (5) — projected to rally toward 4.618 extension (~$2,500) , completing Super Cycle Wave (3) near 2029 🏁 From there, a larger Super Cycle Wave (4) correction could unfold before the final parabolic Super Cycle Wave (5) run to the 5.618 Fibonacci extension (~$26,000) — the climax of NVDA’s decades-long AI expansion super-trend 🌕 💰 Smart Money Concept (SMC) Perspective The chart structure clearly shows Smart Money accumulation patterns in every correction phase: Re-accumulation ranges appeared at every 0.618 retracement level 📊 Liquidity grabs below previous swing lows before strong impulsive moves ⚡ Fair Value Gaps (FVGs) filled during corrections, creating perfect liquidity imbalances that institutional players exploit Currently, NVDA trades near a premium zone of Macro Wave (3), but Smart Money will likely reaccumulate during the upcoming Macro Wave (4) discount phase (2026–2027). Expect Order Block re-tests and liquidity sweeps around discounted Fibonacci retracement zones (0.236–0.382) before the next major rally 📉➡️📈 📈 Price Action Structure NVDA’s macro structure remains strongly bullish: The multi-decade trend has respected every higher high and higher low sequence since 2008. Each impulse is followed by a healthy re-accumulation range, never breaking long-term structure. Expect distribution near the $250–$300 (split-adjusted) region as Wave (3) matures, followed by a macro correction that offers generational entries for long-term investors 🧠 🔢 Fibonacci Confluence & Technical Harmony Fibonacci has been the invisible hand guiding NVDA’s growth 👇 0.786 retracement (2002) → deep liquidity reset 0.618 retracement (2008) → institutional re-entry 3.618 extension (256) → current macro resistance target 4.618 extension (2500) → Super Cycle Wave (3) final target 5.618 extension (26K) → ultimate Super Cycle Wave (5) projection Each impulse and retracement aligns perfectly with Fibonacci’s geometric rhythm , proving the power of confluence between time, price, and sentiment. 🧠 Fundamentals — The Energy Behind the Waves Behind the technicals lies unmatched fundamental growth : 💾 AI & Data Centers: NVIDIA is the core infrastructure for modern AI compute and cloud training workloads. 🧩 CUDA Ecosystem: A software moat that ties developers and enterprises directly to NVIDIA’s architecture. 🌐 Omniverse & Robotics: Positioning NVDA as a leader in 3D simulation, robotics, and digital twins — future trillion-dollar markets. ⚙️ Strategic Partnerships: Expanding across hyperscalers, automotives, and enterprise AI. Each innovation wave fuels a new Elliott Wave impulse , with the AI revolution now driving the strongest macro leg in NVDA’s history. ⚡ Macro Outlook & Timeline ✅ Now (2025): Completing Macro Wave (3) of Super Cycle (3) → heading toward $256 target ⚠️ 2026–2027: Macro Wave (4) correction to 0.236–0.382 (Smart Money entry) 🚀 2028–2029: Macro Wave (5) push → Super Cycle (3) peak near $2,500 🌊 2030–2032: Super Cycle (4) correction — consolidation phase 💎 2035–2040+: Super Cycle (5) → ultimate 5.618 target near $26K 💬 Final Thoughts "Every correction is a setup for the next expansion. Smart Money buys fear — not euphoria." NVIDIA is the heartbeat of the AI revolution , the core of data-driven computing , and a living Fibonacci sequence in motion. As long as fundamentals stay aligned with the wave rhythm, NVDA’s Supercycle will continue to redefine what’s possible in long-term growth. 🌌 #NVDA #ElliottWaveAnalysis #SmartMoneyConcept #PriceActionTrading #FibonacciMagic #AIRevolution #StockMarket #Investing #TradingViewCommunity #TechSupercycle #NVDAtoTheMoon #LongTermInvesting 💬 Traders, analysts, and wave watchers — your insights matter! Have you spotted NVDA’s next move? Drop your Elliott Wave counts, confirmations, or constructive critiques below 👇 Let’s discuss NVIDIA’s structural evolution, AI-driven Supercycle, and long-term growth potential together 🚀💚 Every comment adds perspective — let’s decode this massive wave as a community! 🌊📈 — Team FIBCOS ⚡💎NVDA may present a compelling buying opportunity, as our outlook suggests the upside target of 256 has not yet been fully realized. However, ensure that risk is managed effectively at all times.
fibcos
تحلیل نهایی موج بزرگ طلا: آینده قیمت XAU/USD تا سال ۲۰۵۰ و فراتر از آن
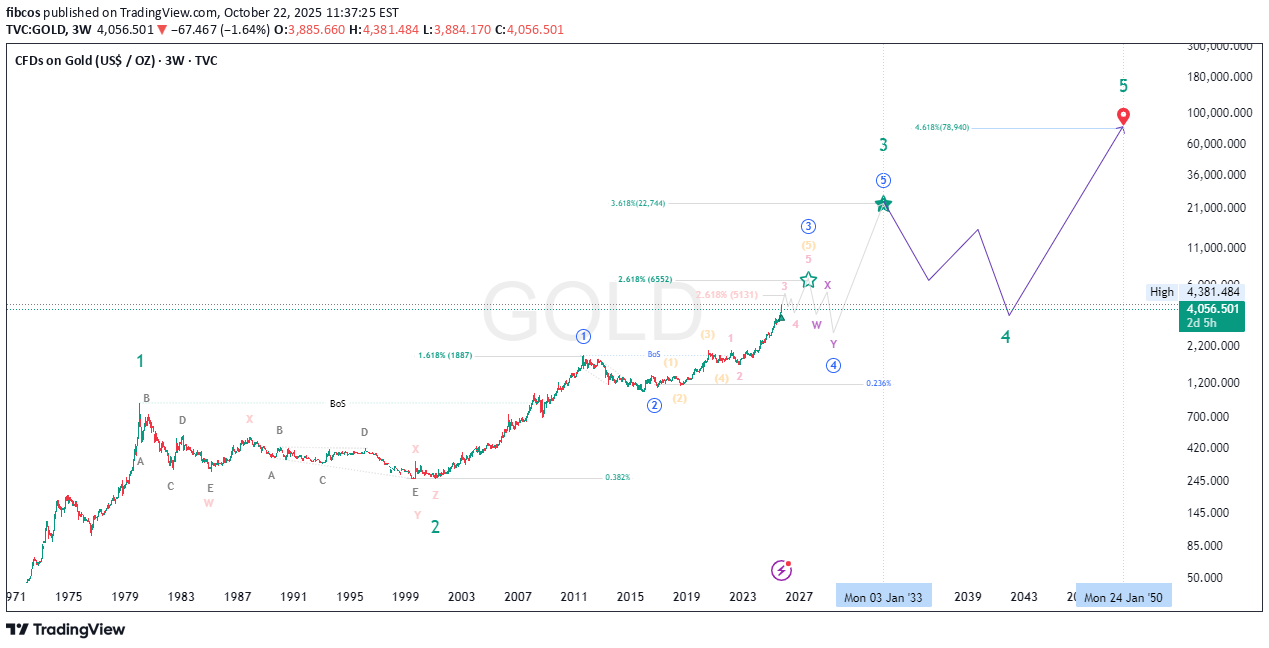
🟡 GOLD (XAU/USD) – FINAL GRAND CYCLE ANALYSIS “The Rise of Real Money in a Failing Fiat World” Elliott Waves | Fibonacci | Smart Money | Macro Fundamentals | Market Psychology 📅 Date: October 22, 2025 📍 Current Price: ~$4,039/oz ⏳ Time Horizon: 1970s to post-2050 🎯 Focus: Multi-decade Elliott Wave structure signaling the endgame for fiat currencies 🌐 SUPER CYCLE NARRATIVE – GOLD’S MONETARY METAMORPHOSIS 🔵 Wave I (1971–1980): The Rebirth of Real Money Gold's first major secular rally began when the Bretton Woods system collapsed and President Nixon ended the U.S. dollar’s convertibility to gold in 1971. Gold soared from around $35 to nearly $875 by 1980. This wave was driven by runaway inflation, the oil embargo, and shattered confidence in fiat money. 🔴 Wave II (1980–1999): The Great Fiat Illusion Following the 1980 peak, gold entered a brutal 19-year corrective phase, falling to the $250 zone. During this time, the U.S. dollar gained strength, Volcker’s interest rate hikes reined in inflation, and a new era of debt-based prosperity and stock market euphoria unfolded. Gold was dismissed, even by central banks who sold reserves. Structurally, this corrective phase formed a complex WXYXZ pattern , setting the groundwork for the massive Wave III rally. 🟢 Wave III (1999–~2033): The Fiat Reckoning Has Begun This is the longest and most powerful supercycle wave and the one we are currently in. It is subdivided into five impulsive macro waves. As of now, gold is deep within Wave iii of III , the most explosive phase of the entire structure. The current rally is no longer driven by inflation fears but by existential doubts about the long-term viability of fiat currencies. 📈 Wave I of III (1999–2011): The Institutional Accumulation Gold rose from around $250 to $1,920 over this period. Triggers included the dot-com bust, 9/11, the 2008 global financial crisis, and the launch of the first gold ETFs like GLD. This wave marked the beginning of institutional interest in gold as a systemic hedge. 📉 Wave II of III (2011–2015): The Disbelief Correction Gold corrected nearly 45%, bottoming near $1,050. The narrative shifted — QE hadn't caused hyperinflation, the stock market was booming again, and faith in the dollar resurged. Retail abandoned gold, but institutional buyers quietly accumulated from newly created demand zones. 🚀 Wave iii of III (2015–~2026): The True Price Discovery Phase This is where we are now. Since 2015, gold has exploded upward, driven by COVID-era QE, negative real interest rates, geopolitical instability, and major central banks accumulating gold for cross-border settlements outside the dollar system. We are currently in the middle of this wave — micro wave (3) of iii — with price around $4,039. According to Fibonacci projections, this wave is expected to peak near $6,552 , corresponding to the 2.618 extension level . If bullish momentum continues, gold could overshoot toward $22,744 , matching the 3.618 Fibonacci extension and marking the likely top of macro Wave III. In an extreme scenario where fiat trust collapses entirely, the 4.618 extension projects a possible target of $78,940 . All of these levels align with the upper bounds of the long-term logarithmic channel, validating both structure and projections. But most likely this target is for Wave V TOP . 🟣 Wave IV (Projected: 2026–2033): The Great Shakeout After the parabolic run of Wave iii, a deep multi-year correction is likely. This correction — Wave IV — may retrace toward the long-term red trendline and could coincide with a temporary return to “faith” in fiat through reforms like CBDC rollouts or aggressive fiscal pivots. This wave could resemble a WXY pattern or large ABC structure and may unfold alongside capital controls, deflationary pressure, and a resurgent tech or dollar narrative. However, this will likely be the last major buying opportunity before gold enters its final, euphoric revaluation. 🟢 Wave V (2033–2045+): The Final Blow-Off Top Wave V is expected to be driven by an overt crisis of confidence in the global fiat system. Scenarios could include: Mass adoption of gold-backed or commodity-tied digital currencies Loss of global trust in the USD as the reserve currency BRICS or emerging alliances introducing gold into cross-border settlements Global central banks returning to physical gold as a monetary base The upside potential here is monumental. The 4.618 Fibonacci extension already targets $78,940 , but under full systemic collapse or monetary reset conditions, gold could reprice toward $100,000–$250,000 per ounce — not as a bubble, but as a return to its role as sound, base-layer money. 📐 Fibonacci Milestones and Structure Alignment Each major wave has closely respected its corresponding Fibonacci extension. Wave I topped around the 1.618 level ($1,887) . The ongoing Wave iii appears on track to reach the 2.618 level ($6,552) . From there, macro Wave III could stretch toward 3.618 ($22,744) . If Wave V extends fully, a 4.618 projection leads to $78,940 — all within the bounds of the established logarithmic trend channel. In a full-blown systemic reset, price could break even higher. These levels are not speculative but grounded in structural alignment with Elliott wave geometry , Fibonacci mathematic s, and long-term institutional order flow . 🧠 Smart Money Concepts & Technical Validations Smart money activity has left clear fingerprints across this cycle. Each break of market structure (in 2016, 2020, and 2023) confirmed higher time-frame bullish continuation. Institutional demand zones — especially during the 2018–2019 consolidation and 2022 pullback — were respected to the dollar. This cycle isn’t retail-driven mania — it's a stealth institutional accumulation that’s now evolving into price discovery. 📊 Market Psychology Across the Cycle Investor sentiment has followed classic psychology stages: From 1999 to 2004, disbelief reigned: “Gold is dead.” Between 2005 and 2011 came growing awareness: “Gold might work again.” The 2011–2015 correction brought denial: “It was just a bubble.” Hope returned in 2016–2020 as price quietly rallied. From 2022 to 2026, euphoria dominates: “Gold will never go down.” Wave IV will likely bring fear and capitulation between 2026 and 2033. Finally, Wave V will ignite mania: “Gold to the moon!” 🚨 Final Synthesis: What This All Means We are living through the largest repricing of monetary value in modern financial history. Gold is no longer just an inflation hedge — it’s becoming a hedge against the system itself . The structure on the chart doesn't just map price — it maps the collapse of fiat trust and the return of monetary sanity. Gold is transitioning from: A commodity hedge → To a central bank hedge → To a currency hedge → And finally, to a system hedge The current leg — Wave iii of III — is nearing its climax. After a correction in Wave IV, Wave V could take gold into previously unthinkable territory, not because gold changed — but because everything else did. 📌 Final Position Summary We are currently in wave (5) of iii of III — the most powerful segment of the bull run The next Fibonacci target is $6,552 The broader Wave III could peak near $22,744 After a correction (Wave IV), the final wave could send gold toward $78,940 , or even into the $100,000–$250,000 zone under extreme monetary reset conditions This is not a mere forecast — it’s a macro-monetary blueprint for the coming decades. 🌊 "Those who understand the waves will ride them. Those who don’t will be swallowed by the tide." – FIBCOS 📘 Disclaimer: This is an educational market outlook based on technical and macroeconomic structure. It is not financial advice. Always do your own due diligence and risk management. #XAUUSD #Gold #GoldAnalysis #ElliottWave #Fibonacci #SmartMoneyConcepts #PriceAction #TechnicalAnalysis #MarketStructure #Commodities #InflationHedge #MacroEconomics #CentralBanks #BRICS #MonetaryReset
fibcos
پایان نزول تاریخی KDA؟ نشانههای تشکیل کف نسلی و بازگشت بزرگ!
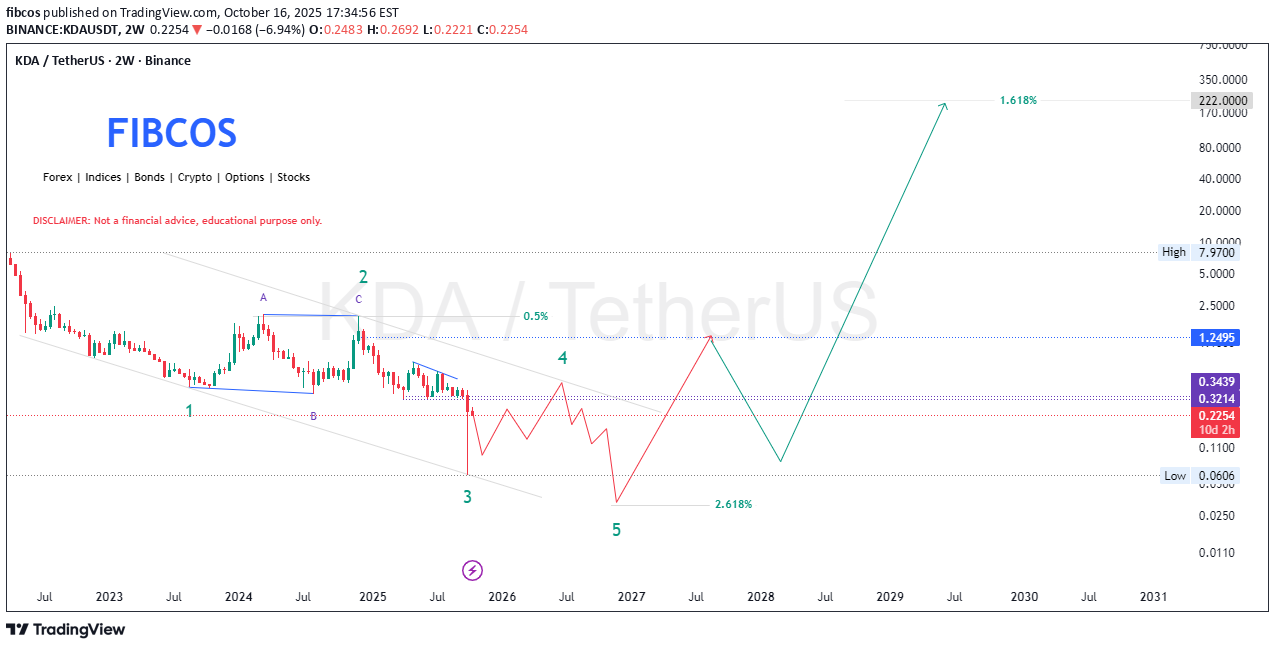
🚨 KDA/USDT - Approaching the End of Macro Wave 3 – Reversal Imminent? بعد ما یقرب من عامین من الانخفاض المستمر، Kadena (KDA) یبدو أنه فی المراحل النهائیة من هیکلها التصحیحی الکلی. باستخدام مزیج من نظریة موجة إلیوت , مفاهیم الأموال الذکیة (SMC) , أدوات فیبوناتشی ، و تحلیل حرکة السعر ، هناک أدلة دامغة على أننا قد نشکل أسفل الأجیال . The chart outlines a clean 5-wave Elliott impulse to the downside. With Wave 3 nearing completion in a historically strong منطقة الطلب (0.06 دولار - 0.03 دولار)، احتمال طویل الأجل عکس الاتجاه یتزاید. تتوافق هذه المنطقة أیضًا مع: امتداد فیبوناتشی 2.618 کامل، مستویات التراکم السابقة، اکتساح محتمل للسیولة تحت الموجة 3، Oversold market conditions likely visible on higher timeframes (RSI/MACD divergence). On the fundamentals side, Kadena continues to innovate with its بنیة شبکة PoW Chainweb عالیة الإنتاجیة ، العقود الذکیة التی یمکن قراءتها بواسطة الإنسان عبر میثاق والبنیة التحتیة المتنامیة لـ DeFi. It remains one of the most undervalued layer-1s in the market with صفر major مآثر أمنیة منذ إطلاقها. 🔮 إذا تم تأکید العکس ، الأهداف طویلة المدى تکمن فی: 1.25 دولار (0.5 تصحیح فیبوناتشی) 7.97 دولار (الارتفاع السابق) 222 دولارًا (1.618 امتدادًا کلیًا، إسقاطًا متعدد السنوات) قد لا یتم تنفیذ هذا الإعداد بین عشیة وضحاها، ولکن هذا هو نوع الهیکل الذی یتم تنفیذه الأموال الذکیة تبنی المواقف بصبر بینما یخشى قطاع التجزئة القاع. 📊 1. التقاء نظریة موجة إلیوت بالنظر إلى بنیة موجة إلیوت الکلیة: 🔹واضحة 5- موجة هبوطیة اندفاعیة یبدو أنه یتشکل: لقد تم تنفیذ الموجة 1 و 2 بالفعل. الموجة 3، کونها الأکثر عدوانیة، اکتملت أو على وشک الانتهاء. کان ارتداد الموجة 4 سطحیًا وتصحیحیًا (ربما علم/رایة هابطة). من المتوقع أن تکتمل الموجة 5 بجزء أخیر للأسفل— القاع المحتمل المتوقع قبل انعکاس قوی. 🔹ما بعد الموجة 5، أن موجة تصحیحیة ABC أو انعکاس اندفاعی أکبر من المتوقع (المسمى على الرسم البیانی)، مما یشیر إلى أ تحول الاتجاه الکلی . 🧠 2. مفاهیم الأموال الذکیة (SMC) 💰 مناطق التجمع: السعر یحوم فی منطقة الطلب (بین 0.06 دولار - 0.25 دولار). هذه المنطقة لدیها احتمال کبیر للتراکم المؤسسی کما تبیع التجزئة فی الخوف. 📉 عملیات اکتساح السیولة: تظهر حرکة السعر الأخیرة انخفاضًا حادًا move، ومن المحتمل أ انتزاع السیولة تحت أدنى مستویات التأرجح السابقة (تلاعب SMC کلاسیکی قبل الانعکاس). یتوافق "الربیع" المتوقع move من هذه المنطقة مع أنماط تراکم Wyckoff. 🔄 کسر الهیکل (BoS): الاختراق فوق الهیکل التصحیحی بعد الموجة 5 من شأنه أن یؤکد أ تحول هیکل السوق الصعودی . 🌀 3. تصحیحات وتمدید فیبوناتشی 🔹 امتداد فیبوناتشی: یبدو أن امتداد الموجة 3 قد وصل إلى مستوى 2.618% ، وهو مستوى إسقاط موجة إلیوت فی الکتب المدرسیة. وهذا یوفر التقاء عالیة ذلک الموجة 5 القاع قد یکون قریبا. 🔹 أهداف تصحیح فیبوناتشی: الارتداد إلى 0.5 - 0.618 منطقة فیبوناتشی (~ 1.25 دولار - 7.97 دولار) متوقع فی ارتفاع ما بعد الموجة. النهائی هدف التمدید 1.618 (~ 222 دولارًا) یمکن أن یحدث إذا تمت محاذاة دورة الثور الکلی ربما بحلول عام 2029. 🕵️♂️ 4. تحلیل حرکة السعر 📉 انهیار القناة الهبوطیة : اتبع السعر قناة هبوطیة ویقترب من الحد السفلی. غالبًا ما تؤدی الأعطال الکاذبة إلى انتکاسات عنیفة . 📈 الاختلاف الصعودی (من المحتمل على مؤشر القوة النسبیة) : إذا أظهر مؤشر القوة النسبیة أو مؤشرات الزخم الأخرى تباعدًا، فهذا یضیف تأکید لإعداد الانعکاس . 📌 المستویات الرئیسیة للمشاهدة : مقاومة : 0.3439 دولار، 1.25 دولار، 7.97 دولار یدعم : 0.13 دولار، 0.06 دولار، 0.03 دولار أ کسر وعقد فوق 1.25 دولار یمکن أن یشیر إلى بدایة أ الاتجاه الصعودی الکلی . 🔮 الأفکار النهائیة 🔁 من المحتمل أن نقترب من نهایة الدورة الهبوطیة الکلیة (الموجة 3) . 💼 مع علامات التراکم المؤسسی , التقاء فیبوناتشی ، و أساسیات صلبة **، KDA یمثل فرصة قویة غیر متماثلة . 🧨 إذا الموجة 5 یکتمل بالقرب من 0.06 دولار أمریکی - 0.03 دولار أمریکی، واحتمال الاتجاه الصعودی نحو 7.97 دولار أمریکی (الهدف الکلی الأول) وربما 222 دولارًا عروض (امتداد 1.618). نسبة R/R عالیة (المخاطرة/المکافأة) للمستثمرین على المدى الطویل. ⚠️ تنصل: هذا التحلیل هو نصیحة تعلیمیة ولیست مالیة. دائما DYOR (قم بالبحث الخاص بک). #KDA #KDAUSDT #Kadena #CryptoAnalogy #ElliottWave #SmartMoney #Wyckoff #TechnicalAnalogy #CryptoReversal #AltcoinAnalogy #PriceAction #Fibonacci #Layer1 #CryptoFundamentals #TradingSetup #LongTermHold #Accumulation #CryptoMacro #TradingEducation #نظریة_الموجة #العملة_المشفرة
fibcos
قیمت طلا کجاست؟ حمایت ۴۱۰۰ دلار حفظ شد، اهداف بعدی کجاست؟
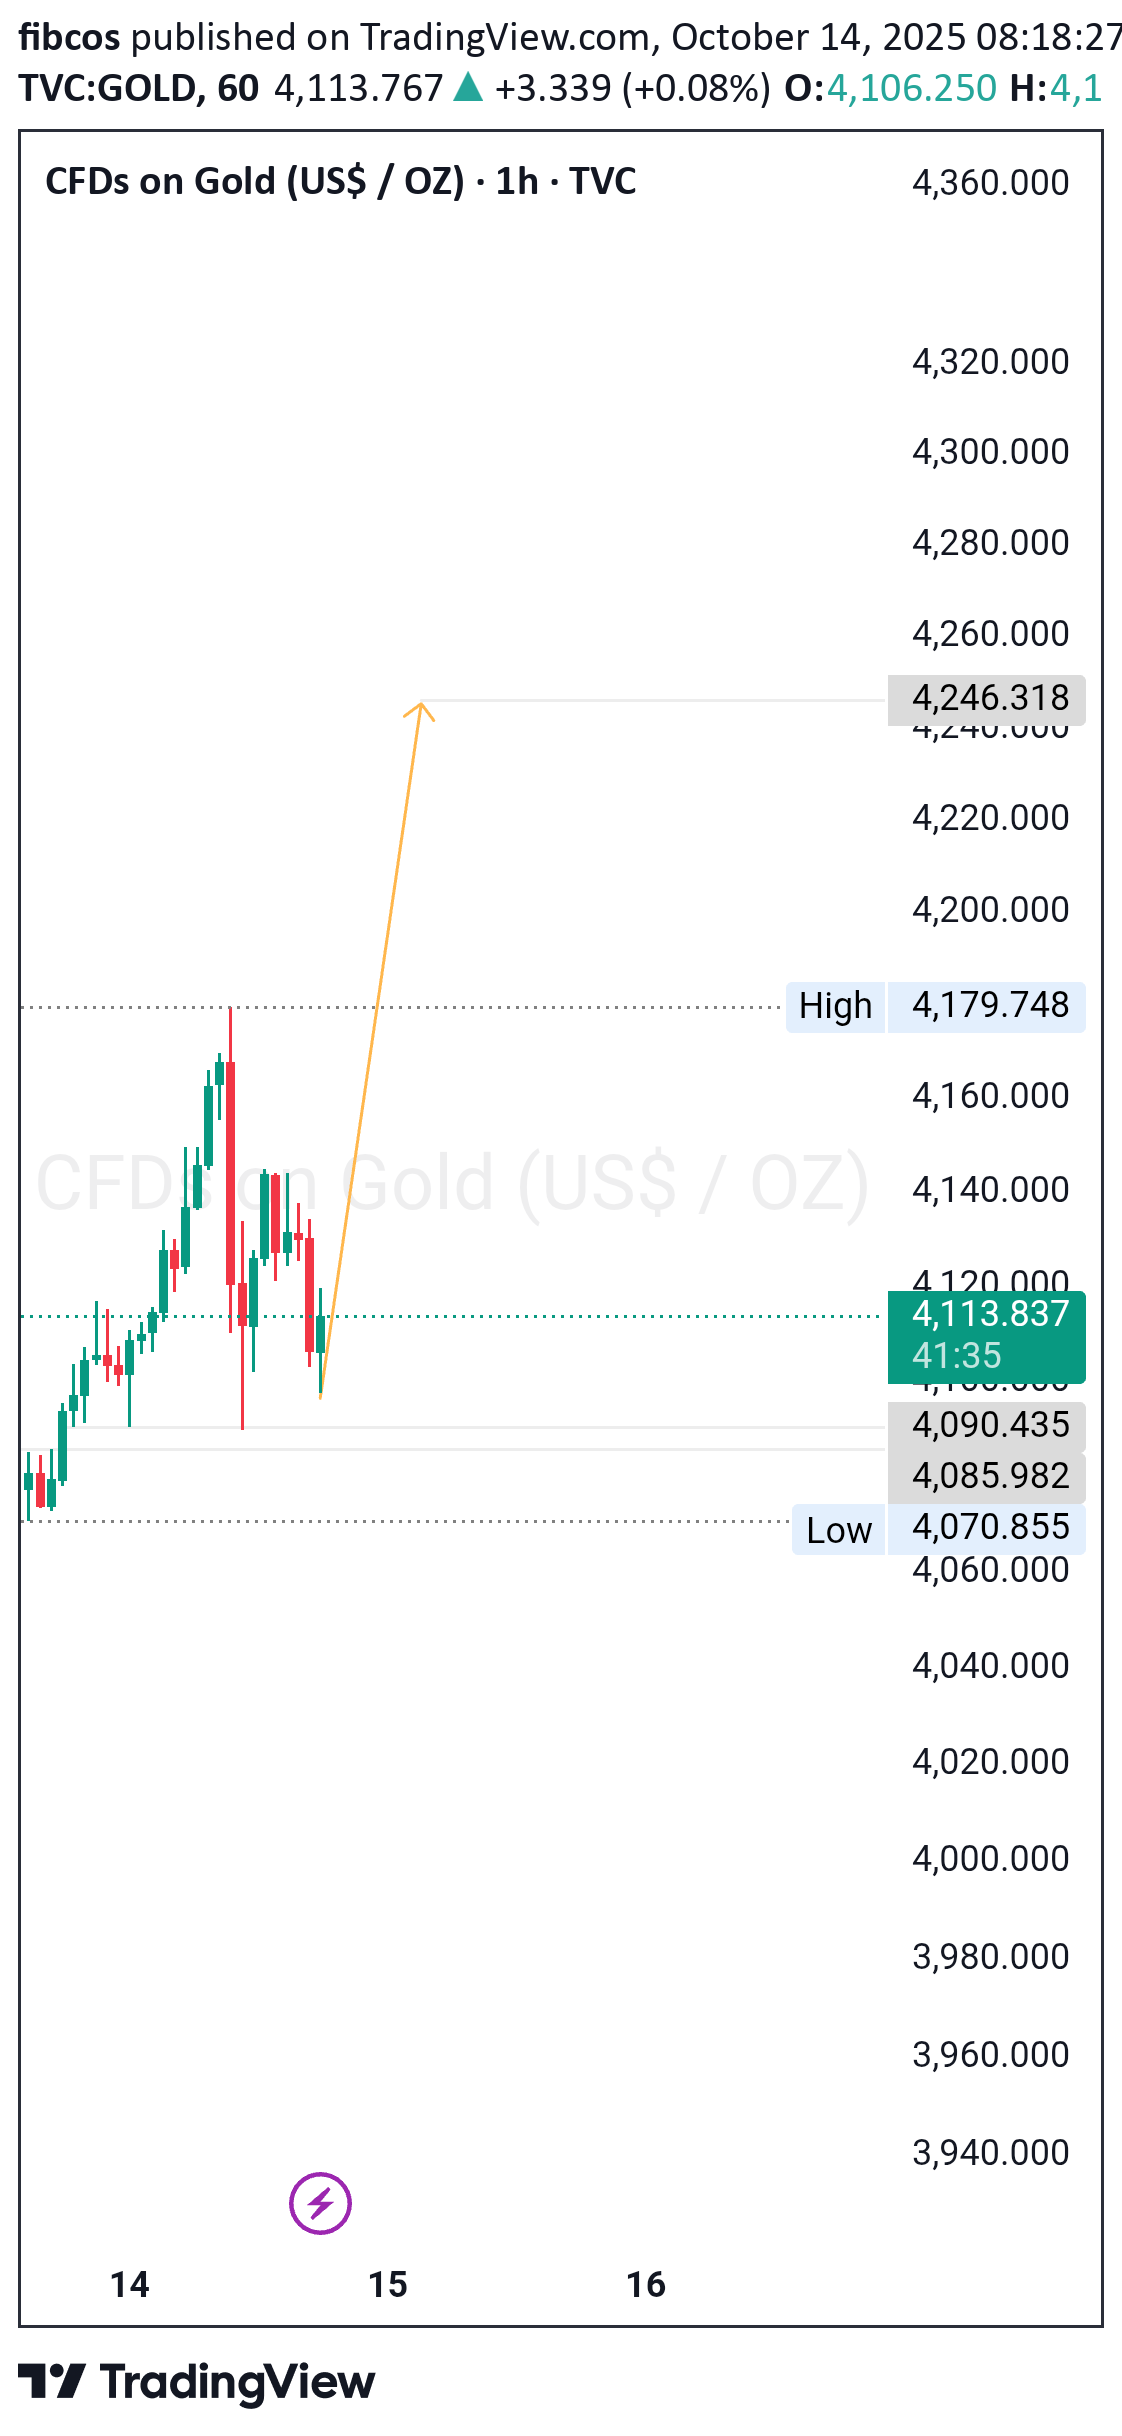
حافظ الذهب على قوته عند مستوى دعم قدره 4100 دولار أمریکی ویتماسک تحت مستوى المقاومة الذی یتراوح بین 4150 دولارًا و4180 دولارًا. یستهدف الاختراق 4200 دولار أمریکی. یظل الاتجاه الصعودی ساریًا فوق 4100 دولار؛ وتحته، یضعف الزخم.
fibcos
پیشبینی نهایی طلا: خیزش پول واقعی تا ۲۵۰,۰۰۰ دلار با رمزگشایی امواج بزرگ!

🟡 GOLD (XAU/USD) – FINAL GRAND CYCLE ANALYSIS "The Rise of Real Money in a Failing Fiat World" Elliott Waves | Fibonacci | Smart Money | Macro Fundamentals | Market Structure 📆 Date: October 12, 2025 📈 Current Price: ~$4,017/oz 🕰️ Timeframe: 1950s – 2060+ 🔍 Focus: Multi-decade forecast grounded in wave theory and fundamental macro shifts 🌐 SUPER CYCLE STRUCTURE – GOLD'S MONETARY EVOLUTION 🔵 Wave I (1971–1980): The Rebirth of Gold Gold surged from ~$35 to ~$850 after the collapse of the Bretton Woods system. Nixon ended USD-to-gold convertibility, exposing the world to pure fiat for the first time. Geopolitical shocks like the OPEC oil embargo and soaring inflation shattered trust in paper money. Gold reasserted itself as a monetary anchor , not just a commodity. 🔴 Wave II (1980–1999): The Great Rejection A 19-year bear market saw gold bleed down to ~$250. Volcker’s rate hikes tamed inflation; fiat regained trust temporarily. The dollar surged, stocks soared, and central banks sold gold reserves. This corrective wave reflected confidence in debt-based growth and fiat stability — a long, deceptive calm. 🟢 Wave III (1999–~2045?): The Real Money Renaissance This is the main secular bull market wave , subdivided into five impulsive macro waves. Gold is now in Wave iii of III — the most explosive, powerful phase — and will likely reprice in a way that reflects systemic risk, not just inflation. 📈 MACRO & MICRO STRUCTURE – CURRENT WAVE BREAKDOWN 🟢 Macro Wave I (1999–2011): The First Awakening Gold rose from $250 to ~$1,920. Triggered by the dot-com crash, 9/11, 2008 crisis, and early QE programs. This was the smart money accumulation phase , when institutions quietly began hedging systemic risk. 🔴 Macro Wave II (2011–2015): The Disbelief Phase Gold corrected 45% to ~$1,050. Fed tapering, rising dollar, and low CPI caused a temporary return to confidence in fiat. This reset investor sentiment and created institutional demand zones. 🟢 Macro Wave III (2015–~2026): The Fiat Reckoning (Now Unfolding) Subdivided into five micro-waves: Wave i (2015–2020): Broke out of 4-year base; fueled by Brexit, rate cuts, and China accumulation. Wave ii (2020–2022): ABC pullback post-COVID; reloaded from key SMC demand zones. Wave iii (2022–Now): We're here. Most vertical and extended move yet. Price currently at ~$4,000; next targets are $6,552, $22,744, and $78,940 , all aligning with Fibonacci extensions (2.618, 3.618, 4.618). Wave iv (projected 2026–2031): Likely major correction after parabolic move. Wave v (projected 2031–2045): Final blow-off top in Supercycle III. 🧠 FUNDAMENTAL DRIVERS – BY WAVE 🔹 Wave I Fundamentals (1999–2011): Post-dot-com capital rotation. 9/11 and geopolitical tension. 2008 GFC and collapse of banking trust. Introduction of QE and zero interest rates. Gold ETFs (like GLD) launched, enabling broader exposure. 🔸 Wave II Fundamentals (2011–2015): QE fatigue: “It didn’t cause inflation.” USD strength. Confidence returned to stocks. Retail dumped gold — but central banks quietly accumulated . 🔹 Wave III Fundamentals (2015–2026): $30+ trillion in global QE during COVID. Global real rates deeply negative. Energy crisis and supply chain fragility. War-driven risk premiums (Russia-Ukraine, Middle East, China-Taiwan). De-dollarization: BRICS accumulation, gold in cross-border settlements. Institutional shift toward real assets as fiat credibility wanes. 🔸 Wave IV (Projected 2026–2031): A likely correction tied to: CBDC adoption and capital controls. Temporary resurgence in tech or USD-based confidence. Reforms that appear to restore fiscal sanity. But this will be the last opportunity to enter before the endgame move. 🔹 Wave V (2031–2045+): Fiat collapse becomes mainstream. USD potentially dethroned. Gold-backed CBDCs or DeFi hybrids launched. Mass exodus from fiat into real money. Final revaluation of gold to reflect not inflation, but lost confidence in the entire financial system. 📐 FIBONACCI EXTENSIONS – PRICE TARGETS WITH WAVE ALIGNMENT 🟢 Wave I topped at 1.618 Fib ($1,887) — aligned with 2011 ATH. 🟢 Wave III (in progress): 2.618 Fib: $6,552 (expected peak of wave iii). 3.618 Fib: $22,744 (potential macro Wave III top). 4.618 Fib: $78,940 (if confidence fully collapses). 🟢 Wave V (projected): May extend toward $100,000–$250,000+ under systemic collapse or gold-backed reset conditions. All targets line up perfectly with logarithmic channel projections , Elliott wave extensions , and long-term order flow structure . 🧠 SMART MONEY CONCEPTS & PRICE ACTION CONFIRMATION ✅ BoS (Breaks of Structure) at each wave change validated bullish continuation (2016, 2020, 2023). ✅ Order Blocks and liquidity grabs created institutional entry zones — especially at 2018–2019 lows and 2022 dips. ✅ Demand zones respected across key Fibonacci retracements (0.382 and 0.618). ✅ Current wave iii is a textbook price discovery phase with minimal resistance. This entire market structure is institutionally driven , not retail fueled — a true stealth bull. 📊 MARKET CYCLE PSYCHOLOGY OVERLAY 1999–2004: Disbelief – “Gold is dead.” 2005–2011: Awareness – “Gold might work.” 2011–2015: Denial – “It’s just a bubble.” 2016–2020: Hope – “Maybe gold’s not done.” 2022–2026: Euphoria – “Gold will never go down.” 2026–2033: Fear → Capitulation – Wave IV 2033–2045: Mania – “Gold to the moon!” — Wave V blow-off. 🚨 FINAL SYNTHESIS We are witnessing the greatest revaluation of monetary value in modern history . Gold is transitioning from: A hedge against inflation → to A hedge against central banks → to A hedge against the entire fiat system. 📌 Final Position Summary: 🔄 Current Location: Wave iii of III of Supercycle III 🎯 Immediate Target: $6,552 (2.618 Fib) 💡 Medium-Term: $22,744 (3.618 Fib) 🔥 Parabolic Scenario: $78,940 (4.618 Fib) 💀 Systemic Reset Target: $100,000–$250,000+ 🧠 Conclusion: This is not just a chart. This is a map of the collapse of fiat trust and the ascendance of sound money . Gold is no longer just an asset — it’s insurance on the system. 🌊 "Those who understand the waves will ride them. Those who don’t will be swallowed by the tide." - FIBCOS 📘 Disclaimer: This is a structural, educational market outlook. Not financial advice. Please do your own due diligence and risk management. #XAUUSD #Gold #GoldAnalysis #ElliottWave #Fibonacci #SmartMoneyConcepts #PriceAction #TechnicalAnalysis #MarketStructure #Commodities #InflationHedge #MacroEconomics #CentralBanks #BRICS #MonetaryReset🟡 Gold Following Bullish Structure — Short-Term Target in Sight Gold continues to follow the bullish path outlined in our analysis, with price action progressing steadily toward the short-term target, though it hasn’t been reached yet. The structure remains intact, supported by favorable momentum and technical alignment. As long as key support levels hold, we expect continuation toward the initial objective. 🔭 The primary long-term target remains significantly higher, reflecting the broader bullish thesis driven by both technical and macroeconomic factors.
fibcos
KDA آماده انفجار: تحلیل کامل موج الیوت، اسمارت مانی و پتانسیل 10 برابری!

🔍 1. نظریة موجة إلیوت – التقاء الموجة من الرسم البیانی: یمکننا أن نلاحظ بوضوح نمطًا تصحیحیًا معقدًا یشکل هیکل WXYXZ أو ثلاثی ثلاثی. تشیر تسمیات الموجة (A، B، C باللون الأحمر/الأزرق) إلى أن السوق ربما أکمل التصحیح الکلی. تُظهر حرکة السعر الحالیة بدایة محتملة لموجة اندفاعیة، مما یمثل بدایة الموجة 1 من دورة صعودیة جدیدة 📈. 🧩 نقاط الالتقاء الرئیسیة: یبدو أن المحطة الأخیرة (الموجة C) قد انتهت بنموذج وتد هابط، وهی إشارة انعکاس کلاسیکیة. من المحتمل أن یکون هناک تباعد صعودی على مؤشرات الزخم (غیر موضح ولکن یتم استنتاجه)، مما یدعم اکتمال الموجة. 💹 2. تحلیل حرکة السعر تشکل حرکة السعر هیکلًا أساسیًا یتراوح بین 0.32 دولارًا أمریکیًا و0.34 دولارًا أمریکیًا مع: عملیات إعادة اختبار متعددة لمنطقة الطلب (تم تحدیدها حول 0.3214 دولار و0.3439 دولار). شمعة صعودیة قویة بالقرب من القاع، مما یدل على التراکم المؤسسی. لقد اخترق السعر الحالی (0.3704 دولارًا) بالفعل نمط الوتد الهابط (الموجة D إلى E)، والذی غالبًا ما یسبق التحرکات المتفجرة. 📌 الهیکل قصیر المدى: إن الاختراق فوق المقاومة الثانویة عند 0.41 دولار أمریکی سیؤکد نمط الانعکاس الصعودی. تم تحدید الأهداف المستندة إلى مناطق PA التاریخیة عند 1.14 دولارًا و1.24 دولارًا و2.48 دولارًا و3.51 دولارًا 📍. 📐 3. تصحیحات وتمدید فیبوناتشی دعونا نحضر بعض فیبوناتشی magic ✨: إذا أخذنا قمة الموجة (B) وأدنى موجة (C)، فإن مستویات الارتداد المحتملة تتماشى مع: 0.618 فیب عند 1.14 دولار تقریبًا ✅ 1.0 فیب بسعر ~2.48$ ✅ 1.618 فیب عند 3.51$ تقریبًا تتوافق مستویات فیبوناتشی هذه بشکل جمیل مع مناطق مقاومة هیکل الأسعار، مما یظهر التقاء بین الألیاف وهیکل السوق. 📊 هدف امتداد فیبوناتشی: من المتوقع أن یکون الحد الأدنى 5x-10x move من السعر الحالی، مما یقربنا من 3.50 دولارًا أمریکیًا+، بما یتماشى مع الامتداد major 1.618. 🧠 4. مفهوم الأموال الذکیة (SMC) دعونا نتحدث عما قد تفعله "الأموال الکبیرة" 🧠💰: ✅ تحدید مرحلة التراکم: یتراوح السعر بعد تخفیض السعر لفترة طویلة. السیولة تجتاح یشیر ما دون أدنى مستویاته السابقة إلى أن الأموال الذکیة صممت فخًا هابطًا لملء الطلبات. کسر الهیکل (BoS) معلقة فوق 0.41 دولار، مما یؤکد تحول الأموال الذکیة من مرحلة التراکم إلى مرحلة الربح. 🎯 إدخال الأموال الذکی المثالی: نطاق أقل من 0.40 دولار. 📈 هدف السیولة التالی: 1.24 دولار (أعلى مستویات متساویة تشکلت خلال منتصف عام 2024). 🌐 5. أساسیات Kadena (KDA) Kadena عبارة عن blockchain من الطبقة الأولى یتمیز بنموذج PoW (إثبات العمل) المختلط مع قابلیة التوسع عبر Chainweb. 📌 الأساسیات الصعودیة: قابلیة التوسع: یمکن معالجة 480 ألف+ TPS عبر سلاسل متعددة. الأمان: یعتمد على إثبات العمل (PoW)، مما یجعله أکثر أمانًا من العدید من سلاسل إثبات الحصة (PoS). العقود الذکیة: تستخدم Pact، وهی لغة عقود ذکیة سهلة القراءة وآمنة. توسیع النظام البیئی: زیادة مشارکة DeFi وNFT وDAO. التمویل الأخیر: إذا کان هناک استثمار حدیث فی رأس المال الاستثماری أو الاستثمار فی المؤسسة (راجع آخر الأخبار)، فسیدعم ذلک حالة صعودیة. 🚀 المحفزات التی یجب مراقبتها: شراکات جدیدة أو إطلاق major DApps. قوائم التبادل أو منح النظام البیئی. ارتفاع المعنویات فی سوق العملات البدیلة الأوسع. 📈 الأفکار النهائیة والتوقعات 🔥 تتماشى الأساسیات الفنیة + SMC + مع إمکانات major move. 🧭 النظرة الإستراتیجیة: 🎯 منطقة الشراء: 0.32 دولار - 0.38 دولار (نطاق التراکم) 🚨 تأکید الاختراق: أعلى من 0.41 دولار 🚀 الأهداف: 1.14 دولار ✅ (0.618 فیب + الهیکل) $2.48 ✅ (1.0 فیب + الهیکل) 3.51 دولار ✅ (1.618 فیبوناتشی + مقاومة ماکرو) "کلما کبرت القاعدة، زادت المساحة" - ویبدو أن Kadena یبنی قاعدة قویة 👷♂️🧱 ⚠️ إخلاء المسؤولیة: هذا للأغراض التعلیمیة فقط. لیست نصیحة مالیة. قم دائمًا بإجراء الأبحاث الخاصة بک (DYOR) وقم بإدارة المخاطر بشکل مناسب. التشفیر متقلب 🔥. #KDA #KDAUSDT #Kadena #Altcoins #CryptoAnalogy #ElliottWave #WaveTheory #PriceAction #SmartMoneyConcepts #SMC #Fibonacci #TechnicalAnalogy #CryptoTrading #CryptoCharts #BullishSetup #AccumulationPhase #BreakoutTrade #10xPotential #أساسیات_التشفیر #الاستثمار على المدى الطویل #SwingTrading #TradingViewCommunity
إخلاء المسؤولية
أي محتوى ومواد مدرجة في موقع Sahmeto وقنوات الاتصال الرسمية هي عبارة عن تجميع للآراء والتحليلات الشخصية وغير ملزمة. لا تشكل أي توصية للشراء أو البيع أو الدخول أو الخروج من سوق الأوراق المالية وسوق العملات المشفرة. كما أن جميع الأخبار والتحليلات المدرجة في الموقع والقنوات هي مجرد معلومات منشورة من مصادر رسمية وغير رسمية محلية وأجنبية، ومن الواضح أن مستخدمي المحتوى المذكور مسؤولون عن متابعة وضمان أصالة ودقة المواد. لذلك، مع إخلاء المسؤولية، يُعلن أن المسؤولية عن أي اتخاذ قرار وإجراء وأي ربح وخسارة محتملة في سوق رأس المال وسوق العملات المشفرة تقع على عاتق المتداول.