derJessie
@t_derJessie
ما هو الشيء الذي ننصحك بشراءه من المواد الغذائية؟
سابق في الشراء
پیام های تریدر
مرشح
نوع الإشارة

derJessie

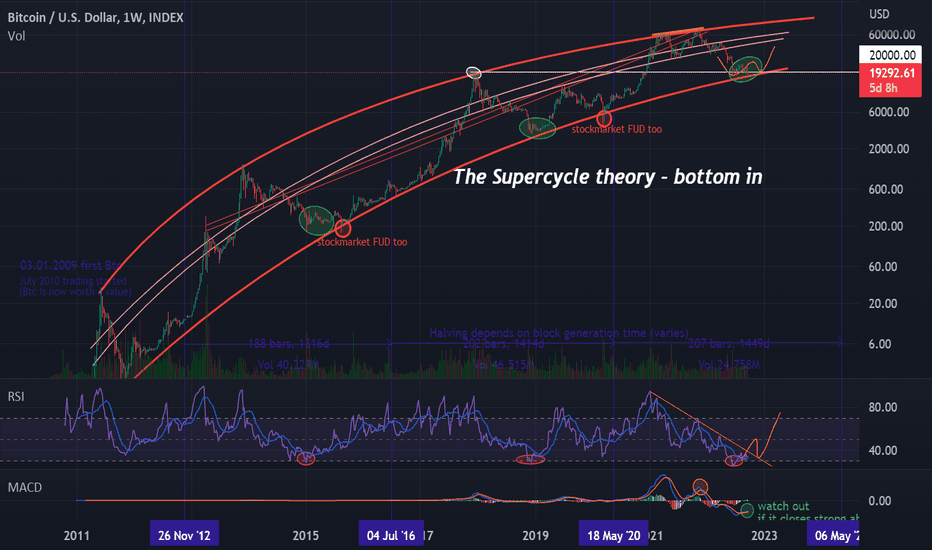
Bitcoin Supercycle theory - bottom in Bull theory – Bottom is already in for Bitcoin BTCUSD There are severeal technical indicators and measurements that suggest it could be. Firstly, the 50-week MA already crossed the 100-week MA. Each time this occured, the bottom was already in, both times as the weekly RSI dipped into oversold conditions. The price behavior has also been similar to the 2014 bear market for months with a drawdown of -53% below the 50-100WMA. (-But there is more time for that special fractal in another post.) Secondly, this current level happens to be a 0.786 Fibonacci Retracement of our entire run up from Covid-19 to the November top in addition as it is the support oft he previous all time high(2017). Furthermore sitting right now on the weekly 300MA. The Fear and Greed Index has only registered prolonged periods in Extreme Fear(below 10) as we have witnessed at the 2018 capitulation bottom and the 2020 Covid-19 selloff. Therefore the capitulation happened in June, with Luna (+UST), the depegging of USDT, 3AC, blockfi, Celsius… which are all max fear events. But everyone is now expecting 13-15k thinking we are in the middle of a bear market rally. While the GBTC Grayscale Bitcoin Trust value sitting already at chart comparable 11k. From technical analysis we couldn’t have bottomed more. Even on chain indicators signal the bottom is near. NUPL, RHODL Ratio, Puell Multipli, Entity adjusted Dormancy-Flow, MVRV-Z Score, 2Year MA Multiplier, CBBI-Bull Run Index. We have already seen arguably the most extreme network capitulation in Bitcoin‘s history, with now also a Hash Ribbons blue ball on the daily timeframe. Bitcoin is trading at a fair value. I am still hoping for an expanding flat 3-3-5 elliot wave correction, a double three WXY pattern, or even a simple overshooting B of an ABC. But if that 17,6k gets structural taken out we are not talking about recession but deflationary depression and just the start of a longer bear market. Fortunately the global narrative is shifting. People are now saying we are going into a deep recession. CNBC‘s Cramer saying to avoid all speculative investments like crypto, while the worst is priced in already. It starts to look like the main worry is becoming recession with deflation and not inflation now. That idea gets strengthened by US-CPI showing a second month of decline. Based on the 5-year break-even inflation rate, a leading indicator, it can already be said with certainty that we have seen the short-term peak in inflation. And that inflation is expected to recover further through 2023. Keep in mind every time inflation tops - Stock market rallies! Once the consumer price index print comes in significantly lower (September~7,9% but October ~7%) the stage will be set for a Powell flip flop. FED pivots systematically lead to strong rallies. So November FOMC potentially for a midterm or year-end Christmas rally. This means that the Fed will step back on better CPI-data and inflation will eventually start running again in 2023. Nobody does see a fruitful future for investments right now. To trick the retail there is no need for a positive narrative so everyone keeps being bearish. Only technical analysis matters. Afterwards we will see what the news catalyst was. Btc may range more than equities first, then rotation into more risk happens later. Hence Bitcoin Dominance will rise and Altcoins will pump after Bitcoin. But Btc is not yet in a multi-year bear market within its 4 year cycle because BTC.D would be at that point much higher while we are seeing new 4 year lows. Something is different. As a trader you have to adapt the possibilities. Invalidation of that bull scenario if we set a new low in Bitcoin. Then there will be much bigger problems in the market. So all eyes on the DXY and the behavior oft he FED, because Btc is at this time just the risk-taking follower of Nasdaq and SPX. Special greetings to Blockchain Backer, following him for almost a year.Comment: Nothing changed, BTC still in the range. Oscillators show it may take a while. My beds are that 17.6k will be the bottom if the global economy will allow that to remain true in the next months. My advice, don't listen to fud from the news around you. Stick to your plan and don't forget every Wyckoff Accumulation has a spring (at least a second test of that low). At 18k there are a lot of liquidations, stay alert.Comment: In the last few days we have seen another media capitulation event. First the dispute between Binance(CZ) and FTX(SBF) and then the unreal bankruptcy of Alameda and FTX Group(second largest crypto exchange). It is an absolute scandal that speaks against the industry and for much-needed regulation. How the consequences will affect the market and whether other companies will go bankrupt as a result is not yet foreseeable. Fear across the market with USDT depegging again, confidence is at an all time low. There is extreme skepticism of crypto right now. Who in their right mind would buy? Well, there has never been a bottom that is exiting, they are always horrifying. Chances of it being bottoming formation have dropped drastically after 17.6k has been taken out structurally. The Wyckoff Accumulation schematic with PO3 is the only last bullish hope. For this, 21.6k must be reached as quickly as possible with an impulsive bullish upward movement. A weekly close back inside the range would be a good sign. If we don't get consistently above 18.5k BTC again in the near future, this was just the bearish retest by positive falling inflation numbers and we will see much lower prices and spend even more time down here until next halving in 2024. Everyone calling 10-12k next targets may be right as a stock index correction can be expected. Don't forget, there is also a CME Futures opening gap at 9.7k BTC from 07/27/2020. Crazy times but stick to your plan.Comment: Nothing changed - volume decreases. Let's see if the new year invalidates this idea!Comment: Initial range target hit. Update: Small changes in expansion size after new impulse structure.

derJessie

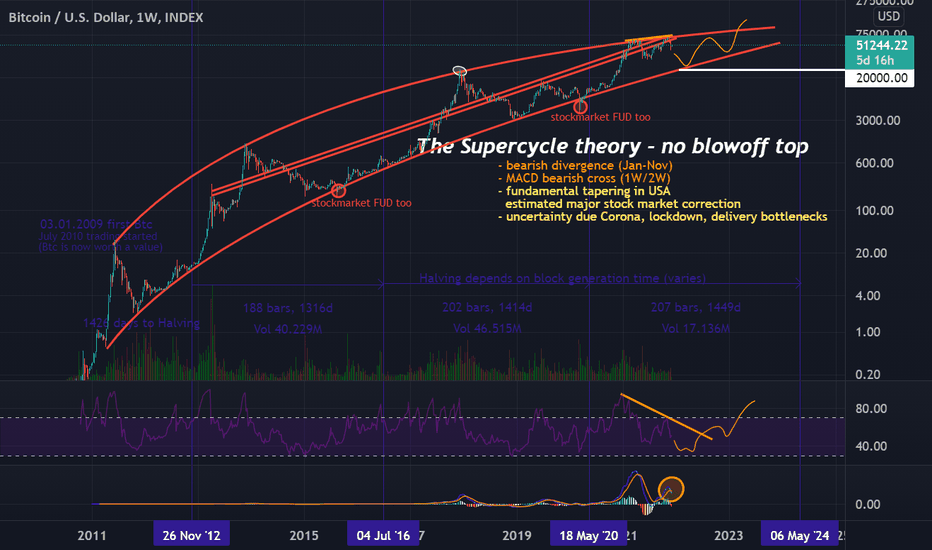
BTCUSDBEARISH المشاعر والخوف فی السوق ، وبالتالی فإن التوقعات الأقل ربحیة ممکنة للمستقبل. وقد توقع حشد التشفیر قمة مکافئ فی الربع الرابع 2021 ، مماثلة لأعلى 2013 و 2017. یکرر التاریخ نفسه ولکنه سیکون سهلاً للغایة ویمکن التنبؤ به لجمیع المشارکین فی السوق. سبب نموذجی لعدم حدوث ذلک بالضبط. المشکلة هی أنه لیس لدینا دورات کافیة لمقارنتها لمعرفة کیف یتغیر Bitcoin و Crypto مع نموه. مع ارتفاع درجة حرارة سوق التشفیر الکلی ، لدینا دورات تمتد/إطالة. هذا یعنی أن لدینا أشواط ثور أطول تلیها سوق الدب الأقصر. کما أنه أقل عائدًا على المدى القصیر بسبب الزخم البسیط الأقل. هناک احتمال أنه نظرًا لأننا وصلنا إلى إجمالی ثمن أسرفیتها فی السوق البالغ 1 تریلیون فی ینایر 2021 ، فإننا فی دورة طویلة super دون أن نرى قمة تفجیر مرة أخرى. قد یعنی ذلک توقعات هبوطیة للأسابیع المقبلة و Q1 2022 إذا لم نر أعلى أعلى حتى ذلک الحین. إن المشغل لهذا الافتراض هو مؤشرات على التحلیل الفنی. وخاصة الوصول إلى المنحنى العلوی لوغاریتمی red مع خطین من الدعم/المقاومة قطری فی الوسط. تم توسیع هذا منذ عام 2011 وکان قادرًا على التنبؤ بنطاق السعر بعد ذلک. هذا من شأنه أن یأخذنا إلى أدنى حد أقصى قدره 20 ألف دولار لکل 3> خلال الأشهر القلیلة المقبلة. أیضا إعادة اختبار white أبرزت عالیة من 2017 تشغیل. لم یکن هناک مثل هذا الاختبار أبدًا ، ولکنه سیتناسب مع نظریة الدورة super. المؤشرات المتقدمة هی اختلاف هبوطی برتقالی فی مؤشر القوة النسبیة (انخفاض مؤشر القوة النسبیة فی نفس الوقت الذی یرتفع فیه الأسعار) من أعلى ینایر (65 ألفًا) إلى أعلى (69 کیلو). على الرغم من ارتفاع الأسعار ، لم یعد هناک قدر کبیر من الحجم والقوة الشرائیة فی السوق. هذا یعنی أن السوق قد یواجه انعکاس الاتجاه وأهداف منخفضة السعر. یشیر الصلیب الهبوطی الأزرق فی MACD (التقارب المتوسط المتحرک/الاختلاف) إلى ذلک أیضًا. فی خط الزناد للتحلیل الفنی ، هناک أسباب لهذا التصحیح الهبوطی بسبب التأثیرات الأساسیة الخارجیة التی یمکن أن تستمر فی أن یکون لها تأثیر سلبی على جمیع الأسواق المالیة ، الموصوفة باللون الأصفر. لا یرید Nobody أن ینتهی الحلم بالتهویة فی الوقت الحالی ، ولکنه یکون هناک super للدورة الناتجة عن النتیجة التی یتم تبنیها بشکل جید. حتى لو کان ذلک یعنی أنه لیس لدینا ضربة مکافئة کبیرة دون حجم کبیر وحتى لا تهتم بالوسائط حالیًا. تم رسم هذا التحلیل على الإطار الزمنی الأسبوعی. نتیجة لذلک ، یتم تقدیر بعض data ولیس دقیقًا. لقد تم تصحیح أسواق الأسهم. لقد لعب سیناریو الهبوط الأکثر منطقیة. فی الأیام المقبلة سأقدم التحلیل التالی.

derJessie

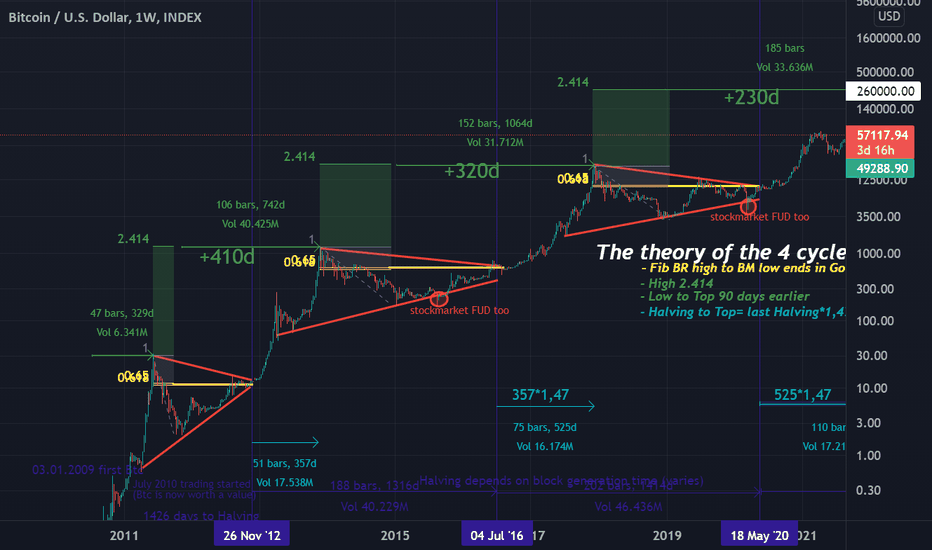
BtcusDAccorcord فی هذه النظریة ، بناءً على الافتراض الذی کان لدینا بالفعل 3 دورات (2011) لن نرى قمة للدورة الرابعة فی دیسمبر أو الربع الأول من عام 2022. لا یمکن أن یبدأ تاریخ النصف من النصف إلا أن النصف مهم للتحلیل ، حیث یمکن للمرء أن یتعرف على بنیة واضحة ، حیث أن المدى القوی للثورات النفسیة للشراء لا یمکن أن یبدأ إلا بعد فترة قصیرة من الإمداد. مع وقت تولید الکتلة الحالی ، یُفترض أن یکون تاریخ النصف التالی فی السادس من مایو ، 2024. لقد کان 357 یومًا من النصف الأول فی عام 2012 إلى أعلى السعر. لقد مر 525 یومًا من النصف التالی فی عام 2016 إلى القمة. زیادة زمنیة قدرها 1.47 مقارنة بالتشغیل الأخیر. إذا أخذت هذه القیمة کعامل ثابت یتعلق بالدورة السابقة ، فسوف تصل إلى المستهدف فی السعر التالی من نهایة یونیو إلى بدایة یولیو 2022. EACH CAME CYCLE TOP السابقین فی سوق الدب الذی یشکل المثلث أو العلم الثور فی الإطار الزمنی الأعلى. فی السنوات العشر الماضیة ، کانت هناک قیمتان فی الخارج ، مدفوعین بـ FUD (الخوف ، عدم الیقین ، الشک) على جمیع الأسواق المالیة بسبب التأثیرات الخارجیة. إذا قمت بسحب راکبة فیبوناتشی من قمة بولرون إلى انخفاض سوق الدب ، فإن Triangle یمتد تمامًا نحو الجیب الذهبی الأصفر (0.618-0.65) بهدف 2.414. مما یؤدی إلى قمة خضراء فی نهایة الدورة الحالیة حوالی 260k +-30k. مجموعة واسعة لأننا نبقى فقط فی هذه المرتفعات لبضعة أیام ویستند السعر على المشاعر التی تسیطر علیها الجشع والاهتمام فی جمیع أنحاء العالم. بعد ذلک ، هناک 329 یومًا حتى Bull Run Top 2011. مرة أخرى من سوق الدب إلى أعلى مستوى فی نهایة عام 2013 ، أصبح الآن 742 یومًا ، أی 410 یومًا أکثر من المدى السابق. وصل هذا الجزء العلوی من الثور المکافئ مرة أخرى حوالی 90 یومًا فی الدورة التالیة المضافة من الدورة السابقة. هذا من شأنه أن یجلبنا أیضًا إلى القمة فی أواخر یونیو وحتى أوائل یولیو 2022 التی تم وضع علامة علیها باللون الأخضر. تم رسم هذا التحلیل على الإطار الزمنی الأسبوعی ، وبالتالی فإن تاریخ النصف غیر صحیح وجمیع القیم المحسوبة الأخرى هی +-6 أیام. نتیجة لذلک ، یتم تقدیر بعض data ولیس دقیقًا. هذه هی نظریتی الأولى. أهمیة المستثمرین هی التفکیر على المدى الطویل.
إخلاء المسؤولية
أي محتوى ومواد مدرجة في موقع Sahmeto وقنوات الاتصال الرسمية هي عبارة عن تجميع للآراء والتحليلات الشخصية وغير ملزمة. لا تشكل أي توصية للشراء أو البيع أو الدخول أو الخروج من سوق الأوراق المالية وسوق العملات المشفرة. كما أن جميع الأخبار والتحليلات المدرجة في الموقع والقنوات هي مجرد معلومات منشورة من مصادر رسمية وغير رسمية محلية وأجنبية، ومن الواضح أن مستخدمي المحتوى المذكور مسؤولون عن متابعة وضمان أصالة ودقة المواد. لذلك، مع إخلاء المسؤولية، يُعلن أن المسؤولية عن أي اتخاذ قرار وإجراء وأي ربح وخسارة محتملة في سوق رأس المال وسوق العملات المشفرة تقع على عاتق المتداول.