
Trendoscope
@t_Trendoscope

ما هو الشيء الذي ننصحك بشراءه من المواد الغذائية؟
سابق في الشراء
پیام های تریدر
مرشح
Trendoscope
HOW-TO: Auto Harmonic Screener - UltimateX
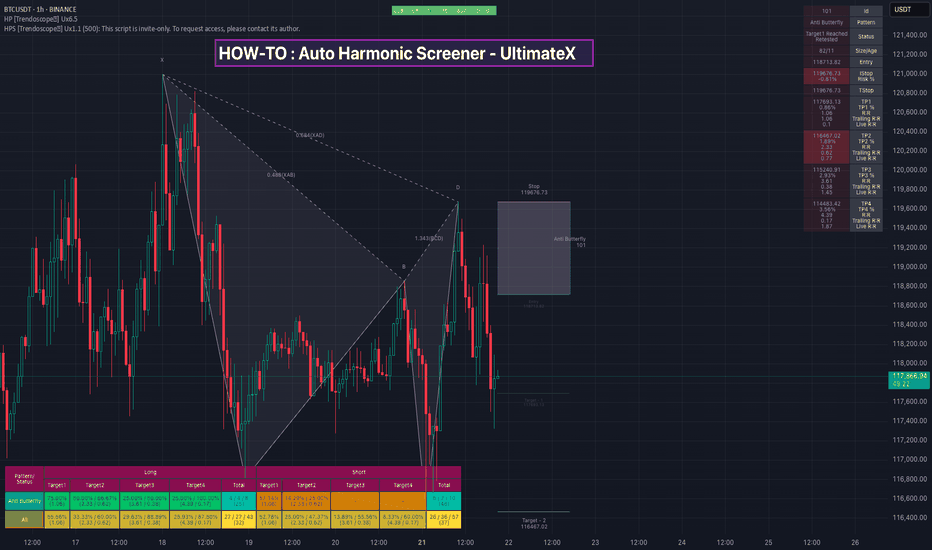
أهلا بالجمیع، فی هذا الفیدیو ، ناقشنا کیفیة استخدام Screener Auto Harmonic الجدید - Ultimatex. لقد غطینا الموضوعات التالیة. الفرق بین Auto Harmonic Screener - Ultimatex (السیناریو الحالی) و نمط التوافقی التلقائی - Ultimatex وکیفیة استخدام کل من البرامج النصیة معًا الفرق بین Auto Harmonic Screener - Ultimatex (البرنامج النصی الحالی) والفارق الموجود نمط التوافقی التلقائی - سیناری الذی بنی على request. لقد ناقشنا کیفیة قیود البرنامج النصی القدیم وکیف استخدام البرنامج النصی الجدید مع شاشة الصنوبر ستساعد الأداة المساعدة فی التغلب على هذه المشکلات. لقد مررنا بإعدادات المؤشر (والتی تشبه تقریب توضیح قصیر حول کیفیة استخدام البرنامج النصی مع شاشة الصنوبر تحقق أیضًا من الفیدیو الحالی الخاص بنا کیفیة استخدام الأداة المساعدة الجدیدة لصندوق الصنوبر.
Trendoscope
Pine Screener - Powerful tool for building programmable screener
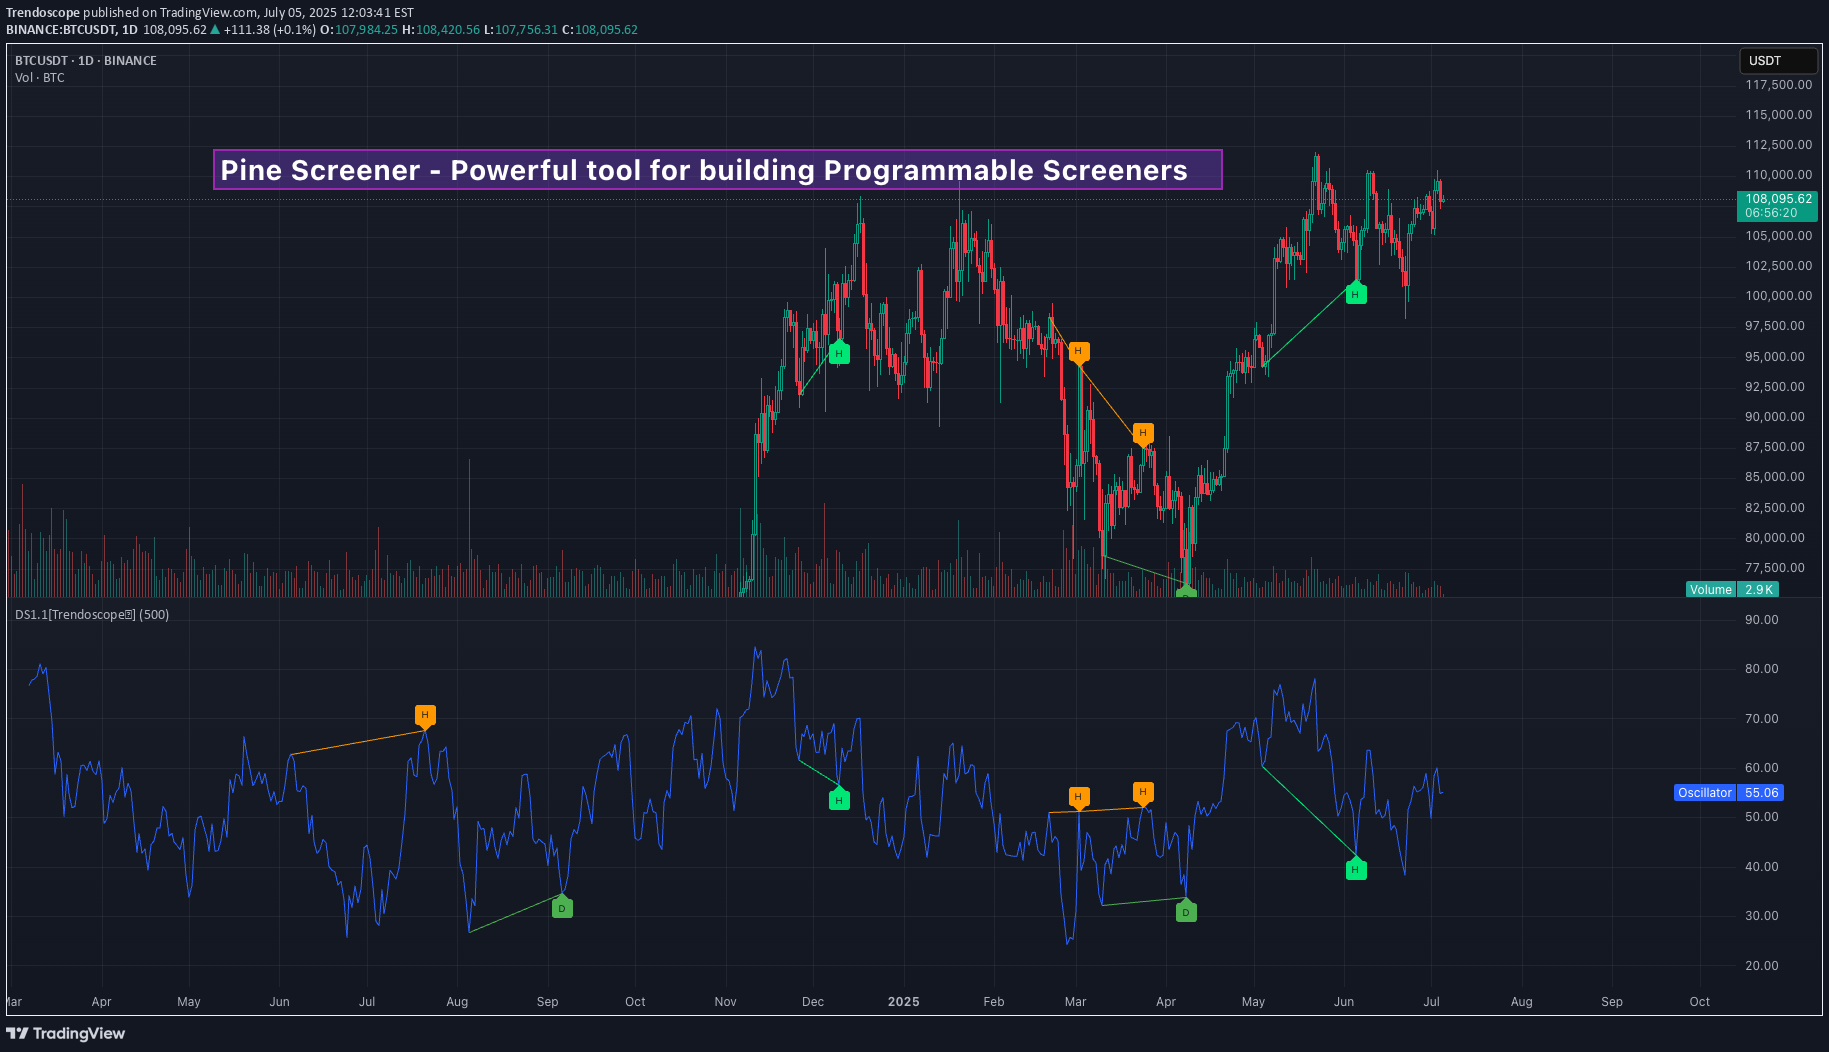
مرحبًا بالجمیع ، فی هذا الفیدیو ، ناقشنا حول کیفیة استخدام فائدة Screener Pine من TradingView. نحن نستفید من فرز التباعد المؤشرات لهذا العرض التوضیحی والشاشة التی تخضع للاختلاف الصعودی. باختصار ، إلیک الخطوات: 🎯 استخدم فرز الأوراق المالیة لإنشاء قائمة مراقبة أقل من 1000 رموز - أضف المؤشر الذی ترغب فی استخدامه فی شاشة Pine Screener الخاصة بک. TradingView.com/pine-screener/🎯 أضف قائمة المراقبة والمؤشر إلى فرز الصنوبر وضبط إعدادات الإطار الزمنی والمؤشر 🎯 حدد المعاییر المراد مسحها وضغط على المسح
Trendoscope
Position Sizing Strategies
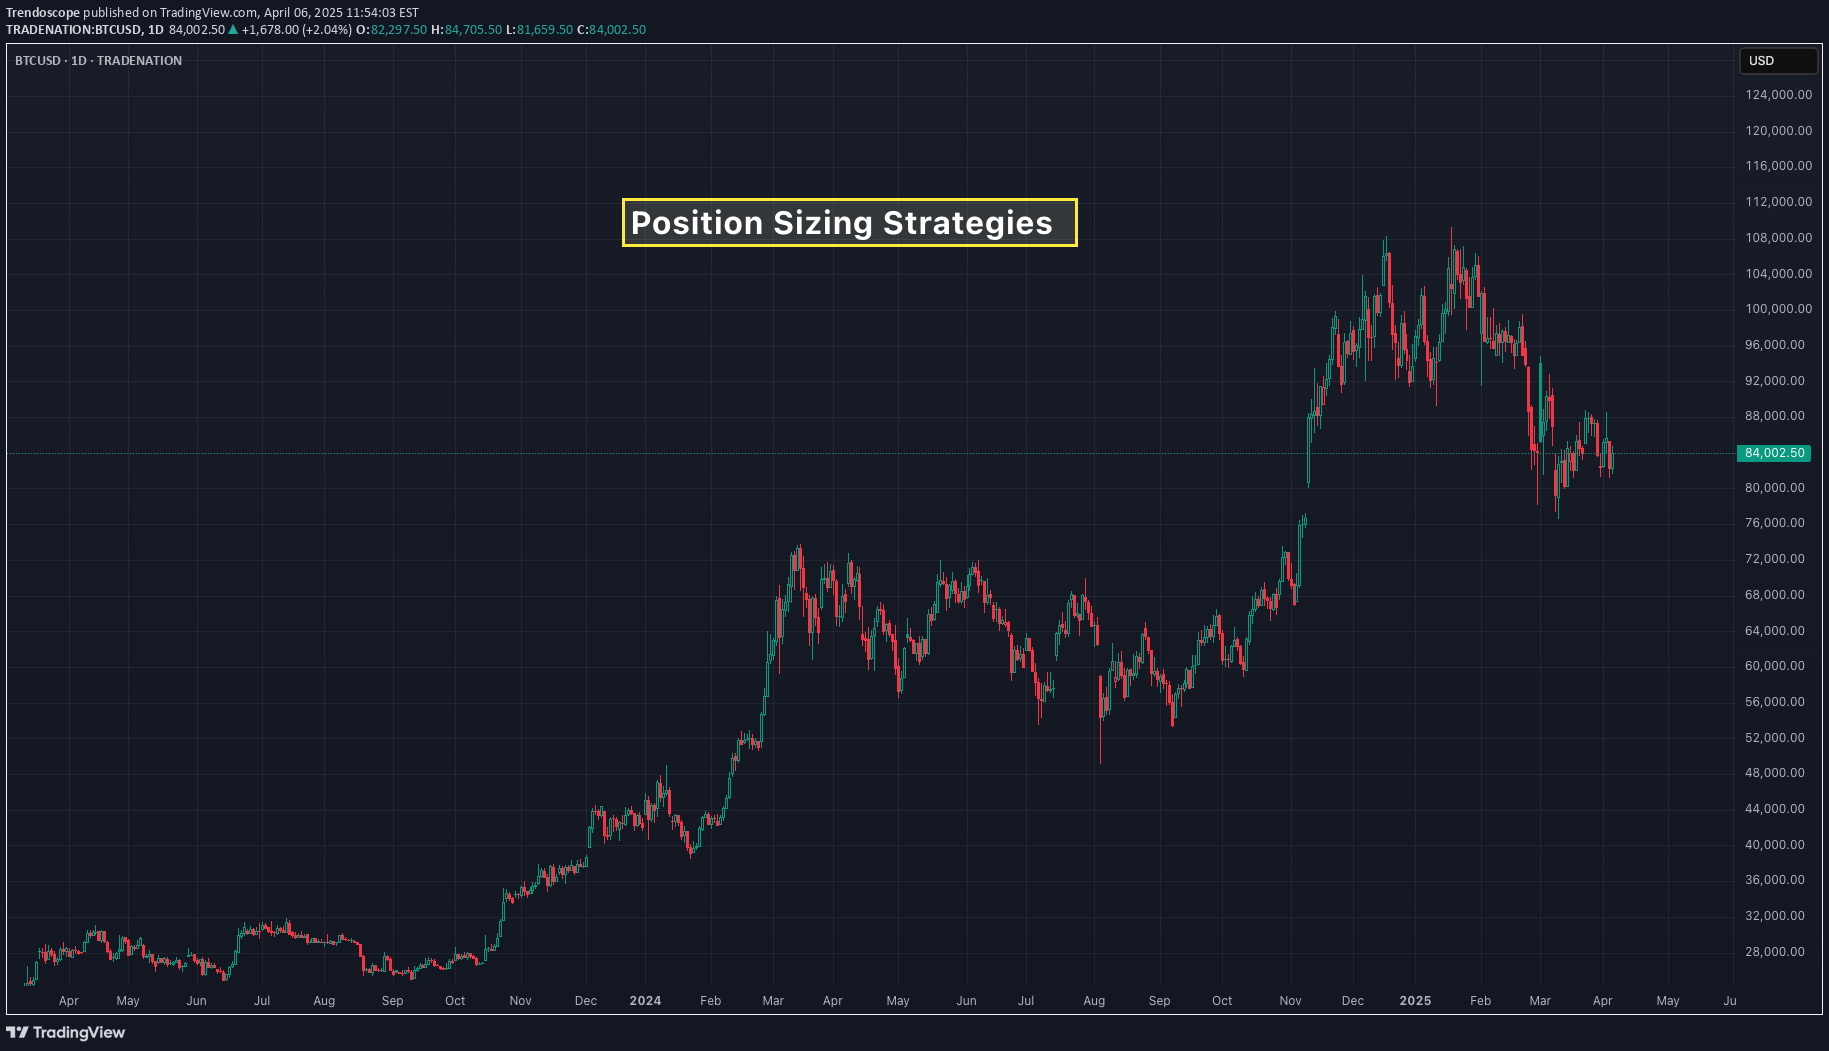
Position sizing is one of the most important aspects in risk management for traders. Proper position sizing helps manage the risk effectively by maximizing profits and limiting the losses. In this publication, we will explore popular position sizing strategies and how to implement them in pinescript strategies 🎲 Importance of Position Sizing in Trading Let's take an example to demonstrate the importance of position sizing. You have a very good strategy that gives you win on 70% of the times with risk reward of 1:1. If you start trading with this strategy with all your funds tied into a single trade, you have the risk of losing most of your fund in the first few trades and even with 70% win rate at later point of time, you may not be able to recoup the losses. In such scenarios, intelligent position sizing based on the events will help minimize the loss. In this tutorial, let us discuss some of those methods along with appropriate scenarios where that can be used. 🎲 Position Sizing Strategies Available in Tradingview Strategy Implementation 🎯 Fixed dollar amount position sizing In this method, trader allocate a fixed value of X per trade. Though this method is simple, there are few drawbacks Does not account for varying equity based on the trade outcomes Does not account for varying risk based on the volatility of the instrument 🎯 Fixed Percentage of Equity In this method, percent of equity is used as position size for every trade. This method is also simple and slightly better than the Fixed dollar amount position sizing. However, there is still a risk of not accounting for volatility of the instrument for position sizing. In tradingview strategies, you can find the position sizing settings in the properties section. In both cases, Pinescript code for the entry does not need to specify quantity explicitly, as they will be taken care by the framework. Pine Script® if(longEntry) strategy.entry('long', strategy.long) if(shortEntry) strategy.entry('short', strategy.short) 🎲 Advanced Position Sizing Strategies There are not directly supported in Tradingview/Pinescript - however, they can be programmed. 🎯 Fixed Fractional Method The Fixed Fractional Method is similar to the fixed percentage of equity method/fixed dollar amount positioning method, but it takes into account the amount of risk on each trade and calculate the position size on that basis. This method calculates position size based on the trader’s risk tolerance, factoring in stop-loss levels and account equity. Due to this, the trader can use any instrument and any timeframe with any volatility with fixed risk position. This means, the quantity of overall trade may vary, but the risk will remain constant. Example. Let's say you have 1000 USD with you and you want to trade BTCUSD with entry price of 100000 and stop price of 80000 and target of 120000. You want to risk only 5% of your capital for this trade. Calculation will be done as follows. Risk per trade = 5% of 1000 = 50 USD Risk per quantity = (entry price - stop price) = 20000 So, the quantity to be used for this trade is calculated by RiskQty = Risk Amount / Risk Per Quantity = 50 / 20000 = 0.0025 BTC To implement the similar logic in Pinescript strategy by using the strategy order quantity as risk, we can use the following code Pine Script® riskAmount = strategy.default_entry_qty(entryPrice)*entryPrice riskPerQty = math.abs(entryPrice-stopPrice) riskQty = riskAmount/riskPerQty With this, entry and exit conditions can be updated to as follows Pine Script® if(longEntry) strategy.entry('long', strategy.long, riskQty, stop=entryPrice) strategy.exit('ExitLong', 'long', stop=stopPrice, limit=targetPrice) if(shortEntry) strategy.entry('short', strategy.short, riskQty, stop=entryPrice) strategy.exit('ExitShort', 'short', stop=stopPrice, limit=targetPrice) Expand 1 line 🎯 Kelly Criterion Method The Kelly Criterion is a mathematical formula used to determine the optimal position size that maximizes the long-term growth of capital, considering both the probability of winning and the payoff ratio (risk-reward). It’s a more sophisticated method that balances risk and reward in an optimal way. Kelly Criterion method needs a consistent data on the expected win ratio. As and when the win ratio changes, the position sizing will adjust automatically. Formula is as follows f = W - L/R f: Fraction of your capital to bet. W : Win Ratio L : Loss Ratio (1-W) R : Risk Reward for the trade Let's say, you have a strategy that provides 60% win ratio with risk reward of 1.5, then the calculation of position size in terms of percent will be as follows f = 0.6 - 0.4/1.5 = 0.33 Pinescript equivalent of this calculation will be Pine Script® riskReward = 2 factor = 0.1 winPercent = strategy.wintrades/(strategy.wintrades+strategy.losstrades) kkPercent = winPercent - (1-winPercent)/riskReward tradeAmount = strategy.equity * kkPercent * factor tradeQty = tradeAmount/entryPrice Expand 1 line 🎲 High Risk Position Sizing Strategies These strategies are considered very high risk and high reward. These are also the strategies that need higher win ratio in order to work effectively. 🎯Martingale Strategy The Martingale method is a progressive betting strategy where the position size is doubled after every loss. The goal is to recover all previous losses with a single win. The basic idea is that after a loss, you double the size of the next trade to make back the lost money (and make a profit equal to the original bet size). How it Works: If you lose a trade, you increase your position size on the next trade. You keep doubling the position size until you win. Once you win, you return to the original position size and start the process again. To implement martingale in Pine strategy, we would need to calculate the last consecutive losses before placing the trade. It can be done via following code. Pine Script® var consecutiveLosses = 0 if(ta.change(strategy.closedtrades) > 0) lastProfit = strategy.closedtrades.profit(strategy.closedtrades-1) consecutiveLosses := lastProfit > 0? 0 : consecutiveLosses + 1 Quantity can be calculated using the number of consecutive losses Pine Script® qtyMultiplier = math.pow(2, consecutiveLosses) baseQty = 1 tradeQty = baseQty * qtyMultiplier 🎯Paroli System (also known as the Reverse Martingale) The Paroli System is similar to the Anti-Martingale strategy but with more defined limits on how much you increase your position after each win. It's a progressive betting system where you increase your position after a win, but once you've won a set number of times, you reset to the original bet size. How it Works: Start with an initial bet. After each win, increase your bet by a predetermined amount (often doubling it). After a set number of wins (e.g., 3 wins in a row), reset to the original position size. To implement inverse martingale or Paroli system through pinescript, we need to first calculate consecutive wins. Pine Script® var consecutiveWins = 0 var maxLimit = 3 if(ta.change(strategy.closedtrades) > 0) lastProfit = strategy.closedtrades.profit(strategy.closedtrades-1) consecutiveWins := lastProfit > 0? consecutiveWins + 1 : 0 if(consecutiveWins >= maxLimit) consecutiveWins := 0 Expand 2 lines The quantity is then calculated using a similar formula as that of Martingale, but using consecutiveWins Pine Script® qtyMultiplier = math.pow(2, consecutiveWins) baseQty = 1 tradeQty = baseQty * qtyMultiplier 🎯D'Alembert Strategy The D'Alembert strategy is a more conservative progression method than Martingale. You increase your bet by one unit after a loss and decrease it by one unit after a win. This is a slow, incremental approach compared to the rapid growth of the Martingale system. How it Works: Start with a base bet (e.g., $1). After each loss, increase your bet by 1 unit. After each win, decrease your bet by 1 unit (but never go below the base bet). In order to find the position size on pinescript strategy, we can use following code Pine Script® // Initial position initialposition = 1.0 var position = initialposition // Step to increase or decrease position step = 2 if(ta.change(strategy.closedtrades) > 0) lastProfit = strategy.closedtrades.profit(strategy.closedtrades-1) position := lastProfit > 0 ? math.max(initialposition, position-step) : position+step Expand 3 lines Conclusion Position sizing is a crucial part of trading strategy that directly impacts your ability to manage risk and achieve long-term profitability. By selecting the appropriate position sizing method, traders can ensure they are taking on an acceptable level of risk while maximizing their potential rewards. The key to success lies in understanding each strategy, testing it, and applying it consistently to align with your risk tolerance and trading objectives.
Trendoscope
Trading Converging Chart Patterns
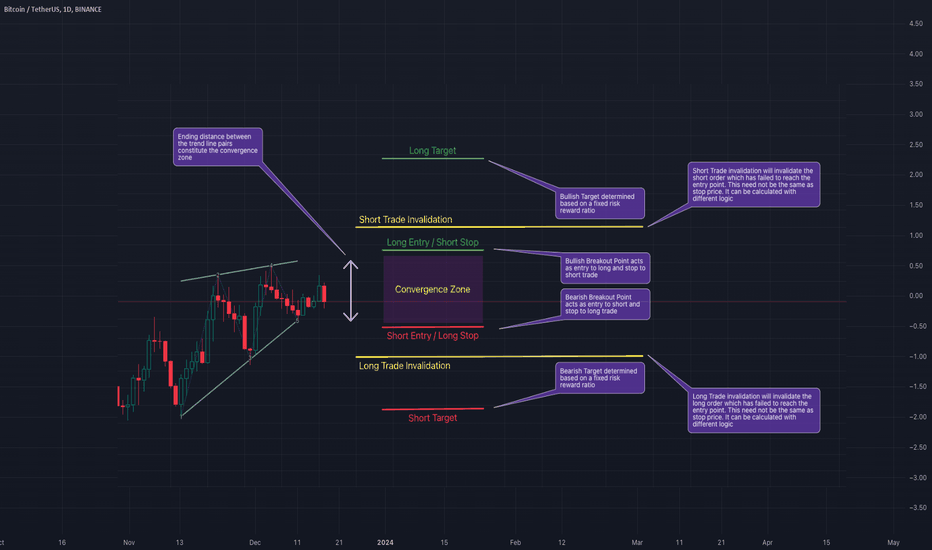
We discussed identification and classification of different chart patterns and chart pattern extensions in our previous posts. Algorithmic Identification of Chart Patterns Flag and Pennant Chart Patterns In this installment, we shift our focus towards the practical trading strategies applicable to a select group of these patterns. Acknowledging that a universal trading rule cannot apply to all patterns, we narrow our examination to those of the converging variety. We will specifically address the following converging patterns: Rising Wedge (Converging Type) Falling Wedge (Converging Type) Converging Triangle Rising Triangle (Converging Type) Falling Triangle (Converging Type) This selection will guide our discussion on how to approach these patterns from a trading perspective. 🎲 Historical Bias and General Perception Each pattern we've discussed carries a historical sentiment that is widely regarded as a guideline for trading. Before we delve into our specific trading strategies, it's crucial to understand these historical sentiments and the general market interpretations associated with them. 🟡 The Dynamics of Contracting Wedge Patterns Contracting Wedge patterns are typically indicative of the Elliott Wave Structure's diagonal waves, potentially marking either the beginning or conclusion of these waves. A contracting wedge within a leading diagonal may experience a brief retracement before the trend resumes. Conversely, if found in an ending diagonal, it could signal the termination of wave 5 or C, possibly hinting at a significant trend reversal. The prevailing view suggests that these patterns usually precede a short-term directional shift: Rising Wedges are seen as bearish signals, while Falling Wedges are interpreted as bullish. It's essential to consider the trend prior to the formation of these patterns, as it significantly aids in determining their context within the Elliott Wave cycles, specifically identifying them as part of waves 1, A, 5, or C. For an in-depth exploration, refer to our detailed analysis in Decoding Wedge Patterns 🎯 Rising Wedge (Converging Type) The Rising Wedge pattern, historically viewed with a bearish bias, suggests that a downward trend is more likely upon a breakout below its lower trend line. This perception positions the pattern as a signal for traders to consider bearish positions once the price breaks through this critical support. 🎯 Falling Wedge (Converging Type) The Falling Wedge pattern is traditionally seen through a bullish lens, indicating potential upward momentum when the price surpasses its upper trend line. This established viewpoint suggests initiating long positions as a strategic response to such a breakout, aligning with the pattern's optimistic forecast. 🟡 Contracting Triangle Patterns Contracting Triangles, encompassing Converging, Ascending, and Descending Triangles, are particularly noteworthy when they appear as part of the Elliott Wave's B or 2 waves. These patterns typically signal a continuation of the pre-existing trend that preceded the triangle's formation. This principle also underpins the Pennant Pattern, which emerges following an impulse wave, indicating a pause before the trend's resumption. 🎲 Alternate Way of Looking into Converging Patterns Main issue with historical perception are: There is no clear back testing data to prove whether the general perception is correct or more profitable. Elliott Waves concepts are very much subjective and can be often difficult for beginners and misleading even for experts. So, the alternative way is to treat all the converging patterns equally and devise a method to trade using a universal way. This allows us to back test our thesis and be definitive about the profitability of these patterns. Here are our simple steps to devise and test a converging pattern based strategy. Consider all converging patterns as bidirectional. Meaning, they can be traded on either side. Thus chose to trade based on the breakout. If the price beaks up, then trade long and if the price breaks down, then trade short. For each direction, define criteria for entry, stop, target prices and also an invalidation price at which the trade is ignored even without entry. Backtest and Forward test the strategy and collect data with respect to win ratio, risk reward and profit factor to understand the profitability of patterns and the methodology. Now, let's break it further down. 🟡 Defining The Pattern Trade Conditions Measure the ending distance between the trend line pairs and set breakout points above and beyond the convergence zone. 🎯 Entry Points - These can be formed on either side of the convergence zone. Adding a small buffer on top of the convergence zone is ideal for setting the entry points of converging patterns. Formula for Entry can be: Pine Script® Long Entry Price = Top + (Top - Bottom) X Entry Ratio Short Entry Price = Bottom - (Top-Bottom) X Entry Ratio Whereas Top refers to the upper side of the convergence zone and bottom refers to the lower side of the convergence zone. Entry Ratio is the buffer ratio to apply on top of the convergence zone to get entry points. 🎯 Stop Price - Long entry can act as stop for short orders and the short entry can act as stop price for long orders. However, this is not mandatory and different logic for stops can be applied for both sides. Formula for Stop Can be Pine Script® Long Stop Price = Bottom - (Top - Bottom) X Stop Ratio Short Stop Price = Top + (Top - Bottom) X Stop Ratio 🎯 Target Price - It is always good to set targets based on desired risk reward ratio. That means, the target should always depend on the distance between entry and stop price. The general formula for Target can be: Pine Script® Target Price = Entry + (Entry-Stop) X Risk Reward 🎯 Invalidation Price - Invalidation price is a level where the trade direction for a particular pattern needs to be ignored or invalidated. This price need to be beyond stop price. In general, trade is closed when a pattern hits invalidation price. Formula for Invalidation price is the same as that of Stop Price, but Invalidation Ratio is more than that of Stop Ratio Pine Script® Long Invalidation Price = Bottom - (Top - Bottom) X Invalidation Ratio Short Invalidation Price = Top + (Top - Bottom) X Invalidation Ratio 🟡 Back Test and Forward Test and Measure the Profit Factor It is important to perform sufficient testing to understand the profitability of the strategy before using them on the live trades. Use multiple timeframes and symbols to perform a series of back tests and forward tests, and collect as much data as possible on the historical outcomes of the strategy. Profit Factor of the strategy can be calculated by using a simple formula Pine Script® Profit Factor = (Wins/Losses) X Risk Reward 🟡 Use Filters and Different Combinations Filters will help us in filtering out noise and trade only the selective patterns. The filters can include a simple logic such as trade long only if price is above 200 SMA and trade short only if price is below 200 SMA. Or it can be as complex as looking into the divergence signals or other complex variables.
Trendoscope
Flag and Pennant Chart Patterns
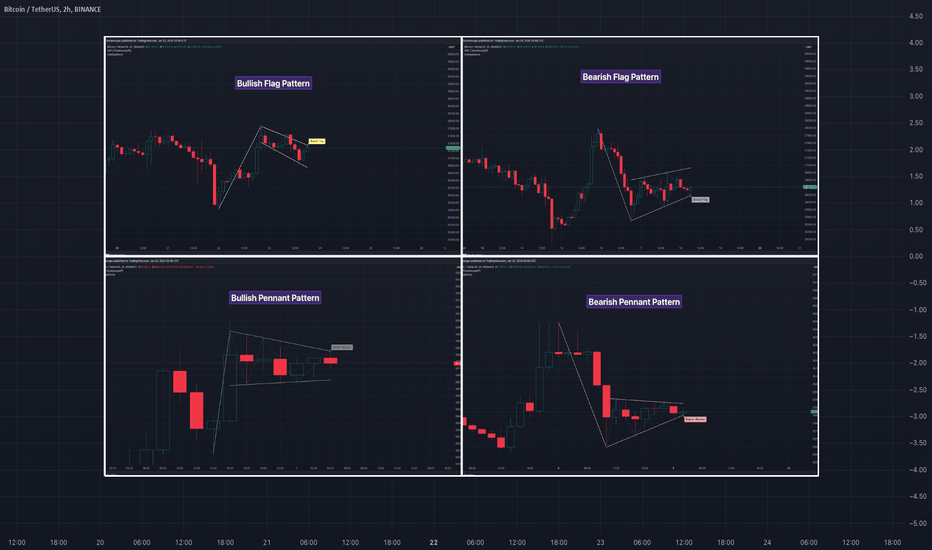
🎲 امتداد لأنماط الرسم البیانی بناءً على أزواج خطوط الاتجاه - الأعلام والرایات بعد استکشاف التعریف الخوارزمی وتصنیف أنماط الرسم البیانی، نتعمق الآن فی امتدادات هذه الأنماط، مع الترکیز على أنماط الرسم البیانی للأعلام والرایات. تتطور هذه الأنماط من هیاکل أساسیة تعتمد على أزواج خطوط الاتجاه، وغالبًا ما تتأثر بنبضات السوق السابقة.🎲 قواعد تحدید أنماط الامتداد🎯 تحدید وجود أنماط الرسم البیانی الأساسیة قبل تحدید أنماط الأعلام والرایات، نحتاج أولاً إلى تحدید وجود أنماط متقاربة أو متوازیة تعتمد على أزواج خطوط الاتجاه الأساسیة التالیة. القناة الصاعدة القناة الهابطة الإسفین الصاعد (متقلص) الإسفین الهابط (متقلص) المثلث المتقارب المثلث الهابط (متقلص) المثلث الصاعد (متقلص)🎯 تحدید أنماط الامتداد. یکمن مفتاح تحدید هذه الأنماط فی اکتشاف موجة اندفاعیة قویة - تشبه عمود العلم - تسبق نمط القاعدة. یشیر هذا الإعداد إلى إمکانیة ظهور نمط امتداد: یظهر العلم الصاعد من اندفاع إیجابی یتبعه قناة هابطة أو إسفین هابط، ویظهر العلم الهابط بعد اندفاع سلبی یؤدی إلى قناة صاعدة أو إسفین صاعد. یُشار إلى العلم الصاعد من خلال اندفاع إیجابی یسبق مثلثًا متقاربًا أو مثلثًا صاعدًا. یتبع الرایة الهبوطیة نبضة سلبیة ومثلث متقارب أو هابط.🎲 تصنیفات وخصائص النمط🎯 نمط العلم الصاعدخصائص نمط العلم الصاعد هی کما یلییبدأ بموجة دافعة إیجابیة، یتبعها على الفور إما قناة هابطة قصیرة أو إسفین هابط.إلیک مثال على نمط العلم الصاعد🎯 نمط العلم الهابطخصائص نمط العلم الهابط هی کما یلییبدأ بموجة دافعة سلبیة، یتبعها على الفور إما قناة صاعدة قصیرة أو إسفین صاعد.إلیک مثال على نمط العلم الهابط🎯 نمط العلم الصاعدخصائص نمط العلم الصاعد هی کما یلییبدأ بموجة دافعة إیجابیة، یتبعها على الفور إما نمط مثلث متقارب أو نمط مثلث صاعد.إلیک مثال على نمط العلم الصاعد🎯 نمط العلم الهابطخصائص نمط العلم الهابط أنماط الرایة هی کما یلی: تبدأ بموجة دافعة سلبیة، تلیها على الفور إما نمط مثلث متقارب أو نمط مثلث متقارب هابط. فیما یلی مثال على أنماط تمدید تداول نمط الرایة الهبوطیة فی اتجاه السوق القوی، من الشائع أن نرى فترات مؤقتة من التوحید، وتشکل أنماطًا تتقارب أو تتراوح، وغالبًا ما تکون معاکسة لاتجاه الاتجاه المستمر. قد تضع مثل هذه التوقفات الأساس لاستمرار الاتجاه بعد الاختراق. إن افتراض استئناف الاتجاه یشکل التحیز الأساسی لأنماط العلم والرایة ومع ذلک، من المهم عدم اتخاذ القرارات بناءً على الاتجاهات السابقة فقط. یعد إجراء اختبار خلفی شخصی أمرًا بالغ الأهمیة لتحدید أکثر استراتیجیات الدخول والخروج فعالیة لهذه الأنماط. تذکر أن سلوک هذه الأنماط یمکن أن یختلف بشکل کبیر مع تقلب الأصول والإطار الزمنی المحدد الذی یتم تحلیله. تعامل مع تفسیر هذه الأنماط بحکمة، مع الأخذ فی الاعتبار أن دینامیکیات السوق تخضع لمجموعة واسعة من العوامل المؤثرة التی قد تنحرف عن النتائج المتوقعة. بالنسبة للمستثمرین والتجار، من الضروری الانخراط فی اختبار خلفی شامل، وتحدید نقاط الدخول، وأوامر وقف الخسارة، وأهداف مستهدفة تتوافق مع أسلوب التداول الفردی الخاص بک ورغبتک فی المخاطرة. هذه الخطوة هی المفتاح لتقییم جدوى هذه الأنماط بما یتماشى مع استراتیجیاتک وأهدافک التجاریة الشخصیة. من الشائع إلى حد ما أن نشهد اختراقًا یتبعه انعکاس سریع للسعر بعد تشکیل هذه الأنماط. بالإضافة إلى ذلک، هناک مجال للابتکار فی التداول من خلال الذهاب ضد التحیز إذا حدث الاختراق فی الاتجاه المعاکس، وخاصة عندما یکون الاتجاه قبل تکوین النمط ضد تحیز النمط.🎲 Cheat Sheet
Trendoscope
Thinking in Pine - Study References Too Many Bars In the History
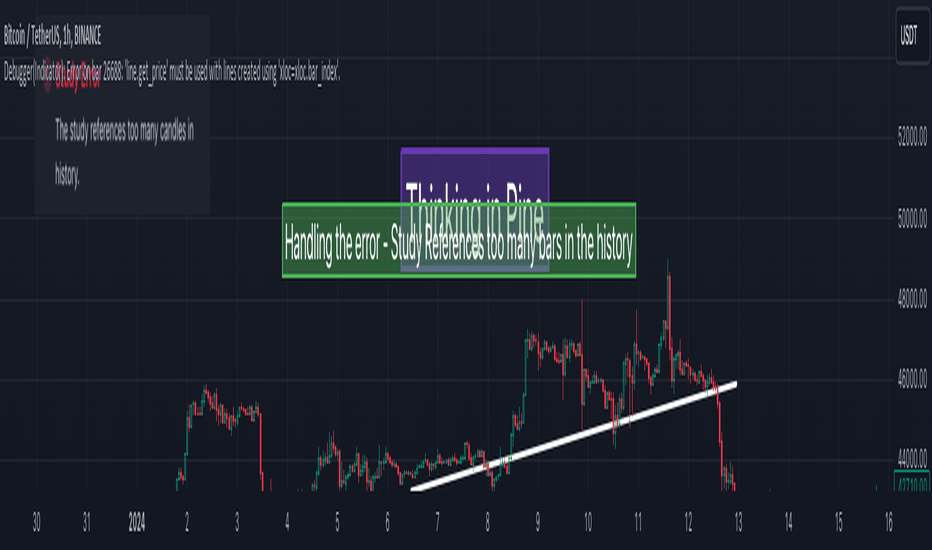
مرحبًا بکم فی سلسلة مقاطع الفیدیو القصیرة "Thinking in Pine" حول مواضیع Pine Script. موضوع الیوم هو التعامل مع الخطأ - "تشیر الدراسة إلى عدد کبیر جدًا من الشموع فی التاریخ" وقضایا أخرى متعلقة بمؤشر bar_index. إذا لم تکن على درایة بمفاهیم السلاسل الزمنیة فی Pine Script، فیرجى الاطلاع على مقاطع الفیدیو السابقة الخاصة بنا. Thinking in Pine - السلاسل الزمنیة Thinking in Pine - حالات خاصة للسلاسل الزمنیة 🎲 النقاط التی تمت مناقشتها متى نحصل على الخطأ "تشیر الدراسة إلى عدد کبیر جدًا من الشموع فی التاریخ" وکیفیة التغلب على هذه المشکلة. حدود مؤشر bar_index مع رسم الکائنات على الرسم البیانی. 🎯 برنامج مثال - تنفیذ بدیل للإشارة التاریخیةPine Script® 🎯 برنامج مثال - حدود رسم الکائنات مع Bar IndexPine Script®
Trendoscope
Thinking in Pine - Tricks and Tips of Debugging
مرحبًا بکم فی سلسلة مقاطع الفیدیو القصیرة "Thinking in Pine" حول مواضیع Pine Script. نقطة المناقشة الیوم هی تصحیح الأخطاء والأدوات التی توفرها لنا Pine Script لتصحیح أخطاء برامجنا.🎲 النقاط التی تمت مناقشتها تصحیح الأخطاء باستخدام `plot` لقیم السلسلة العددیة. استخدام Pine Logs لتصحیح الأخطاء فی الحالات التی لا یکون فیها `plot` مناسبًا🎯 برنامج مثال - تصحیح الأخطاء باستخدام plotPine Script®🎯 برنامج مثال - Pine LogsPine Script®🎲 المراجعPine Logs - دلیل مرجعیplot - دلیل مرجعی
Trendoscope
Thinking in Pine - Execution Model and Rollback on Realtime Bars
مرحبًا بالجمیع، مرحبًا بکم فی جلسة أخرى من "التفکیر فی Pine" - مقاطع فیدیو تعلیمیة قصیرة حول Pine Script. قبل متابعة هذا الفیدیو، إذا لم تکن على درایة بالمتغیرات var وvarip والمتغیرات العادیة، فیرجى مشاهدة الفیدیو السابق - "التفکیر فی Pine - var وvarip والمتغیرات العادیة"🎲 نقاط مناقشة الیوم کیف یعمل کود تعدیل var وvarip والمتغیرات العادیة مع التحدیثات التاریخیة والوقت الحقیقی bar. مفهوم التراجع عن متغیرات var🎯 برنامج مثال مستخدمPine Script®🎲 المراجعPine Script® دلیل مستخدم Pine Script® - نموذج التنفیذ
Trendoscope
Thinking in Pine - Functions Containing Var Variables
مرحبًا بالجمیع، ومرحبًا بکم مجددًا فی مقاطع الفیدیو التعلیمیة القصیرة "Thinking in Pine". فی هذا الفیدیو، ناقشنا حالات خاصة لاستخدام متغیرات var داخل تعریفات الوظائف. إذا لم تکن على درایة بمتغیرات var، فیرجى التراجع ومشاهدة الفیدیو السابق - "Thinking in Pine - var وvarip والمتغیرات العادیة"🎲 الملخصاستخدام var داخل نطاق الوظیفة وکیف یتصرف مع الاستدعاءات المتعددة.استخدام الوظائف التی تحتوی على تعریفات متغیرات var داخل حلقة.🎯 مثال على البرنامج المستخدمPine Script®🎲 المراجعدلیل مستخدم Pine Script® - إعلانات المتغیراتدلیل مرجع Pine Script® - var
Trendoscope
Thinking in Pine - Time Series Special Cases
مرحبًا بالجمیع، مرحبًا بکم مجددًا فی سلسلة مقاطع الفیدیو القصیرة "Thinking in Pine". فی هذه الجلسة، ناقشنا بعض الحالات الخاصة لمتغیرات السلسلة الزمنیة واستخدام عامل تاریخی ضمن نطاق محلی. إذا لم تکن قد شاهدت مقطع الفیدیو السابق - "Thinking in Pine - Time Series"، request فیرجى مشاهدته قبل متابعة هذا الفیدیو.🎲 ملخص مناقشتنا الیوم کیف یعمل عامل التاریخ للمتغیرات المحددة داخل کتلة شرطیة کیف یعمل عامل التاریخ للمتغیرات المحددة فی حلقة.🎯 برنامج مثال مستخدمPine Script®🎲 المراجع:دلیل مستخدم Pine Script® - نموذج التنفیذدلیل مستخدم Pine Script® - Time Seriesدلیل مستخدم Pine Script® - History Referencing Operatorدلیل مرجع Pine Script® - History Referencing Operator
إخلاء المسؤولية
أي محتوى ومواد مدرجة في موقع Sahmeto وقنوات الاتصال الرسمية هي عبارة عن تجميع للآراء والتحليلات الشخصية وغير ملزمة. لا تشكل أي توصية للشراء أو البيع أو الدخول أو الخروج من سوق الأوراق المالية وسوق العملات المشفرة. كما أن جميع الأخبار والتحليلات المدرجة في الموقع والقنوات هي مجرد معلومات منشورة من مصادر رسمية وغير رسمية محلية وأجنبية، ومن الواضح أن مستخدمي المحتوى المذكور مسؤولون عن متابعة وضمان أصالة ودقة المواد. لذلك، مع إخلاء المسؤولية، يُعلن أن المسؤولية عن أي اتخاذ قرار وإجراء وأي ربح وخسارة محتملة في سوق رأس المال وسوق العملات المشفرة تقع على عاتق المتداول.