
FxArena
@t_FxArena

ما هو الشيء الذي ننصحك بشراءه من المواد الغذائية؟
سابق في الشراء
پیام های تریدر
مرشح
FxArena
BITCOIN Indicates Consolidating Moves Before Stron
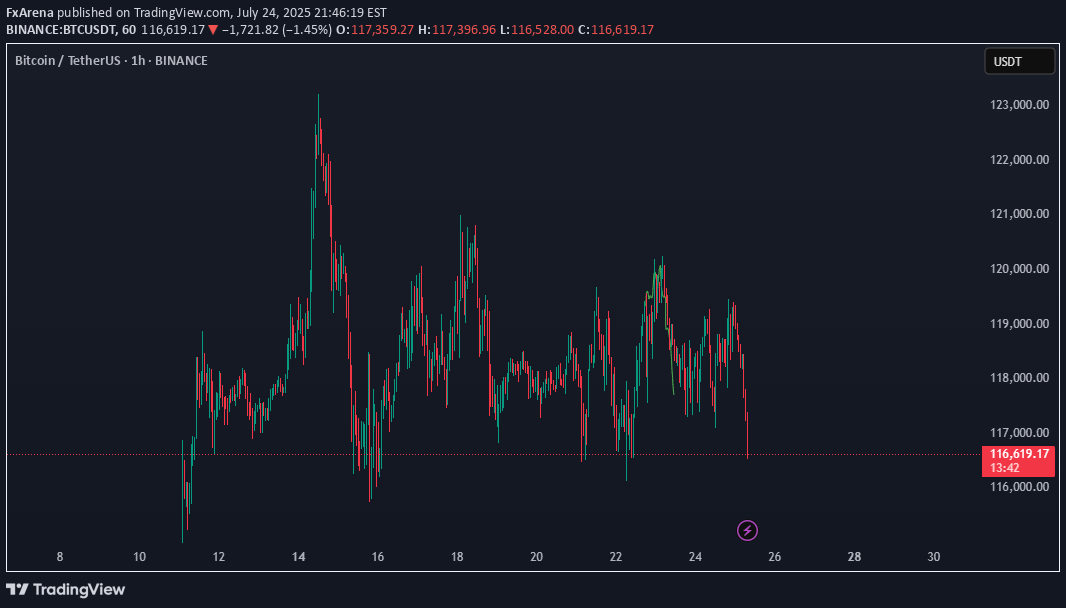
Bitcoin (BTC) تقریر تحلیل السوق ملخص والاستنتاج یتم تداول Bitcoin (BTC) حالیًا من حوالی 117000 دولار إلى 118،000 دولار ، مما یدل على تراجع طفیف من أعلى مستوى له على الإطلاق بالقرب من 123،000 دولار. تکون معنویات السوق صعودیة إلى حد ما ولکنها حذرة ، حیث تشیر المؤشرات الفنیة إلى بعض الظروف التی یتم توضیحها وتوحیدها على المدى القصیر. یبدو أن الاهتمام المؤسسی یبرد قلیلاً ، کما یتضح من التدفقات الخارجة الأخیرة من Bitcoin صنادیق الاستثمار المتداولة ، فی حین یستمر التراکم عبر مختلف مستویات المستثمرین ، بما فی ذلک الحیتان وحاملی البیع بالتجزئة. تقترب المقاومة الرئیسیة من 119،400 دولار-120،000 دولار ، والدعم یکمن حوالی 117200 دولار-116،900 دولار. السوق فی مرحلة "تراکم مثالی" ، مع دعم شراء قوی على الرغم من بعض الأرباح. مؤشر الخوف والجشع فی 70 ، مما یشیر إلى الجشع ولکن لیس النشوة الشدیدة. الأخبار الأخیرة تبرز صورة مختلطة: Bitcoin تظل مهیمنة ومستقرة ، لکن altcoins تکتسب بعض الزخم. تتحول التدفقات المؤسسیة إلى حد ما من Bitcoin إلى Ethereum وغیرها من altcoins. یتوقع الخبراء إمکانیة أن تصل Bitcoin إلى 200000 دولار إلى 250،000 دولار فی وقت لاحق من هذا العام ، مدفوعة بعوامل الاقتصاد الکلی مثل التوسع الائتمانی وتضخم FIAT. تحلیل مفصل 1. السعر والسوق Data سعر Typelast Market (USD) 24H Change24h High24h Low24H حجم التمویل (USD) (العقد) SPOT116،959.8-1.65 ٪ 119،498.4116،946.61.43 ملیار/أ Contract116،962.7-1.65 ٪ 119،492.9116،935.58.91b0.0001 یتم توحید Bitcoin أقل من 120،000 دولار بعد الوصول إلى ذروة 123،218 دولار فی 14 یولیو. یظل حجم التداول قویًا ، مما یشیر إلى مشارکة السوق النشطة. 2. المؤشرات الفنیة الإشارات الصعودیة: لا توجد مؤشرات تقنیة صعودیة قویة تم اکتشافها حالیًا. إشارات الهبوط: تشیر RSI إلى الظروف المفرطة فی الذروة ، مما یشیر إلى توخی الحذر على المدى القصیر. الدعم والمقاومة: المقاومة: ~ 119،416.6 دولار الدعم: ~ 117،227.4 دولار تُظهر MACD ومؤشرات الزخم الأخرى عدم التحیز ، مما یعنی وجود حرکة جانبیة محتملة أو تصحیحات بسیطة قبل التحرک major التالی. 3. شعور السوق فهرس الخوف والجشع: 70 (جشع) مشاعر المستثمرین صعودیة ولکنها خففت من خلال تحقیق الربح والواقع الحذر. تُظهر تدفقات ETF انعکاسًا حدیثًا مع تدفق خارجی بقیمة 68 ملیون دولار من Bitcoin صنادیق الاستثمار المتداولة ، مما ینهی سلسلة تدفق لمدة 13 یومًا. یجذب BTC و altcoins المزید من التدفقات ، مما یشیر إلى دوران فی المصلحة المؤسسیة. 4. الأخبار الأخیرة أبرز لا یزال Bitcoin مهیمنًا ولکنه کان فی الغالب راکدًا أقل من 120 ألف دولار ، فی حین أن Altcoins تکافح من أجل الزخم. یقوم المستثمرون المؤسسیون بتحویل بعض رأس المال من Bitcoin إلى Ethereum وغیرها من Altcoins. Bitcoin فی مرحلة "تراکم مثالی" ، مع جمیع مواقع بناء مستثمرین على الرغم من بعض عملیات نقل الحوت. یمکن أن یصل خبراء مثل آرثر هایز إلى 250،000 دولار بحلول نهایة العام ، مدفوعًا بتوسع الائتمان وعوامل الاقتصاد الکلی. یُظهر نشاط الشبکة انخفاضًا طفیفًا فی العناوین النشطة ، مما یشیر إلى توقف مؤقت قصیر الأجل. مستویات الدعم حوالی 116،952 دولار و 114،354 دولار أمر بالغ الأهمیة لمراقبة المخاطر السلبیة. لا تزال هیمنة بیتکوین قویة فی حوالی 61 ٪. 5. التوقعات على المدى القصیر: قد یستمر Bitcoin فی توحید ما بین 117000 دولار و 120،000 دولار ، مع انخفاضات طفیفة محتملة بسبب RSI فی ذروة الذروة. متوسطة إلى طویلة الأجل: تشیر العوامل الکلیة الإیجابیة واتجاهات التراکم إلى إمکانیة أن تکون هناک إمکانات جدیدة ، وربما تستهدف 150،000 دولار إلى 250،000 دولار. راقب اندلاعًا فوق 120،000 دولار لتأکید استمرار الزخم الصعودی. مراقبة تدفقات ETF والنشاط على السلسلة لعلامات المصلحة المؤسسیة المتجددة أو الحذر. توصیات للتجار والمستثمرین التجار: فکر فی التداول الحذر حول المستویات الحالیة ، ومشاهدة إشارات RSI و MACD لنقاط الدخول/الخروج. کن على درایة بالمقاومة بالقرب من 120،000 دولار. المستثمرون: تقترح مرحلة التراکم فرصًا جیدة للعقد على المدى الطویل ، خاصةً إذا کان Bitcoin یزید عن 117000 دولار. إدارة المخاطر: احتفظ بطلبات التوقف بالقرب من مستویات الدعم لتخفیف المخاطر السلبیة فی حالة وجود تصحیح.
FxArena
Where Is BTC Headed in the Next 7 Days?
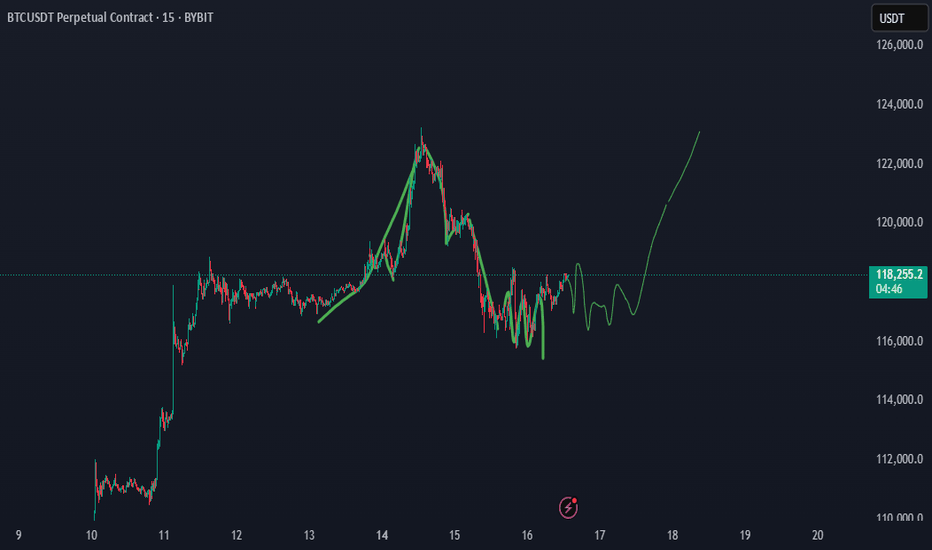
As Bitcoin (BTC) continues to dominate headlines, investors and traders are eager to understand its next move. With a current price of around $117,465 and a recent all-time high (ATH) of $122,980 on July 14, 2025, the cryptocurrency market is buzzing with excitement. Drawing from real-time data on social media platforms like X, web sources, and technical analysis, this article explores Bitcoin’s potential market direction over the next seven days, blending fundamental and sentiment insights for a comprehensive outlook. Whether you're a seasoned trader or a curious HODLer, here’s what you need to know about Bitcoin’s short-term trajectory. Bitcoin’s Current Market Landscape Bitcoin boasts a market capitalization of $2.34 trillion and a 24-hour trading volume of $88.63 billion as of July 16, 2025. Its market dominance stands at 62.92%, though it dipped slightly by 0.54% recently, hinting at competition from altcoins. The market is driven by strong fundamentals, including institutional adoption and supply constraints, but short-term volatility looms as traders monitor key price levels. Let’s break down the factors shaping Bitcoin’s path and forecast its movement through July 23, 2025. Fundamental Factors Driving Bitcoin’s Momentum Over 265 companies hold Bitcoin, with portfolios valued in the billions. Spot Bitcoin exchange-traded funds (ETFs) recorded $1.69 billion in inflows this week, reflecting strong institutional confidence in Bitcoin as a store of value. The April 2024 halving reduced miner rewards, tightening supply—a pattern that has historically fueled bullish cycles. Analysts predict sustained upward pressure as demand grows against a constrained supply. Bitcoin’s correlation with risk assets like the S&P 500 (0.73–0.90 in Q2 2025) underscores its role as a hedge against inflation and geopolitical uncertainty, amplified by recent U.S. policy shifts favoring crypto. Over 95% of Bitcoin addresses are in profit, and declining exchange reserves suggest long-term holders are confident in higher prices, reducing available supply. However, risks like profit-taking after the recent high and macroeconomic uncertainties, such as trade tensions, could introduce short-term fluctuations. These fundamentals set the stage for Bitcoin’s next moves. Sentiment Analysis. Gauging the Market’s Mood Market sentiment, gathered from online discussions and news, leans bullish with some cautionary undertones. Recent analysis indicates that bearish sentiment often signals market bottoms, suggesting a potential bullish reversal. Whale accumulation amid retail uncertainty further supports optimism. Bitcoin’s sentiment score averages 82/100, with 45.49% bullish, 11.49% bearish, and 54.51% neutral commentary, reflecting high engagement. Institutional enthusiasm, ETF inflows, and pro-crypto policy developments drive positive sentiment, particularly in the U.S. and Europe. However, concerns about price manipulation—evidenced by a +1,550% surge in related online searches—and potential profit-taking temper short-term optimism. High trading activity during European hours (08:00–17:00 GMT) often extends Asian session trends, while weekends see increased volatility due to lower institutional participation. The overall sentiment is bullish, with short-term bearish signals potentially creating buying opportunities for savvy investors. Technical Analysis Technical analysis across 15-minute (15m), 1-hour (H1), and 4-hour (H4) time frames offers insights into Bitcoin’s short-term behavior 15m and H1 Time Frames: Recent chart patterns show a rejection below $117,800, indicating a short-term bearish structure. Support lies at $115,000–$116,600, with resistance at $117,800–$118,000. Indicators like the Relative Strength Index (RSI at 68) and MACD suggest neutral momentum, with a bearish bias if Bitcoin remains below $118,000. A break below $115,000 could push prices toward $109,000–$110,000. H4 Time Frame: The market is consolidating, with the 9-period Exponential Moving Average (EMA) catching up to price. The long-term trend remains bullish, supported by rising 50-day and 200-day moving averages. Overall, technical indicators rate Bitcoin as a “Buy,” with 13 Buy signals from moving averages and neutral oscillators, pointing to a potential retest of $120,000–$123,000 if support holds. The charts suggest a bullish long-term trend with short-term consolidation, making support levels critical for traders. Bitcoin Price Forecast for Next 7 Days Synthesizing fundamental strength, sentiment trends, and technical signals, here’s Bitcoin’s likely direction by July 23, 2025 Bullish Scenario: If Bitcoin holds above the $115,000–$116,000 support zone, it could rally to $120,000–$123,000, fueled by institutional demand, ETF inflows, and positive sentiment. Rising moving averages and a bullish H4 trend support this, with analysts eyeing even higher long-term targets. A breakout above $118,000 could trigger a push toward the recent high or beyond. Bearish Scenario: Short-term bearish signals on 15m and H1 time frames, combined with profit-taking risks, suggest a potential dip to $115,000–$116,000. A break below could target $109,000–$110,000, particularly if macroeconomic concerns or altcoin competition intensify. Bitcoin may test $115,000–$116,000 in the next few days due to short-term bearish pressures, but strong fundamentals and bullish sentiment make a rebound to $120,000–$123,000 likely by July 23, 2025. Any pullback should be viewed as a buying opportunity, given the robust institutional and on-chain metrics. Key Levels to Watch Support: $115,000–$116,600 (short-term), $109,000–$110,000 (secondary) Resistance: $117,800–$118,000 (immediate), $120,000–$123,000 (next target) Catalysts: Keep an eye on ETF flows, macroeconomic developments (e.g., inflation, trade policies), and online sentiment for potential market shifts. Bitcoin’s market is in a dynamic phase, balancing short-term volatility with a strong bullish foundation. Traders should monitor the $115,000–$116,000 support zone for signs of a bounce or further correction, while long-term investors can take comfort in the robust fundamentals driving Bitcoin’s growth. The next seven days could see BTC testing $120,000–$123,000 if key levels hold, though a brief dip is possible. Stay informed on market developments and be ready to seize opportunities in this exciting crypto landscape.
FxArena
NMR Crypto Up and Reverse Zone

وفقًا للموقف الحالی، هذه هی مناطق الانعکاس الصاعدة والهابطة لعقود NMR الآجلة. دعنا نرى کیف تسیر الأمور وسأقوم بتحدیث لقطات الشاشة للرسم البیانی أسفل قسم التعلیقات
FxArena
XAUUSD Gold Reverse zone

بمجرد فتح السوق، ستکون هناک تحرکات هبوطیة. فقط کن على أهبة الاستعداد، حیث یقوم سوق xauusd بحرکات هبوطیة قبل الوصول إلى اتجاه صاعد
FxArena
GOLD Next Possible Short Scalp Area

الذهب/الدولار الأمریکی یصل إلى منطقة مضاربة قصیرة أخرى. ابقَ مرکزًا. الذهب متقلب بعض الشیء الآن حیث أن جلسة لندن الآن.
FxArena
XAUUSD GOLD best reverse zone here

هذه هی النقطة الذهبیة التی تعد واحدة من أفضل النقاط العکسیة الممکنة لمضاربی فروقات الأسعار. سأقوم بتحدیث الإعداد أدناه فی قسم التعلیقات
FxArena
Gold next possible Move to bearish

سوف یکون الذهب هبوطیًا فی هذه المنطقة على المدى القصیر. سأقوم بالتحدیث أدناه فی قسم التعلیقات
FxArena
GOLD Reaching Another Long scalp area

هذه منطقة أخرى طویلة للمضاربة. سأقوم بتحدیث الإعدادات فی قسم التعلیقات
FxArena
GOLD Next Possible Long Scalp Area

منطقة فروة الرأس الذهبیة الطویلة سأقوم بتحدیث الإعداد أدناه التعلیق العکسی هذا کل شیء
FxArena
GOLD is going to short??

من المحتمل أن یکون الذهب قصیرًا لجنی الأرباح ببضع نقاط مثل التداول السابق
إخلاء المسؤولية
أي محتوى ومواد مدرجة في موقع Sahmeto وقنوات الاتصال الرسمية هي عبارة عن تجميع للآراء والتحليلات الشخصية وغير ملزمة. لا تشكل أي توصية للشراء أو البيع أو الدخول أو الخروج من سوق الأوراق المالية وسوق العملات المشفرة. كما أن جميع الأخبار والتحليلات المدرجة في الموقع والقنوات هي مجرد معلومات منشورة من مصادر رسمية وغير رسمية محلية وأجنبية، ومن الواضح أن مستخدمي المحتوى المذكور مسؤولون عن متابعة وضمان أصالة ودقة المواد. لذلك، مع إخلاء المسؤولية، يُعلن أن المسؤولية عن أي اتخاذ قرار وإجراء وأي ربح وخسارة محتملة في سوق رأس المال وسوق العملات المشفرة تقع على عاتق المتداول.