
DOCTOR_PIPS05
@t_DOCTOR_PIPS05

ما هو الشيء الذي ننصحك بشراءه من المواد الغذائية؟
سابق في الشراء
پیام های تریدر
مرشح
DOCTOR_PIPS05
تحلیل طلا (XAU/USD): طلای داغ در آستانه صعود به سوی ۴۱۰۰ دلار!
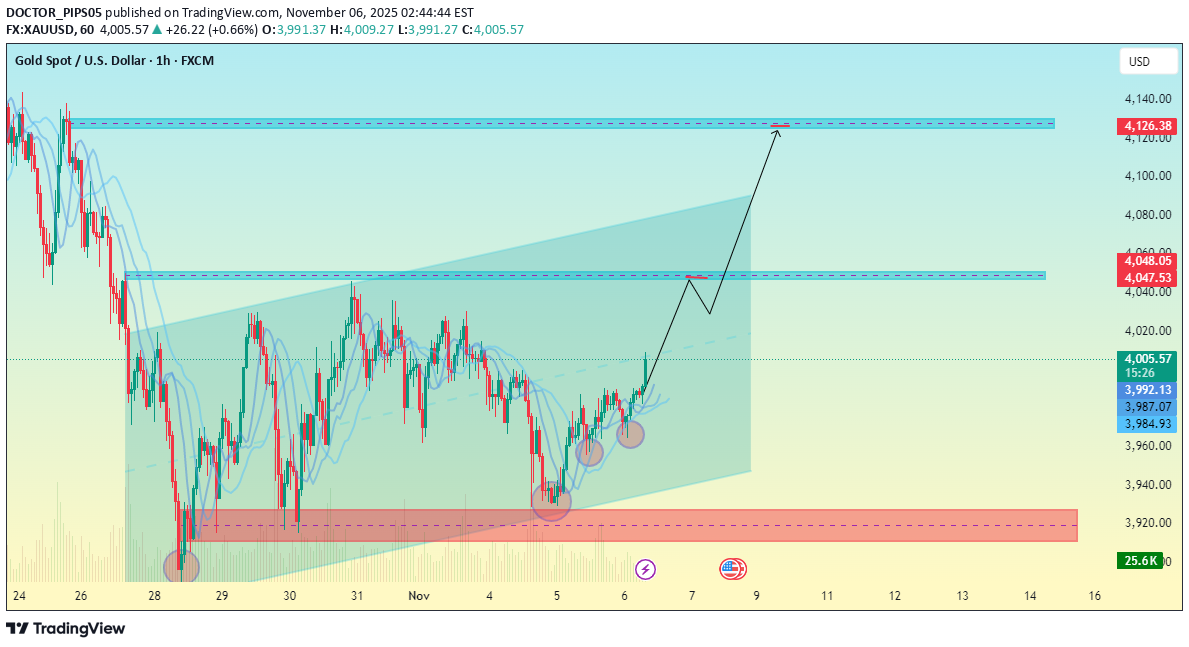
نظرة عامة على الرسم البیانی السعر الحالی: حوالی 4,007 دولار الهیکل: یظهر الرسم البیانی نموذج انعکاس صعودی یتشکل بعد فترة من التحرک الجانبی movement داخل القناة. أبرز المستویات الرئیسیة: منطقة الدعم: حوالی 3,920 دولارًا - 3,940 دولارًا (ممیزة باللون الوردی فی الأسفل). وقد حافظت هذه المنطقة على السعر عدة مرات، مما یشکل منطقة طلب قویة. منطقة المقاومة الأولى / جنی الربح: بالقرب من 4,045 دولارًا أمریکیًا - 4,050 دولارًا أمریکیًا (المربع الأزرق الأوسط). المقاومة الثانیة / منطقة الهدف النهائیة: حوالی 4,125 دولارًا - 4,130 دولارًا (المربع الأزرق العلوی). 📈 المسقط Move یشیر الرسم البیانی إلى نمط اختراق صعودی: 1. الرفض من الدعم بالقرب من 3,920 دولارًا. 2. الاستمرار فی الارتفاع من خلال مستوى المقاومة المتوسط عند 4,045 دولارًا. 3. الهدف النهائی المتوقع یقترب من 4,125 دولارًا. یتوافق هذا move مع هیکل أعلى وأعلى مستوى منخفض، مما یعنی احتمال استمرار الزخم الصعودی إذا استمر السعر فوق 4000 دولار. ⚠️ مشاهدة المستویات الإبطال: قد یؤدی الاختراق والإغلاق تحت مستوى 3,920 دولارًا إلى إبطال السیناریو الصعودی وإعادة ظهور الضغط الهبوطی. التأکید: الإغلاق القوی فوق 4,050 دولار أمریکی سیؤکد الاستمرار الصعودی نحو منطقة 4,125 دولار أمریکی.
DOCTOR_PIPS05
تحلیل DOT/USDT: آیا فرصت خرید در حمایت $2.45 شکل گرفته است؟ (پیشبینی صعود تا $3.00)
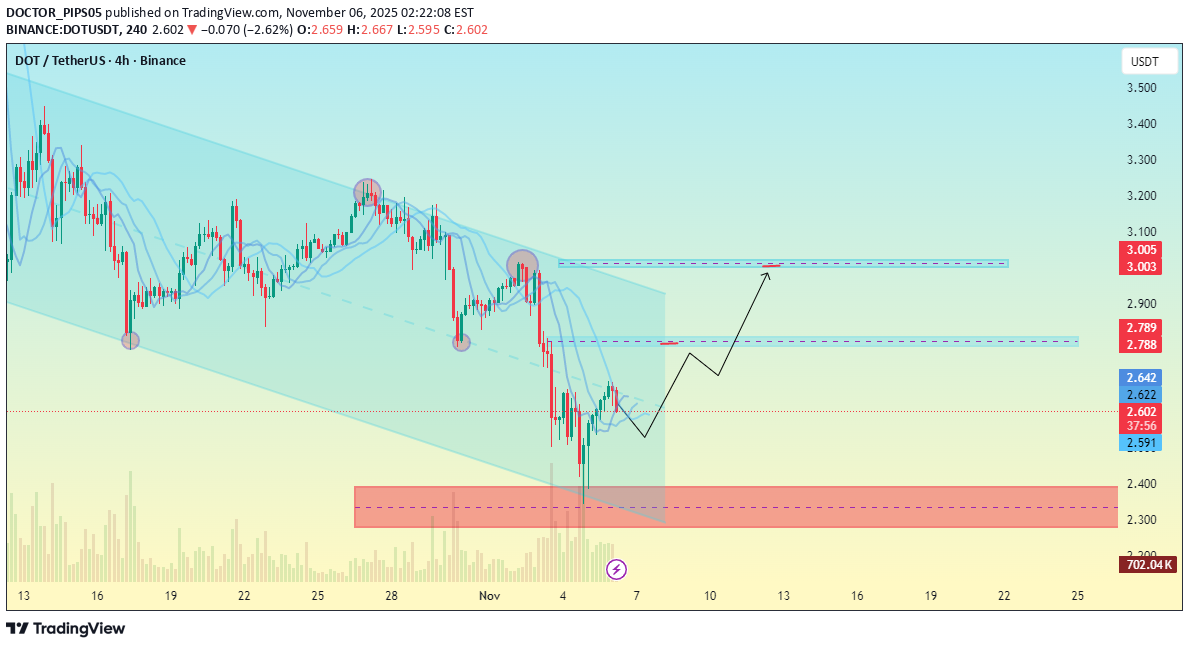
الهیکل العام: کان السعر یتحرک داخل قناة هابطة، مشکلاً قمم أدنى وأدنى مستویات أدنى - وهو نمط اتجاه هبوطی واضح. منطقة السعر الحالیة: حوالی 2.60 دولار، أعلى بقلیل من أدنى مستویات التأرجح الأخیرة. منطقة الدعم (المربع الوردی): ما بین 2.35 دولارًا أمریکیًا – 2.45 دولارًا أمریکیًا تقریبًا، مما یمثل منطقة طلب قویة حیث ارتد السعر سابقًا. الإسقاط: یشیر الرسم البیانی إلى تصحیح صعودی أو انعکاس محتمل من الحد السفلی للقناة. یشیر الإسقاط المرسوم إلى ارتفاع move نحو مستوى المقاومة 2.78 دولار - 2.79 دولار أولاً، ثم امتداد محتمل إلى 3.00 - 3.01 دولار، والذی یتماشى مع الارتفاع السابق وحدود القناة العلیا. مستویات المقاومة الرئیسیة: 2.78 دولار – 2.79 دولار: مقاومة على المدى القریب، منطقة رد فعل محتملة. 3.00 دولار – 3.01 دولار: منطقة مقاومة قویة؛ الاختراق هنا یمکن أن یؤکد انعکاس الاتجاه. مستویات الدعم الرئیسیة: 2.59 دولار - 2.60 دولار: دعم محلی فوری. 2.35 دولار – 2.45 دولار: منطقة دعم أقوى (باللون الوردی). 📊 الملخص: یشیر التحلیل إلى حدوث انتعاش صعودی محتمل من منطقة الدعم نحو 2.78 دولار وربما 3.00 دولار، ** بشرط أن یظل السعر فوق 2.50 دولار. إذا انخفض إلى ما دون 2.45 دولار، فسوف تضعف التوقعات الصعودیة.
DOCTOR_PIPS05
تحلیل تکنیکال DOT/USDT: آماده ریزش به کدام کف قیمتی؟

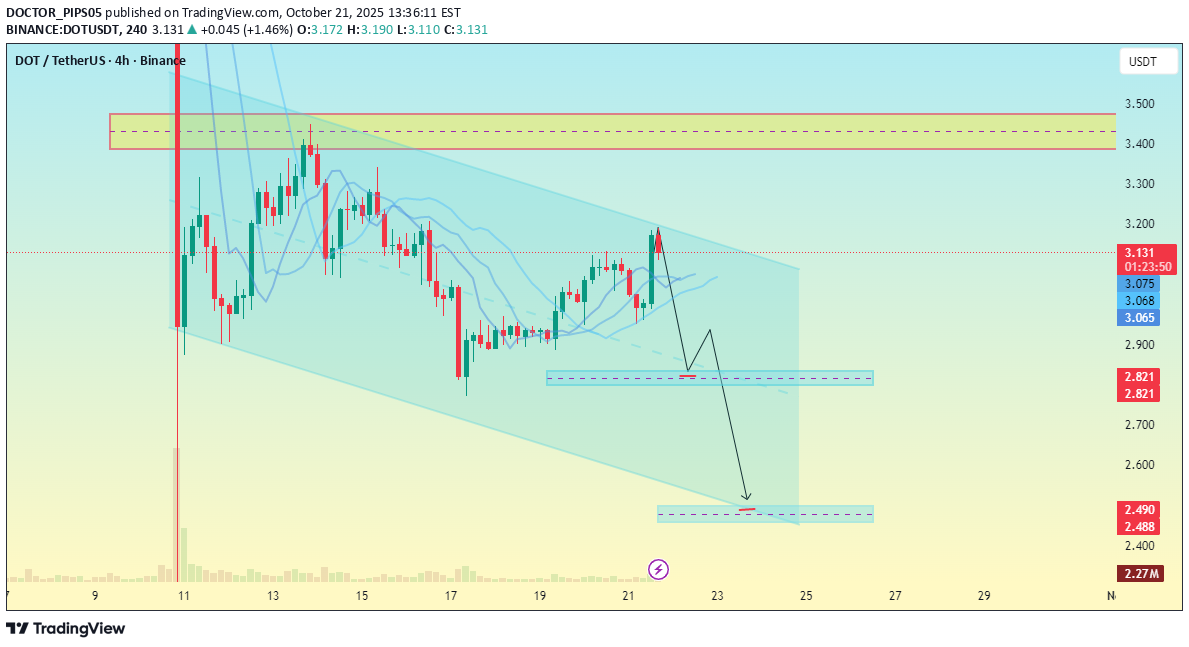
الهیکل العام یظهر الرسم البیانی قناة هابطة - یحترم السعر حدود خط الاتجاه العلوی والسفلی. ویبلغ السعر الحالی حوالی 2.79 دولارًا، بالقرب من النطاق المتوسط للقناة. 🟣 المنطقة الرئیسیة (المقاومة) المنطقة الوردیة/الحمراء الواقعة بین 3.20 دولارًا و3.30 دولارًا هی منطقة العرض/المقاومة major. لقد تفاعل السعر هناک عدة مرات قبل أن ینخفض. تشیر الأسهم إلى أنک تتوقع رفضًا آخر من تلک المنطقة. 🔻 السیناریو الهبوطی (إسقاطک) یظهر move المسقط: 1. التراجع نحو 3.00 دولار - 3.20 دولار، ومن المحتمل أن یکون مقاومة. 2. ثم انعکاس هبوطی یتبع اتجاه القناة. 3. الهدف الأول: منطقة 2.63 دولارًا – 2.64 دولارًا (منطقة الدعم المحلیة). 4. الهدف الممتد: منطقة 2.37 دولارًا – 2.37 دولارًا، بالقرب من الحد السفلی للقناة. 📊 سیاق السوق وطالما ظل السعر أقل من 3.00 دولار - 3.20 دولار، فإن الزخم یمیل إلى الاتجاه الهبوطی. قد یؤدی الاختراق فوق 3.30 دولارًا أمریکیًا بحجم قوی إلى إبطال الإعداد الهبوطی وفتح المجال أمام 3.50 دولارًا أمریکیًا أو أکثر. ⚙️ ملخص مستوى نوع التوقعات 3.20 دولار - 3.30 دولار للمقاومة/العرض، منطقة الرفض المحتملة 2.63 دولار - 2.64 دولار دعم 1 الهدف الهبوطی الأول $2.37دعم 2الهدف الهبوطی النهائی فوق 3.30 دولار، من الممکن انعکاس الاتجاه
DOCTOR_PIPS05
پیشبینی صعودی بیت کوین: آیا BTC به هدف ۱۲۲ هزار دلاری میرسد؟
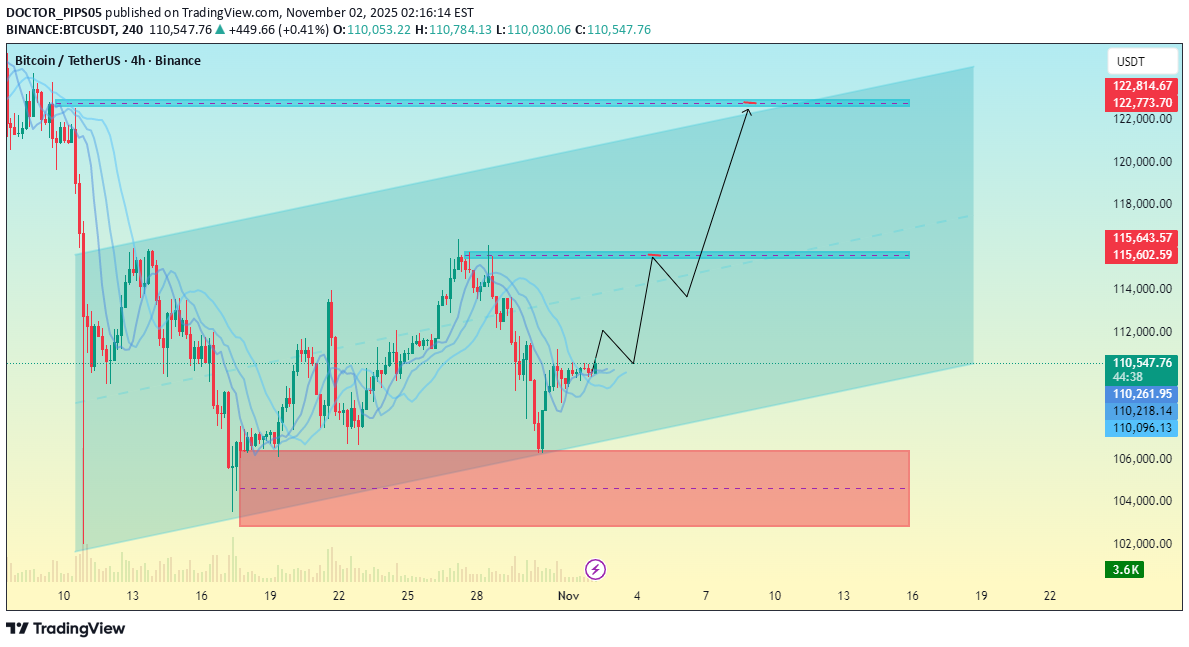
السعر: حوالی 110,600 دولار أمریکی، ویتم التداول ضمن قناة صاعدة (باللون الأزرق). منطقة الدعم: المربع الوردی یتراوح ما بین 104,000 إلى 106,000 دولار تقریبًا، مما یُظهر منطقة طلب قویة أو منطقة تراکم سابقة. الهیکل الحالی: یشیر الارتداد الأخیر من تلک المنطقة الوردیة إلى قاع أعلى محتمل، وربما یبدأ موجة صعودیة جدیدة. مناطق المقاومة: المقاومة على المدى القریب: حوالی 115000-115600 دولار، حیث رسمت منطقة زرقاء أفقیة متوسطة القناة - قد تکون هذه act منطقة الاختبار الأولى. Major الهدف/المقاومة: حوالی 122,000-124,000 دولار أمریکی عند خط القناة العلوی - ومن المحتمل أن یکون هدفک الصعودی النهائی. یُظهر المسار المتوقع بنیة موجة صعودیة، متوقعًا أن یعید BTC اختبار 115 ألف دولار، ثم یتماسک، ثم یستمر نحو 122 ألف دولار. باختصار: ✅ تحیز صعودی مع دعم أعلى من 106 ألف دولار. ⚠️ شاهد رد الفعل بالقرب من 115 ألف دولار — قد یؤدی الرفض هناک إلى تراجع قصیر المدى قبل الاستمرار. 📈 الاختراق والثبات فوق مستوى 115.6 ألف دولار سیؤکد الزخم نحو قمة القناة عند 122 ألف دولار.
DOCTOR_PIPS05
تحلیل طلای امروز: خیز قدرتمند به سمت ۴۱۵۰ دلار | فرصت خرید طلا (XAU/USD)
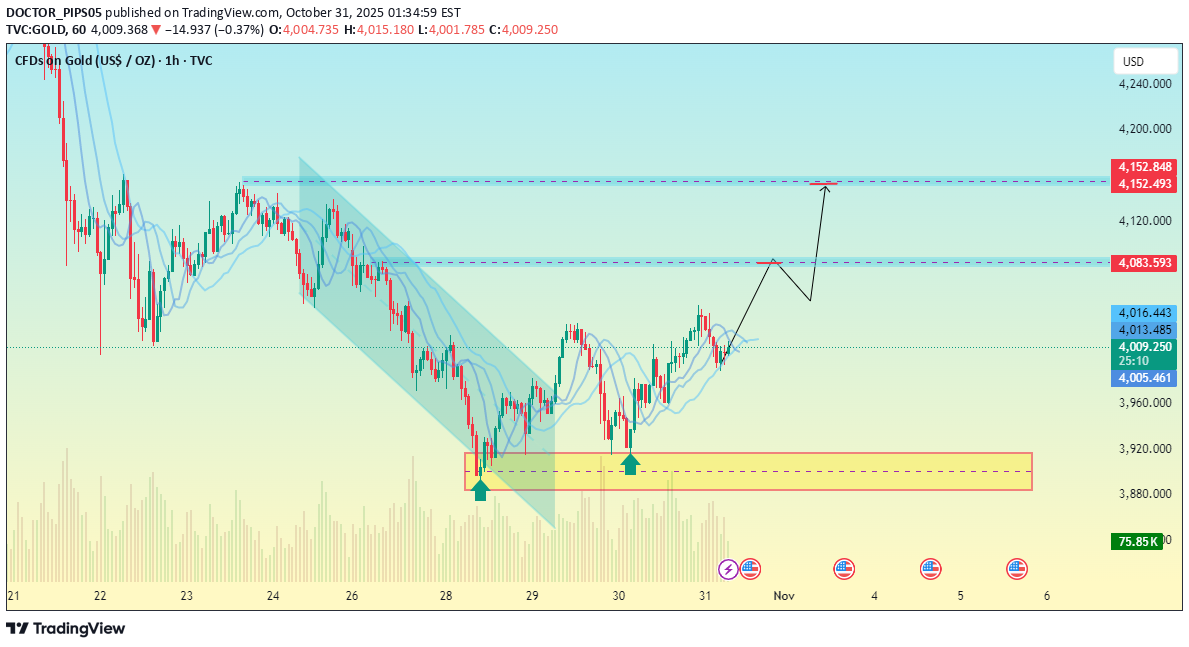
نظرة عامة الحالیة السعر: حوالی 4,009 دولار فی وقت الرسم البیانی. یظهر الرسم البیانی انتعاشًا صعودیًا بعد لمس منطقة الدعم بالقرب من 3884 دولارًا (المربع الأصفر). هناک قناة هبوطیة واضحة تم اختراقها للأعلى - مما یشیر إلى انعکاس محتمل للاتجاه. 🔹 المناطق الرئیسیة منطقة الدعم: 🟡 3,880 دولارًا - 3,900 دولارًا → منطقة طلب قویة حیث یدخل المشترون. المقاومة الفوریة: 🔵 4,083 دولارًا - 4,100 دولار → قد یعید السعر اختبار هذه المنطقة قبل المتابعة. Major المنطقة المستهدفة: 🔵 4,150 دولارًا - 4,160 دولارًا → تم تحدیدها على أنها منطقة الهدف الصعودی التالیة. 🔹 النمط والهیکل یصور الرسم البیانی نموذج استمراری صعودی محتمل: 1. کسر القناة الهابطة. 2. من المتوقع إعادة الاختبار بحوالی 4,083 دولارًا (الدعم الذی تحول إلى مقاومة). 3. الاستمرار نحو 4,150 دولارًا أمریکیًا+. یشیر هذا إلى أن المتداولین ربما یبحثون عن: شراء الإدخالات: ما یقرب من 4000 دولار - 4020 دولار بعد عملیات التراجع الطفیفة. الهدف: 4,150 دولارًا - 4,160 دولارًا. وقف الخسارة: أقل من منطقة الدعم ٣٨٨٠ دولارًا. 🔹 المؤشرات خطوط بولینجر: یتحرک السعر نحو الجزء العلوی band - ویبدو الزخم صعودیًا. الحجم: یرتفع قلیلاً، مما یشیر إلى تزاید ضغط الشراء. --- 📊 ملخص التحیز: صعودی (على المدى القصیر). المقاومة الرئیسیة التالیة: 4,083 دولارًا → 4,150 دولارًا. الدعم الحرج: 3,880 دولارًا. إذا أغلق السعر فوق 4,083 دولارًا أمریکیًا، فتوقع استمرارًا نحو 4,150 دولارًا أمریکیًا - 4,160 دولارًا أمریکیًا. سیؤدی الاختراق إلى ما دون 3880 دولارًا إلى إبطال الإعداد الصعودی وتحویل الترکیز مرة أخرى إلى الأهداف الهبوطیة.
DOCTOR_PIPS05
تحلیل طلا (XAU/USD) در تایم فریم ۱ ساعته: آیا کانال نزولی شکسته میشود یا حمایت ۳۹۵۰ حفظ میشود؟
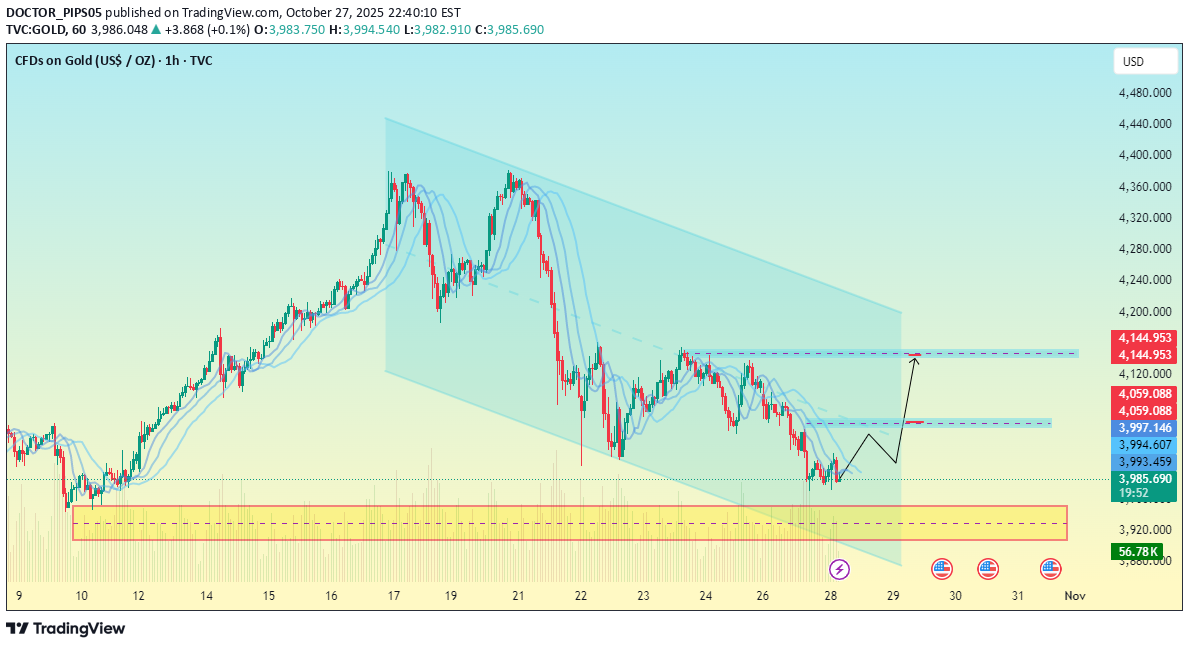
إطار الإطار: 1H السعر الحالی: حوالی 3,991 دولارًا الهیکل العام: نمط القناة الهابطة (یحقق السعر قمم أدنى وأدنى مستویات أدنى). المناطق الممیزة: المنطقة الصفراء (أسفل): منطقة دعم قویة — منطقة التراکم السابقة حیث دخل المشترون من قبل. المناطق الزرقاء: مستویات مقاومة قصیرة المدى، تشیر إلى نقاط جنی الأرباح أو التراجع المحتملة. 📊 التفسیر الفنی 1. منطقة الدعم (3,950 – 3,980): ارتد السعر من هذه المنطقة، مشکلًا قاعًا مزدوجًا أو هیکلًا انعکاسیًا محتملًا. المشترین الذین یدافعون عن هذه المنطقة یشیرون إلى الطلب القوی. 2. الهدف الأول / المقاومة: حوالی 4,080 – 4,100، موضحة بالخط الأزرق الأول. یمکن أن نرى بعض التراجع هنا إذا ضعف الزخم. 3. الهدف الثانی: حوالی 4140 – 4160 بالقرب من الحد العلوی للقناة. یتماشى هذا مع المسار المتوقع ("على شکل حرف V" move على الرسم البیانی). 4. دینامیات القناة: القناة الهابطة سلیمة، لذا ما لم یحدث اختراق فوق خط الاتجاه العلوی، فإن الاتجاه العام یظل هبوطیًا. یشیر الاختراق فوق مستوى 4,160 إلى انعکاس محتمل للاتجاه نحو الاتجاه الصعودی. 🧭 السیناریوهات المحتملة الحالة الصعودیة: الارتداد من الدعم ← إعادة اختبار 4,100 ← التعزیز ← الاستمرار نحو 4,160. الحالة الهبوطیة: الفشل فی الثبات فوق 3,980 ← الانهیار نحو منطقة الدعم 3,920-3,900. ⚙️ منظور التداول منطقة الشراء: 3,970 – 3,990 (إذا استمر الدعم) الأهداف: 4,100 / 4,160 إیقاف الخسارة: أقل من 3,950 للحمایة من الهبوط الأعمق.
DOCTOR_PIPS05
تحلیل DOT/USDT: سقوط به کدام سطح حمایتی در کانال نزولی؟
یظهر الرسم البیانی نمط قناة هابط (هیکل هبوطی). السعر الحالی حوالی 3.14 دولار أمریکی. توجد منطقة مقاومة بالقرب من 3.40-3.45 دولار أمریکی (مظللة باللون الأصفر)، وتتوافق مع الحد العلوی للقناة. لقد رسمت منطقتین محتملتین للطلب: أولاً حوالی 2.85-2.80 دولارًا أمریکیًا الثانی (الدعم الأعمق) حوالی 2.50-2.45 دولارًا أمریکیًا یُظهر مسار السعر المتوقع رفضًا محتملاً من القناة العلویة، واستمرارًا للأسفل، وهبوطًا نحو مناطق الطلب تلک. ملخص فنی: 🔹التحیز: هبوطی على المدى القصیر 🔹 الهیکل: احترام السعر للقناة الهابطة 🔹 التأکید: الاختراق تحت ~3.00 قد یؤدی إلى تسارع move إلى 2.85 أو 2.50 🔹 الإبطال: الاختراق والإغلاق فوق 3.45 من شأنه أن یبطل الاتجاه الهبوطی وقد یبدأ انعکاس الاتجاه.
DOCTOR_PIPS05
تحلیل تکنیکال اتریوم (ETH/USD): مسیر صعودی تا ۴۶۶۰ دلار یا سقوط زیر ۳۷۵۰ دلار؟
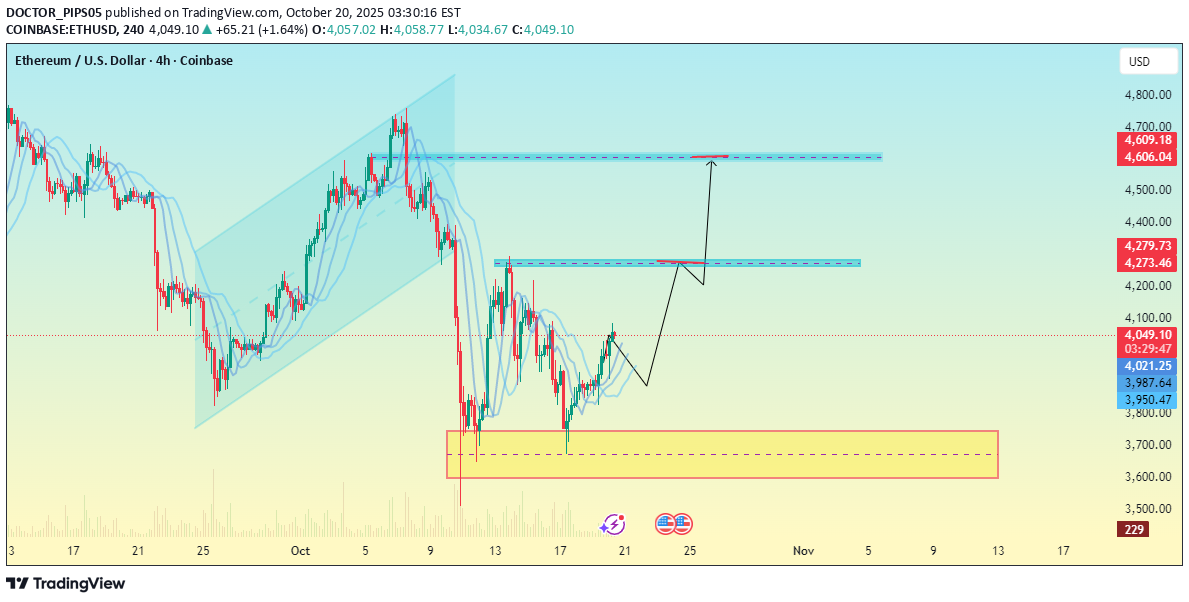
منطقة السعر الحالیة: حوالی 3,997 دولارًا أمریکیًا، مع وجود ارتفاع صغیر move مرئی. منطقة الدعم (المنطقة الصفراء): ما یقرب من 3600 دولار - 3750 دولارًا، مما یوضح آخر منطقة طلب قویة حیث انعکس السعر سابقًا. منطقة المقاومة الأولى (المربع الأزرق): حوالی 4,270 دولارًا - 4,280 دولارًا، حیث قد یواجه السعر ضغوط بیع أولیة. منطقة الهدف الثانیة (المربع الأزرق العلوی): بالقرب من 4,600 دولار - 4,660 دولار، والذی یبدو أنه هدفک الصعودی الرئیسی. المسار المتوقع: تشیر الأسهم المرسومة إلى هیکل صعودی، متوقعًا تراجعًا قصیرًا من المستویات الحالیة قبل الاستمرار فی الارتفاع - وهو کسر محتمل للهیکل وإعادة اختبار الإعداد. العرض الفنی: یشیر الرسم البیانی إلى انعکاس صعودی محتمل خارج منطقة الدعم الصفراء. إذا ظل ETH أعلى من 3900 دولار - 3950 دولارًا، فإن الأهداف الصعودیة المنطقیة التالیة هی 4270 دولارًا و4660 دولارًا. الانخفاض إلى ما دون 3750 دولارًا من شأنه أن یبطل هذا السیناریو الصعودی ویفتح الباب لمزید من الهبوط.
DOCTOR_PIPS05
تحلیل طلا (XAU/USD) روی نمودار ۴ ساعته: آمادهسازی برای ریزش یا ادامه صعود؟ (سطوح کلیدی)
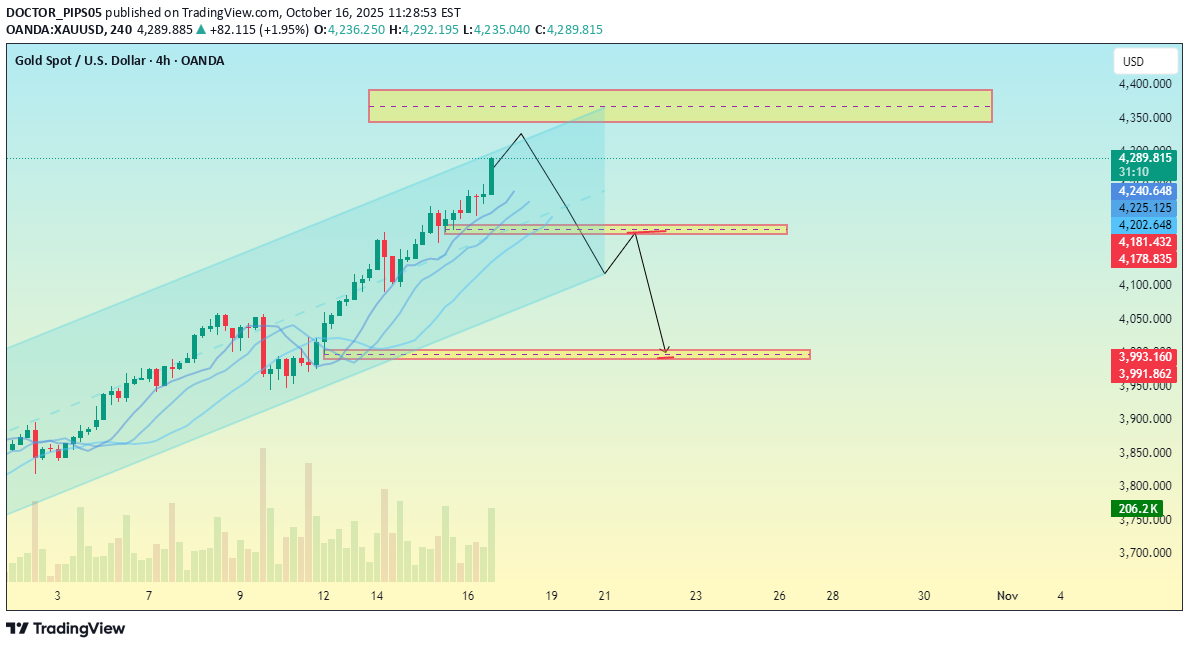
هیکل الرسم البیانی یظهر الرسم البیانی قناة صاعدة قویة - یتجه السعر صعودًا ضمن قناة موازیة محددة بوضوح. یقع السعر حالیًا بالقرب من الحد العلوی لهذه القناة الصعودیة، مما یشیر إلى احتمالیة التمدد المفرط أو منطقة الارتداد المحتملة. 🟨 المناطق الممیزة 1. المربع الأصفر العلوی (حوالی 4,389 – 4,360): من المحتمل أن تکون منطقة مقاومة / منطقة انعکاس محتملة. یشیر سهم الإسقاط من هذه المنطقة إلى تراجع محتمل من هذا المستوى. 2. المربع الأصفر الأوسط (حوالی 4178): یبدو أنها منطقة دعم أو إعادة اختبار — ربما حیث یمکن أن یتراجع السعر إلیها بعد رفض القناة العلیا. 3. المربع الأصفر السفلی (حوالی 3991): یشیر إلى هدف دعم أعمق إذا استمر التصحیح - وربما هدف استمرار هبوطی إذا فشل الدعم المتوسط. 📉 السیناریو مصور یبدو أن الرسم البیانی یوضح الإعداد الهبوطی المحتمل بعد الارتفاع الصعودی الحالی: 1. یصل السعر إلى منطقة المقاومة الصفراء العلیا. 2. یبدأ التراجع نحو مستوى الدعم المتوسط (4,178). 3. إذا استمر الزخم فی الانخفاض، فقد یصل إلى الهدف الأدنى (حوالی 3,991). ⚙️ ملخص التحلیل الاتجاه: صاعد بشکل عام (لا یزال داخل القناة الصاعدة). التوقعات على المدى القصیر: تراجع أو تصحیح محتمل بعد اختبار المقاومة العلیا. المستویات الرئیسیة: المقاومة: ~4,389 الدعم 1: ~4,178 الدعم 2: ~3,991
DOCTOR_PIPS05
تحلیل تکنیکال طلا (XAU/USD): پیشبینی صعود قوی و اهداف قیمتی کلیدی در نمودار 5 دقیقهای
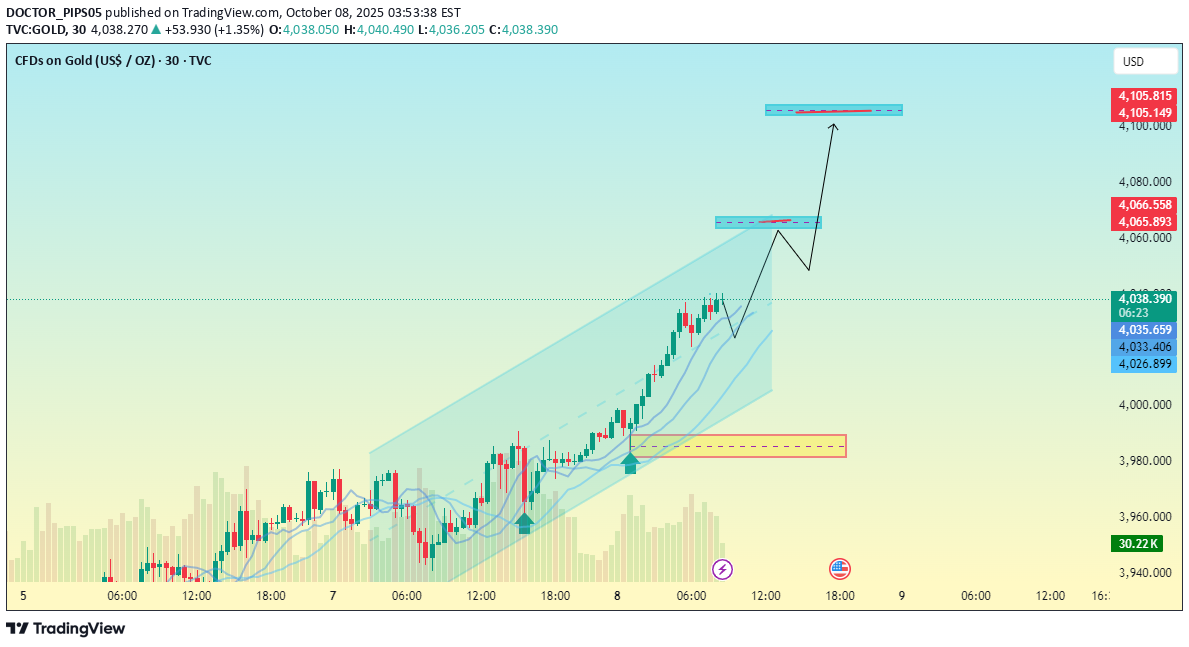
السعر الحالی: حوالی 4،035 دولار (اعتبارًا من لقطة الشاشة). الاتجاه: من الواضح فی اتجاه صعود قوی ، مما یجعل أعلى مستویاته وأدنى مستویاتها. مناطق ملحوظة: منطقة الطلب (الدعم) حوالی 3،986 دولار - 4000 دولار ، معروضة باللون الأصفر فی الأسفل - من المحتمل أن تکون قاعدتک الصعودیة. الهدف الأول/منطقة التورید بالقرب من 4،057 دولار - 4،058 دولار (الصندوق الأزرق فی الوسط). الهدف الثانی/منطقة التورید حوالی 4،101 دولار - 4،102 دولار (الصندوق الأزرق فی الأعلى). الإسقاط: یشیر الرسم إلى وجود بدیل متوقع (تراجع بسیط نحو مساحة 4،020 - 4،025 دولارًا) قبل استمرار صعودًا نحو المنطقة المستهدفة الأولى (4،057 دولار) ، ثم یحتمل أن یکون إلى الهدف الثانی (4،101 دولار). ملخص الإعداد: التحیز: استمرار صعود الإدخال المحتمل: حوالی 4،020 دولار - 4،025 دولار (بعد التراجع) الأهداف: TP1: 4،057 دولار TP2: 4،101 دولار إبطال (فکرة توقف الخسارة): أقل من 4000 دولار-3،986 دولار منطقة
إخلاء المسؤولية
أي محتوى ومواد مدرجة في موقع Sahmeto وقنوات الاتصال الرسمية هي عبارة عن تجميع للآراء والتحليلات الشخصية وغير ملزمة. لا تشكل أي توصية للشراء أو البيع أو الدخول أو الخروج من سوق الأوراق المالية وسوق العملات المشفرة. كما أن جميع الأخبار والتحليلات المدرجة في الموقع والقنوات هي مجرد معلومات منشورة من مصادر رسمية وغير رسمية محلية وأجنبية، ومن الواضح أن مستخدمي المحتوى المذكور مسؤولون عن متابعة وضمان أصالة ودقة المواد. لذلك، مع إخلاء المسؤولية، يُعلن أن المسؤولية عن أي اتخاذ قرار وإجراء وأي ربح وخسارة محتملة في سوق رأس المال وسوق العملات المشفرة تقع على عاتق المتداول.