ActivTrades
@t_ActivTrades

ما هو الشيء الذي ننصحك بشراءه من المواد الغذائية؟
سابق في الشراء
پیام های تریدر
مرشح
ActivTrades
بیت کوین زیر ۹۰ هزار دلار سقوط کرد: زنگ خطر در بازار به صدا درآمد!
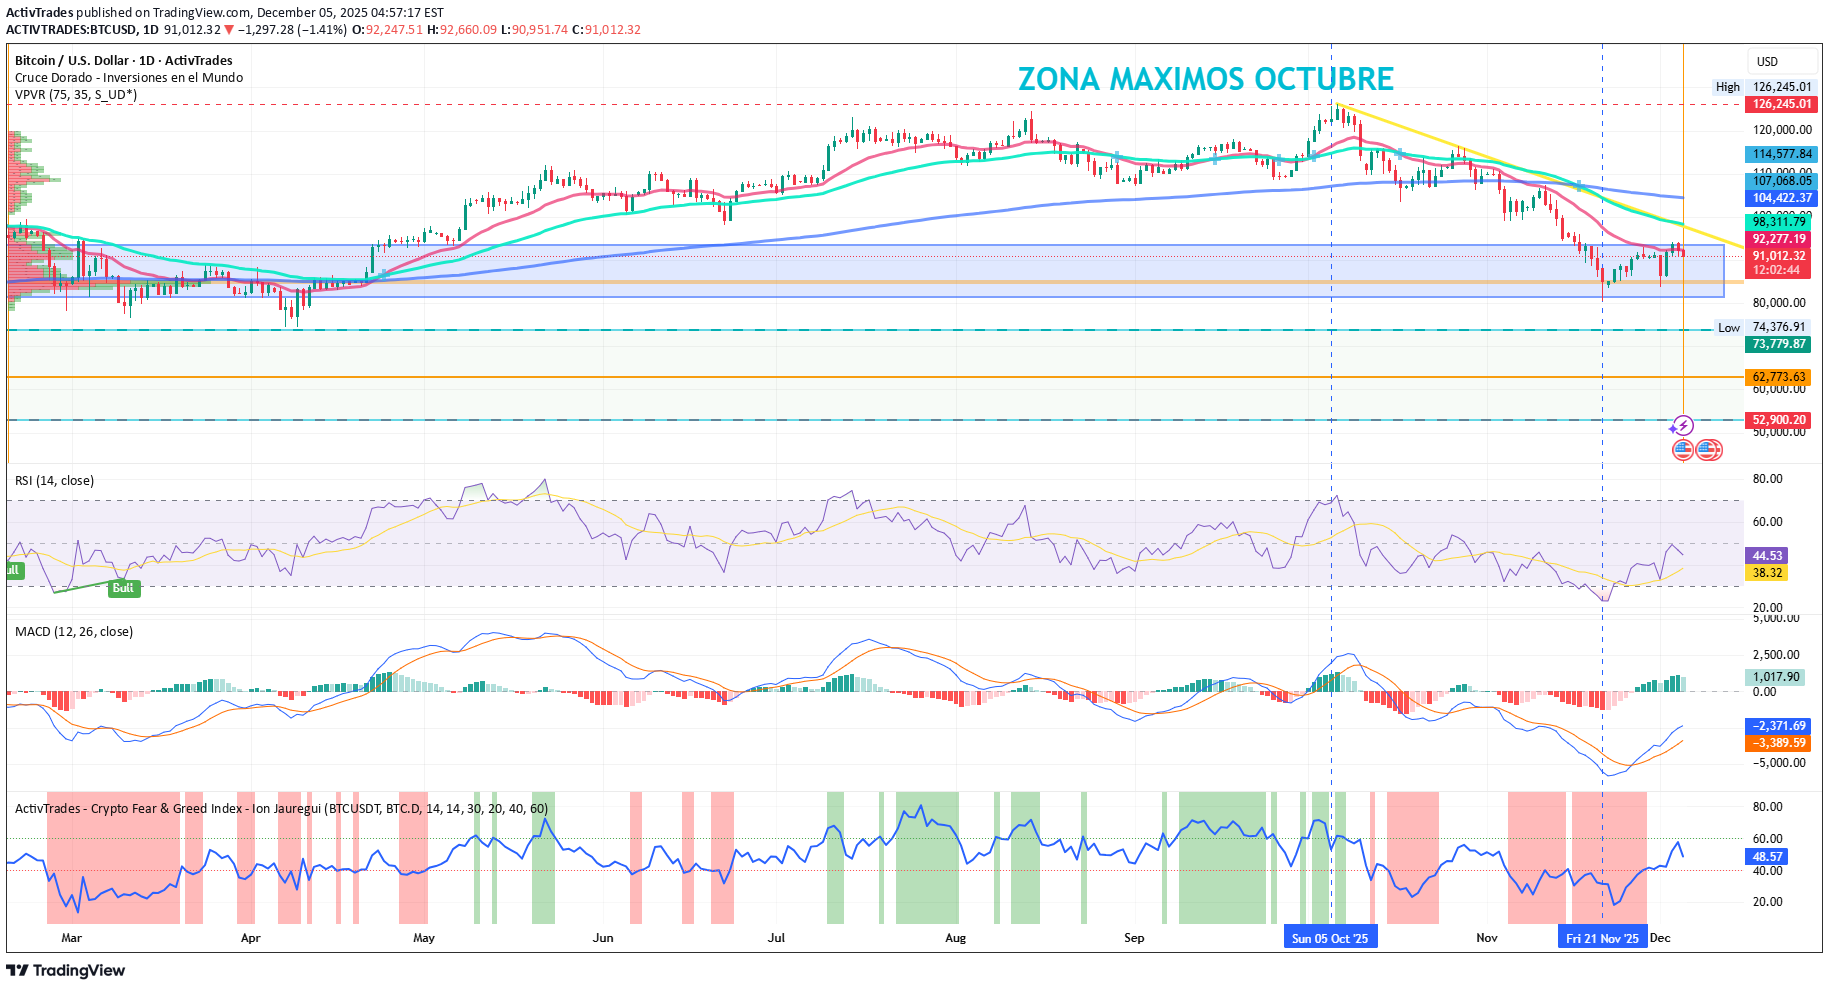
بقلم أیون جوریجوی – محلل لدى ActivTrades یمر Bitcoin (BTCUSD) بلحظة تاریخیة مهمة. بعد أسابیع من الارتفاعات إلى أعلى مستویاتها على الإطلاق عند 126,245.01 دولارًا أمریکیًا فی أکتوبر 2025، شهدنا سلسلة من الانخفاضات التی وصلت إلى أدنى مستوى فی 21 نوفمبر، والعودة إلى مناطق الأسعار اعتبارًا من نوفمبر 2024، بالتزامن مع النصف الأخیر فی 20/04/2024. بعد أسبوعین من الاستقرار فوق 94,000 دولار أمریکی، کسرت العملة المشفرة مستوى دعم رئیسی وانخفضت إلى أقل من 90,000 دولار أمریکی، مما أثار قلقًا واسع النطاق فی السوق. یمثل الاختراق اختراقًا فنیًا وأساسیًا یمکن أن یحدد تطور الأسعار فی الأیام المقبلة. امتد الحد الأدنى الحالی إلى 80,612.40 دولارًا أمریکیًا، وهی منطقة سعریة قریبة جدًا من نطاق ما قبل الاندفاع. کان مستوى 94,000 دولار أمریکی بمثابة "الأرضیة الطبیعیة" لـ Bitcoin. ووفقا لتقدیرات جی بی مورغان الأخیرة، فإن هذا المبلغ یتزامن مع متوسط تکلفة إنتاج العملة المشفرة، مما یشیر إلى أن التعدین بسعر أقل من هذا السعر لم یعد مربحا للعدید من المشغلین. بالإضافة إلى ذلک، تلعب شرکات مثل Strategy، التی تمتلک أکثر من 650.000 BTC فی خزانتها، دورًا حاسمًا. ویتیح لهم الاحتیاطی النقدی البالغ 1.44 ملیار دولار أمریکی تغطیة التزاماتهم المالیة دون الحاجة إلى بیع أصولهم، مما یوفر درجة من استقرار السوق. لم یعکس کسر هذا الدعم الضغط الفنی فحسب، بل یعکس أیضًا بیئة الاقتصاد الکلی غیر المؤکدة لبیتکوین، وسط تزاید المخاطر والمستثمرین المؤسسیین الذین یبحثون عن خیارات استثمار أقل تقلبًا. إذا وصل السعر إلى دعم النطاق السابق فوق 73779.87 دولارًا أمریکیًا، فقد نشهد فترة من إغلاق الفجوة. من ناحیة أخرى، إذا صمد السعر، فقد نشهد فترة من التماسک الجانبی. وعلى المدى المتوسط، تظل التوقعات إیجابیة إذا استمر الطلب المؤسسی والظروف الکلیة المستقرة: Bitcoin قد تعود إلى مستویات قریبة من أعلى مستویاتها هذا العام فی الأشهر الستة إلى الاثنی عشر المقبلة. لکن أی حدث سلبی قد یطیل فترة الضعف. التحلیل الفنی من الناحیة الفنیة، یؤکد کسر مستوى 90.000 دولار أمریکی اختراق النطاق الجانبی الذی کان یحتوی على BTC فی الأسابیع الأخیرة: الدعم والمقاومة: کانت منطقة 90.000-94.000 دولار أمریکی بمثابة مرجع رئیسی. ویفتح اختراقها المجال لانخفاض محتمل نحو النطاق 80612.40-42900.20، حیث تتزامن التصحیحات التاریخیة ومستویات الطلب. مستویات التعافی: سیواجه الارتداد مقاومة فوریة عند 94000 دولار أمریکی ثم عند 97000-98000 دولار أمریکی. تجاوز هذه المستویات قد یؤدی إلى استقرار السوق مؤقتًا. التقلب والتوحید: الزیادة فی الحجم تشیر إلى العصبیة وتعدیلات الموقف. یجب على المتداولین مراقبة الحرکات اللحظیة وتشکیلات الشموع الرئیسیة لاکتشاف إشارات الارتداد المحتملة. یقع مؤشر القوة النسبیة حالیًا فی منطقة بحث محایدة عند 45.21%، ویقع مؤشر MACD فی المنطقة السلبیة، مما یؤکد نظریة الانتعاش هذه. إذا نظرنا إلى مؤشر ActivTrades – مؤشر الخوف والجشع للعملات المشفرة، فستجد أن movement محاید حالیًا ولا یفضل العملات البدیلة. خلال الانخفاضات، تم الکشف عن نسبة عالیة من المخاطرة، ولکن فی هذه اللحظة یتم إدراک التوازن. الحیتان یجمع انخفاض عملة البیتکوین إلى ما دون 90,000 دولار أمریکی بین العوامل الأساسیة والفنیة: ضغط عمال المناجم، وتأثیر کبار المالکین، وعدم الیقین فی الاقتصاد الکلی. وفی هذه الفترة التی تتسم بالتقلبات الشدیدة، لا یمکن الحفاظ على الحیطة إلا من خلال مراقبة العرض المؤسسی ونشاط التعدین عن کثب. قد تمثل هذه المرحلة تراجعًا مؤقتًا، لکنها تمثل أیضًا فرصة تراکمیة استراتیجیة على المدى المتوسط لـ "حاملی العملات المشفرة". ویمکن أن تکون أیضًا منطقة دخول محتملة للمستثمرین المؤسسیین الذین یبحثون عن أسعار مخفضة للدخول إلى صنادیق الاستثمار المتداولة التی یدیرها مدیرو الأصول الکبار. ********************************************************************************************************************************************************************************************************************************************* المعلومات المقدمة لا تشکل بحثًا استثماریًا. لم یتم إعداد المادة وفقًا للمتطلبات القانونیة المصممة لتعزیز استقلالیة أبحاث الاستثمار وینبغی اعتبار ذلک بمثابة اتصالات تسویقیة. تم إعداد جمیع المعلومات بواسطة ActivTrades ("AT"). ولا تحتوی المعلومات على سجل لأسعار AT، أو عرضًا أو التماسًا لمعاملة فی أی أداة مالیة. لا یتم تقدیم أی تمثیل أو ضمان فیما یتعلق بدقة أو اکتمال هذه المعلومات. لا تأخذ أی مادة مقدمة فی الاعتبار الهدف الاستثماری المحدد والوضع المالی لأی شخص قد یحصل علیها. الأداء السابق والتنبؤ لیسا مرادفین لمؤشر موثوق للأداء المستقبلی. توفر AT خدمة التنفیذ فقط. وبالتالی، فإن أی شخص یتصرف بناءً على المعلومات المقدمة یفعل ذلک على مسؤولیته الخاصة. المخاطر السیاسیة لا یمکن التنبؤ بها. یمکن أن تختلف إجراءات البنک المرکزی. أدوات النظام الأساسی لا تضمن النجاح.
ActivTrades
آیفون 17 رکورد فروش اپل را شکست: راز رشد 14 درصدی در 10 روز!
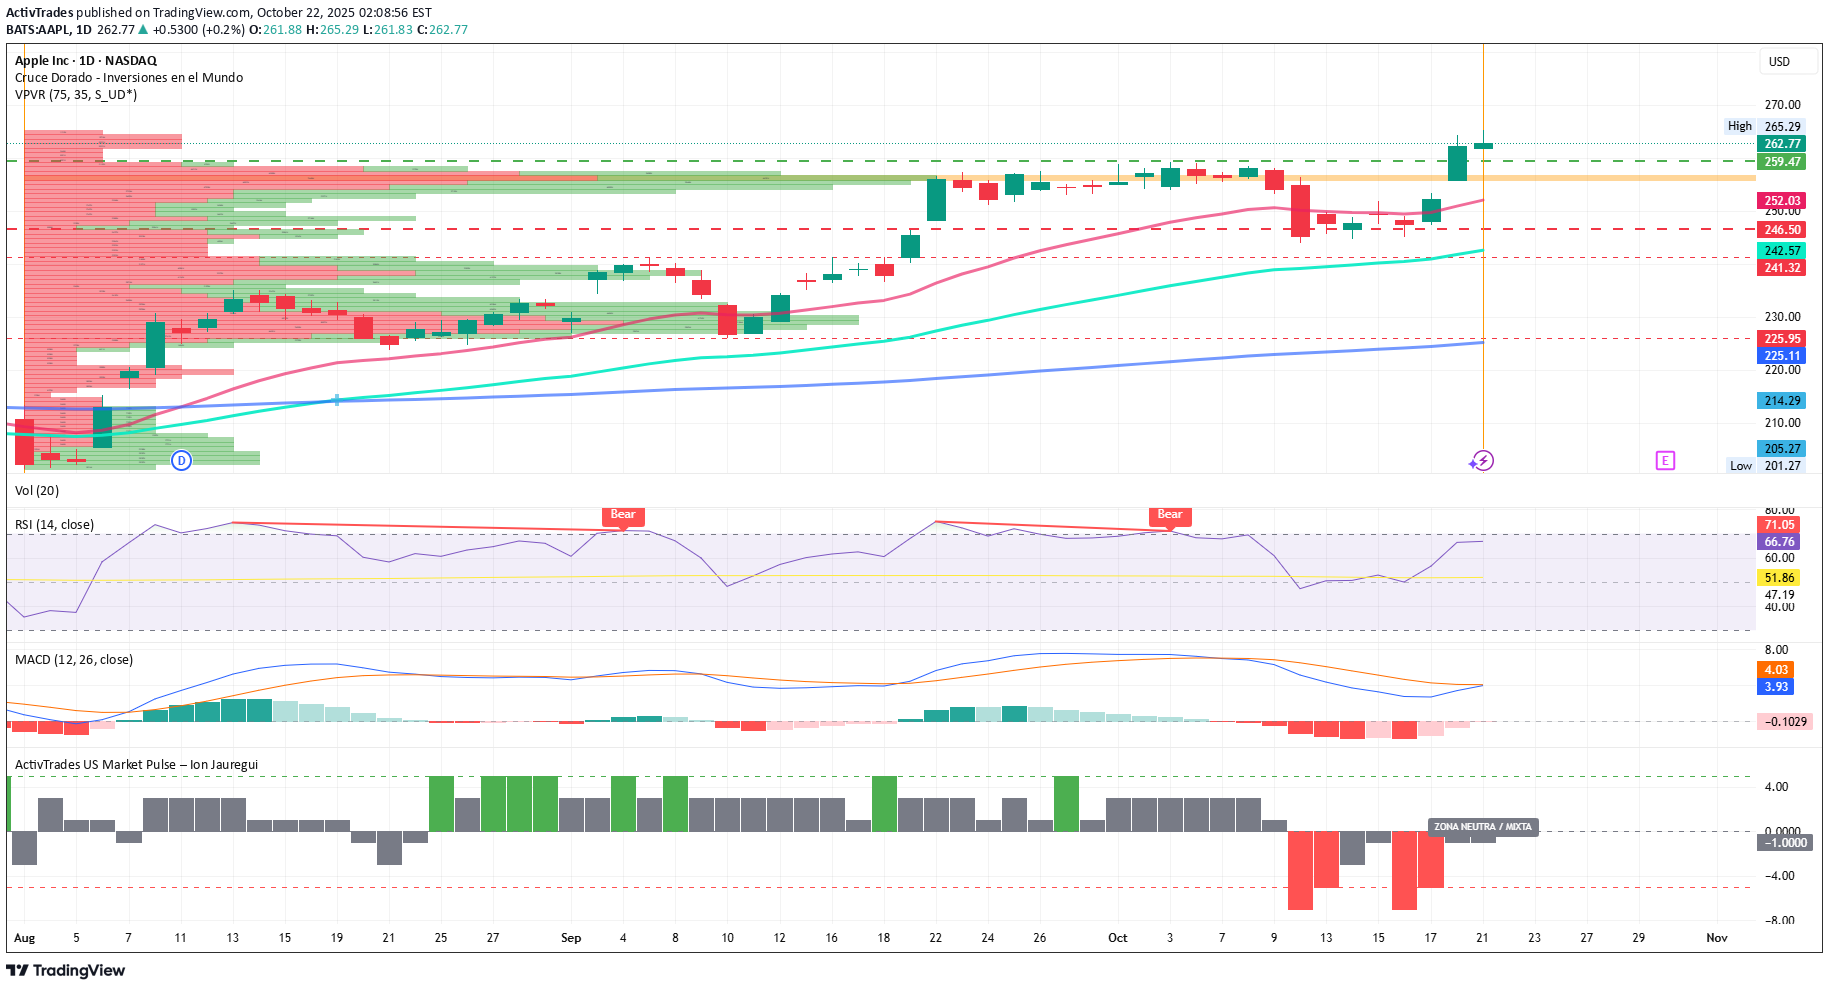
Apple تحطم التوقعات مع iPhone 17: ارتفاع المبیعات بنسبة 14% فی 10 أیام فقط بقلم أیون جوریجوی – محلل لدى ActivTrades حققت شرکة Apple (NASDAQ: AAPL) إنجازًا جریئًا آخر مع إطلاق هاتف iPhone 17. ووفقًا لشرکة Counterpoint، فقد تم بیع أحدث طراز بنسبة 14% أکثر من iPhone 16 فی أول 10 أیام له فی الأسواق الرئیسیة مثل الصین والولایات المتحدة. وکان النمو أکثر وضوحًا فی الصین، حیث ضاعف النموذج الأساسی مبیعاته تقریبًا مقارنة بجهاز iPhone 16. وبشکل عام، ارتفعت المبیعات فی کلا السوقین بنسبة 31%، مما عزز مکانة شرکة Apple کشرکة رائدة فی هذا القطاع بلا منازع. یبدو السبب وراء هذا النجاح بسیطًا ولکنه فعال: شریحة أفضل، وشاشة محسنة، وکامیرا front مطورة، وسعة تخزین أکبر، کل ذلک مع الحفاظ على نفس سعر العام الماضی. وقد أثبتت استراتیجیة شرکة أبل "المزید لنفس الشیء"، حتى الآن على الأقل، أنها مربحة للغایة. التحلیل الفنی AAPL من الناحیة الفنیة، تظهر أسهم شرکة Apple زخمًا صعودیًا قویًا بعد إعلان iPhone 17: اخترق السعر مستوى المقاومة الرئیسی عند 259.47 دولارًا، متماسکًا فوق المتوسط المتحرک لمدة 50 یومًا لجلستین متتالیتین. مؤشرات مؤشر القوة النسبیة (RSI) فی منطقة ذروة الشراء قلیلاً ولکنها لا تظهر أی إشارات تصحیح فوریة. یشیر مؤشر MACD إلى المراحل المبکرة من التقاطع الصعودی. وقد زاد حجم التداول بشکل ملحوظ فی الأیام الأخیرة، مما یؤکد الاهتمام المؤسسی القوی. وفی هذا السیاق، یقع الدعم الحالی حول 246.50 دولارًا أمریکیًا، مع وجود الدعم التالی فوق 241.28 دولارًا أمریکیًا بالقرب من المتوسط المتحرک 100 یوم، بینما یقع الدعم الرئیسی السابق عند 225.95 دولارًا أمریکیًا، والذی یتزامن مع المتوسط المتحرک 200 یوم. یشیر نبض السوق الأمریکی لدى ActivTrades إلى وجود توازن محاید للمخاطر، مما یشیر إلى أن هذه التحرکات مدفوعة إلى حد کبیر بالمضاربات حول شرکة Apple. بالنسبة لشرکة أبل، تمثل هذه الأرقام أکثر من مجرد انتصار تجاری. کانت الشرکة بحاجة إلى زیادة المبیعات لتبریر موقعها فی سوق تتزاید فیه المنافسة، وتظهر المؤشرات المبکرة أنها تحقق النجاح. لا یعمل هاتف iPhone 17 على تعزیز ثقة المستثمرین فی شرکة Apple فحسب، بل یضع أیضًا معیارًا جدیدًا لصناعة التکنولوجیا فی وقت أصبح فیه الابتکار والطلب على الأجهزة المتمیزة أعلى من أی وقت مضى. ********************************************************************************************************************************************************************************************************************************************* المعلومات المیسرة لا تشکل تحلیلاً للانقلابات. لم یتم تفصیل المادة مع المتطلبات القانونیة المخصصة لتعزیز استقلالیة المعلومات المتعلقة بالتحویلات، کما یجب أیضًا اعتبارها اتصالاً تجاریًا. تم إعداد جمیع المعلومات بواسطة ActivTrades ("AT"). لا تحتوی المعلومات على سجل أسعار AT، أو عرض أو طلب معاملة على أی أداة مالیة. لا یوجد تمثیل أو ضمان إلا من حیث الدقة أو تکامل هذه المعلومات. أی مادة متناسبة لا تتعلق بهدف الانقلاب المحدد والوضع المالی لأی شخص یمکن أن یستقبله. إن معدل الإیجار الحالی وتقدیرات التسعیر لیست مجرد مؤشر أو مؤشر قابل للإصلاح فی المستقبل. احصل على خدمة التنفیذ الحصریة. ونتیجة لذلک، کل الأشخاص الذین یعملون على أساس المعلومات التی تم تسهیلها من خلال حسابهم وهدفهم. یمکن تغییر أنواع الاهتمامات. الخطر السیاسی لا یمکن التنبؤ به. یمکن أن تختلف إجراءات البنوک المرکزیة. أدوات المنصات لا تضمن النجاح.
ActivTrades
قطعی جهانی آمازون (AWS): آیا وابستگی به یک غول، جهان دیجیتال را فلج کرد؟
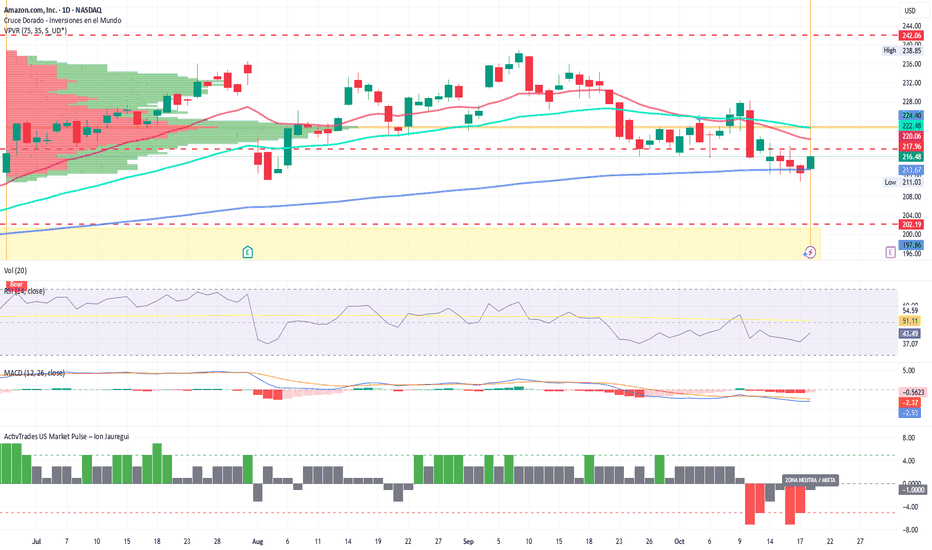
بقلم أیون جوریجوی – محلل لدى ActivTrades منذ الساعات الأولى من یوم الاثنین الموافق 20 أکتوبر 2025، عانت Amazon Web Services (AWS) - قسم الحوسبة السحابیة فی Amazon - من انقطاع عالمی أدى إلى تعطیل آلاف الشرکات والمستخدمین فی جمیع أنحاء العالم. أدى الاضطراب، الذی نشأ فی مراکز شمال فیرجینیا التابعة لشرکة AWS (U.S.) data، إلى تعطیل مواقع الویب والتطبیقات وأنظمة الدفع والمنصات الیومیة. وقد أثار هذا الفشل، الذی وصفه العدید من الخبراء بأنه أحد أخطر فشل الشرکة فی السنوات الأخیرة، سلسلة من ردود الفعل التی أدت إلى شل جزء کبیر من الاقتصاد الرقمی مؤقتًا. ومن بین المنصات المتضررة Canva وAsana وPerplexity AI وMcDonald’s وRoblox وCrunchyroll، بالإضافة إلى العدید من الخدمات المالیة وخدمات الاتصالات. وحدث أحد التأثیرات الأکثر وضوحا فی أنظمة الدفع: توقف العدید من قارئات البطاقات عن العمل، مما منع المدفوعات الإلکترونیة، فی حین توقفت أجهزة الصراف الآلی والخدمات مثل بیزوم عن العمل أیضا، مما جعل من المستحیل سحب النقود أو إرسال التحویلات الفوریة. ولعدة ساعات، اضطرت العدید من الشرکات إلى قبول النقد فقط أو إغلاق نقاط البیع الخاصة بها. أقرت AWS بالحادث من خلال صفحة الخدمة الرسمیة الخاصة بها status، مؤکدة "مشکلات تشغیل الشبکة فی منطقة شمال فیرجینیا". وعملت الفرق الفنیة بشکل عاجل لاستعادة الاتصال، وعلى الرغم من عودة الخدمات تدریجیاً إلى طبیعتها على مدار الیوم، إلا أن الحدث سلط الضوء على الاعتماد العالمی على البنیة التحتیة الرقمیة لشرکة أمازون. مع أکثر من 30% من سوق الخدمات السحابیة العالمیة، تدعم AWS جزءًا کبیرًا من عملیات الإنترنت، بدءًا من منصات البث والألعاب وحتى أنظمة الدفع والبنوک والإدارات العامة. ویؤدی انقطاعها إلى إشعال الجدل حول المرکزیة التکنولوجیة والحاجة إلى مزید من التنویع بین مقدمی الخدمات السحابیة. التحلیل الفنی – أمازون (Ticker AT: AMZN) تراجعت أسهم أمازون (NASDAQ: AMZN) بنسبة 2.3% بعد المشکلات الفنیة التی واجهتها AWS، على الرغم من أنها تمکنت من تعویض جزء من الخسائر، وأغلقت الجلسة حول 216.48 دولارًا. وعلى الرغم من الانتکاسة التی تعرضت لها سمعتها، فمن المتوقع أن یکون التأثیر المالی قصیر الأجل ولا یغیر الاتجاه الإیجابی للشرکة على المدى الطویل، مدفوعًا بالنمو المستدام فی أقسام التجارة الإلکترونیة والإعلان وخدمات الویب. منذ یوم الجمعة، 10 أکتوبر، قام السهم بتصحیح ما دون مستوى الدعم البالغ 217.96 دولارًا أمریکیًا بعد أن تجاوز المتوسط المتحرک لمدة 50 یومًا ما دون مستوى 100 یوم، مما أدى إلى تضخیم الضغط الهبوطی. مع ذلک، أظهر مؤشر یوم الاثنین move انتعاشًا فنیًا عند المتوسط المتحرک لمدة 200 یوم، مما یشیر إلى دعم محتمل على المدى القصیر. فی الوقت الحالی، یبدو أن السعر یشکل أرضیة فنیة فوق أدنى مستویاته عند 211.03 دولارًا. تقف نقطة التحکم (POC) عند 222.08 دولارًا، وهو مستوى رئیسی یجب کسره من أجل تأکید الارتداد المستدام. وفی حالة تجاوز هذا المستوى threshold، فإن الهدف التالی یقع عند 232 دولارًا أمریکیًا، یلیه 238.35 دولارًا أمریکیًا، والذی قد یؤدی اختراقه إلى موجة صعودیة جدیدة. على العکس من ذلک، فإن فقدان الدعم قد یدفع السهم إلى إعادة اختبار منطقة 202 دولارًا، مما یشیر إلى انعکاس محتمل للاتجاه. یشیر مؤشر القوة النسبیة، حوالی 43.49%، إلى ظروف تشبع طفیف فی البیع، بینما یظهر مؤشر MACD علامات حرکة جانبیة، بما یتوافق مع معنویات "تجنب المخاطرة" السائدة فی الجلسات الأخیرة، کما یعکسها مؤشر نبض السوق الأمریکی لدى ActivTrades. الغیوم فی الأفق ویترک هذا الحادث نتیجة واحدة واضحة: فی عالم رقمی بشکل متزاید، یمکن أن یتحول فشل السحابة إلى عاصفة عالمیة. تعهدت AWS بتعزیز بروتوکولاتها الأمنیة والتکراریة، لکن انقطاع الخدمة فی 20 أکتوبر سیظل بمثابة تذکیر بأنه حتى عمالقة التکنولوجیا لیسوا محصنین ضد الضعف. ********************************************************************************************************************************************************************************************************************************************* المعلومات المقدمة لا تشکل بحثًا استثماریًا. لم یتم إعداد المادة وفقًا للمتطلبات القانونیة المصممة لتعزیز استقلالیة أبحاث الاستثمار وینبغی اعتبار ذلک بمثابة اتصالات تسویقیة. تم إعداد جمیع المعلومات بواسطة ActivTrades ("AT"). ولا تحتوی المعلومات على سجل لأسعار AT، أو عرضًا أو التماسًا لمعاملة فی أی أداة مالیة. لا یتم تقدیم أی تمثیل أو ضمان فیما یتعلق بدقة أو اکتمال هذه المعلومات. لا تأخذ أی مادة مقدمة فی الاعتبار الهدف الاستثماری المحدد والوضع المالی لأی شخص قد یحصل علیها. الأداء السابق والتنبؤ لیسا مرادفین لمؤشر موثوق للأداء المستقبلی. توفر AT خدمة التنفیذ فقط. وبالتالی، فإن أی شخص یتصرف بناءً على المعلومات المقدمة یفعل ذلک على مسؤولیته الخاصة. المخاطر السیاسیة لا یمکن التنبؤ بها. یمکن أن تختلف إجراءات البنک المرکزی. أدوات النظام الأساسی لا تضمن النجاح.
ActivTrades
سقوط بیت کوین: چرا قدرت دلار بازار کریپتو را سرد کرد؟
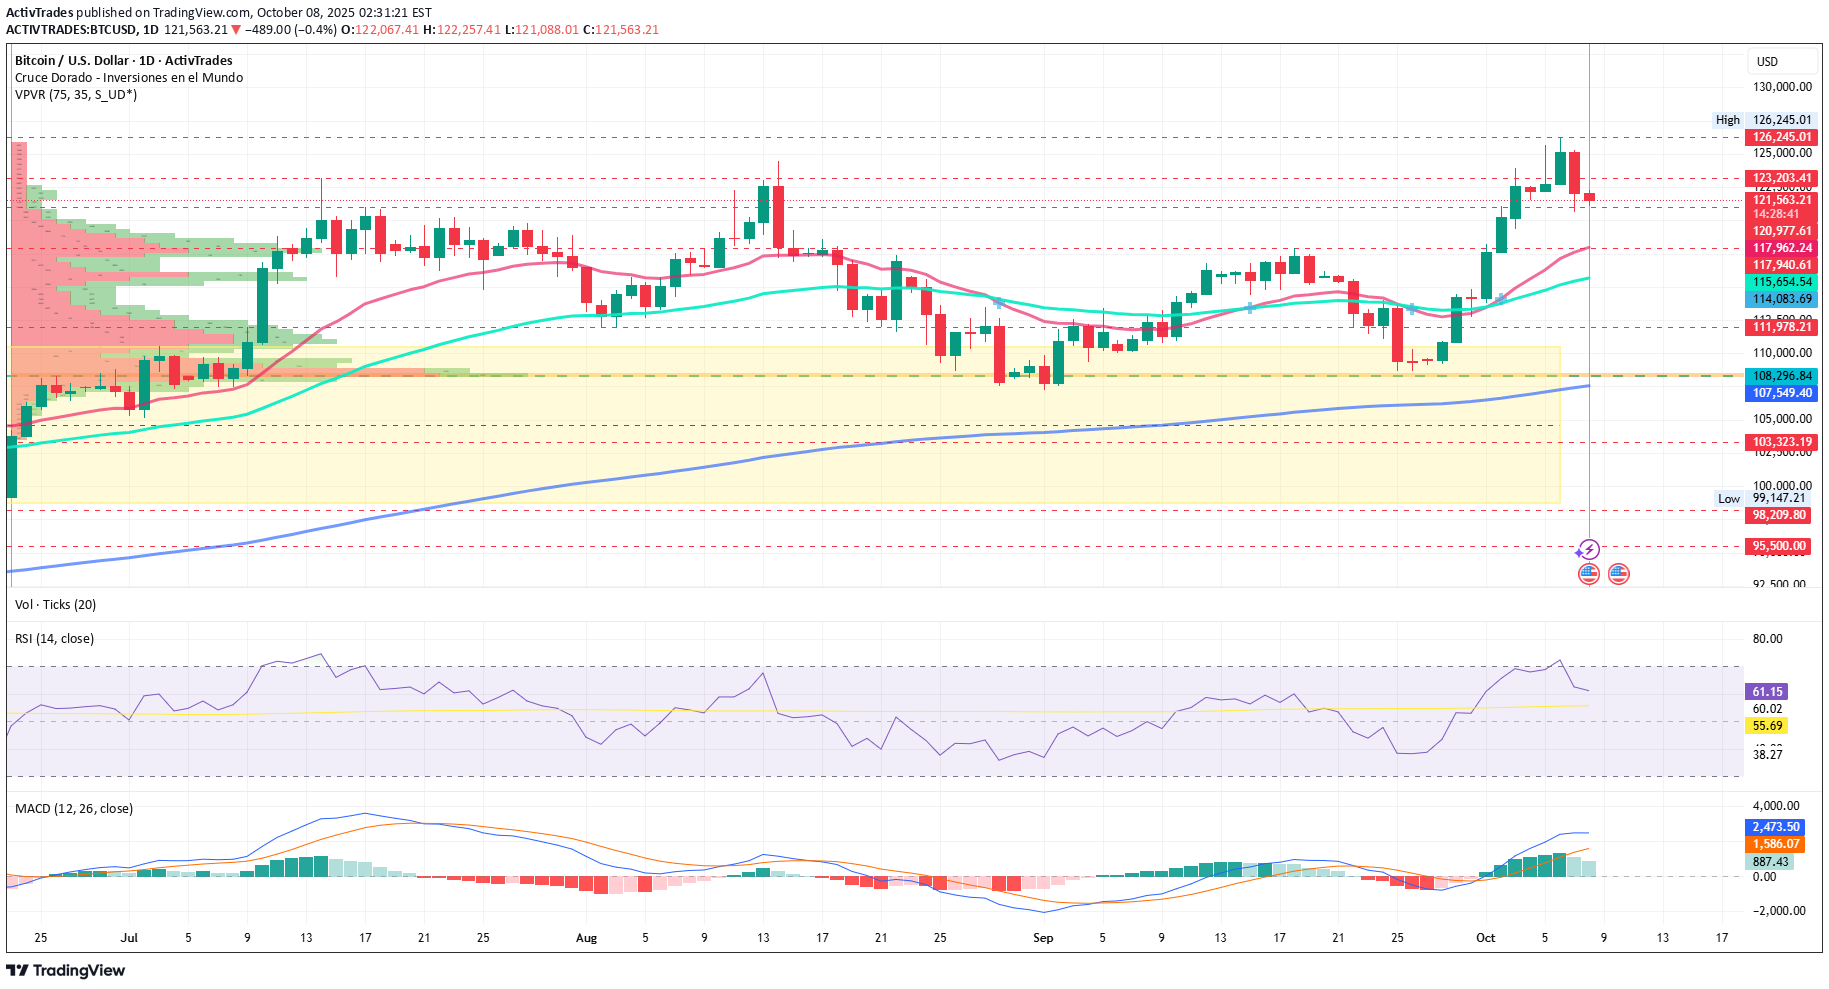
Bitcoin یتراجع بعد ارتفاعات جدیدة: الدولار القوی یخفف من ارتفاع سوق العملات المشفرة بقلم أیون جوریجوی – محلل لدى ActivTrades تراجعت Bitcoin (BTCUSD) إلى 121,000 دولار یوم الأربعاء بعد أن وصلت إلى أعلى مستوى جدید على الإطلاق عند 126,186 دولار فی وقت سابق من هذا الأسبوع. جنی الأرباح والقوة الأخیرة للولایات المتحدة.S. أدى الدولار الأمریکی مؤقتًا إلى تباطؤ الزخم الصعودی الذی سیطر على السوق فی الأسابیع الأخیرة. ومن منظور الاقتصاد الکلی، یأتی التصحیح وسط حالة من عدم الیقین المالی فی الولایات المتحدة، حیث دخل الإغلاق الحکومی أسبوعه الثانی. وقد أدى هذا الوضع إلى تعزیز الطلب على أصول الملاذ الآمن التقلیدیة مثل الولایات المتحدة. الدولار وسندات الخزانة، التی لا تزال عوائدها مرتفعة. یو.S. ارتفع مؤشر الدولار (DXY) إلى أعلى مستوى له فی ثلاثة أسابیع، مما قلل من جاذبیة العملات المشفرة مقارنة بسیولة الدولار. کان ارتفاع البیتکوین الأخیر مدفوعًا بالتدفقات المستمرة إلى صنادیق الاستثمار المتداولة Bitcoin، وتوسیع المشارکة المؤسسیة فی الأصول، ومن خلال مراکز المضاربة المرتبطة بما یسمى "تداولات تخفیض قیمة العملة"، حیث یراهن المستثمرون على انخفاض قیمة العملات الورقیة مقابل الأصول النادرة. ومع ذلک، فإن انتعاش الدولار والحذر قبل محضر اجتماع مجلس الاحتیاطی الفیدرالی قد أدى إلى تهدئة ذلک مؤقتًا optimism. تحلیل سعر البیتکوین دولار: على الصعید الفنی، یواجه Bitcoin مقاومة قویة بالقرب من أعلى مستویاته عند 126,245 دولارًا أمریکیًا، وهی منطقة تظهر نمطًا منهکًا واضحًا مصحوبًا بانخفاض حجم التداول. یقع الدعم الفوری عند 121,000 دولار أمریکی، یلیه 117,997 دولارًا أمریکیًا، ومنطقة نقطة التحکم الرئیسیة (POC) حول 108,296 دولارًا أمریکیًا، حیث بدأت الموجة الصعودیة الأخیرة. انخفض مؤشر القوة النسبیة الیومی من مستویات التشبع الشرائی إلى 61.63%، مما یشیر إلى مرحلة ترسیخ صحیة ضمن هیکل لا یزال صعودیًا على المدى المتوسط. یستمر مؤشر MACD فی الإشارة إلى الزخم الصعودی، ویبدو أن تقاطع المتوسط المتحرک الذی بدأ فی 2 أکتوبر یتوسع، مع السعر الحالی أعلى بکثیر من متوسط 50 یومًا، والذی یتماشى مع منطقة الدعم البالغة 117,970 دولارًا. قد یؤدی الاختراق دون هذه المستویات إلى فتح الباب أمام الانخفاضات نحو 117800 دولار - 115000 دولار، فی حین أن الارتفاع المستمر move فوق 123500 دولار قد یؤدی إلى محاولات اختراق جدیدة نحو 128000 دولار - 130000 دولار. النظام البیئی للعملات المشفرة یتبع التراجع فی جمیع أنحاء القطاع، عکست الأسهم المرتبطة بالعملات المشفرة التراجع: انخفضت MicroStrategy (MSTR) بنسبة 8.7٪، وانخفضت Coinbase (COIN) بنسبة 2.7٪، وانخفضت Riot Platforms (RIOT) بنسبة 0.4٪، وخسرت Marathon Digital (MARA) 1.5٪. ومن بین العملات البدیلة major، انخفضت Ethereum بنسبة 4.6%، وSolana 4.5%، وCardano 5%، مما یعکس معنویات أوسع نطاقًا للعزوف عن المخاطرة عبر الأسواق الرقمیة. باختصار، یمر Bitcoin بتصحیح فنی ضمن بیئة اقتصادیة کلیة متقلبة، حیث من المرجح أن یحدد أداء الدولار وتوجیهات بنک الاحتیاطی الفیدرالی اتجاه major move التالی. ********************************************************************************************************************************************************************************************************************************************* المعلومات المقدمة لا تشکل بحثًا استثماریًا. لم یتم إعداد المادة وفقًا للمتطلبات القانونیة المصممة لتعزیز استقلالیة أبحاث الاستثمار وینبغی اعتبار ذلک بمثابة اتصالات تسویقیة. تم إعداد جمیع المعلومات بواسطة ActivTrades ("AT"). ولا تحتوی المعلومات على سجل لأسعار AT، أو عرضًا أو التماسًا لمعاملة فی أی أداة مالیة. لا یتم تقدیم أی تمثیل أو ضمان فیما یتعلق بدقة أو اکتمال هذه المعلومات. لا تأخذ أی مادة مقدمة فی الاعتبار الهدف الاستثماری المحدد والوضع المالی لأی شخص قد یحصل علیها. الأداء السابق والتنبؤ لیسا مرادفین لمؤشر موثوق للأداء المستقبلی. توفر AT خدمة التنفیذ فقط. وبالتالی، فإن أی شخص یتصرف بناءً على المعلومات المقدمة یفعل ذلک على مسؤولیته الخاصة. المخاطر السیاسیة لا یمکن التنبؤ بها. یمکن أن تختلف إجراءات البنک المرکزی. أدوات النظام الأساسی لا تضمن النجاح.
ActivTrades
طلا به نزدیکی اوج تاریخی؛ سایه تعطیلی دولت آمریکا و کاهش نرخ بهره فدرال رزرو
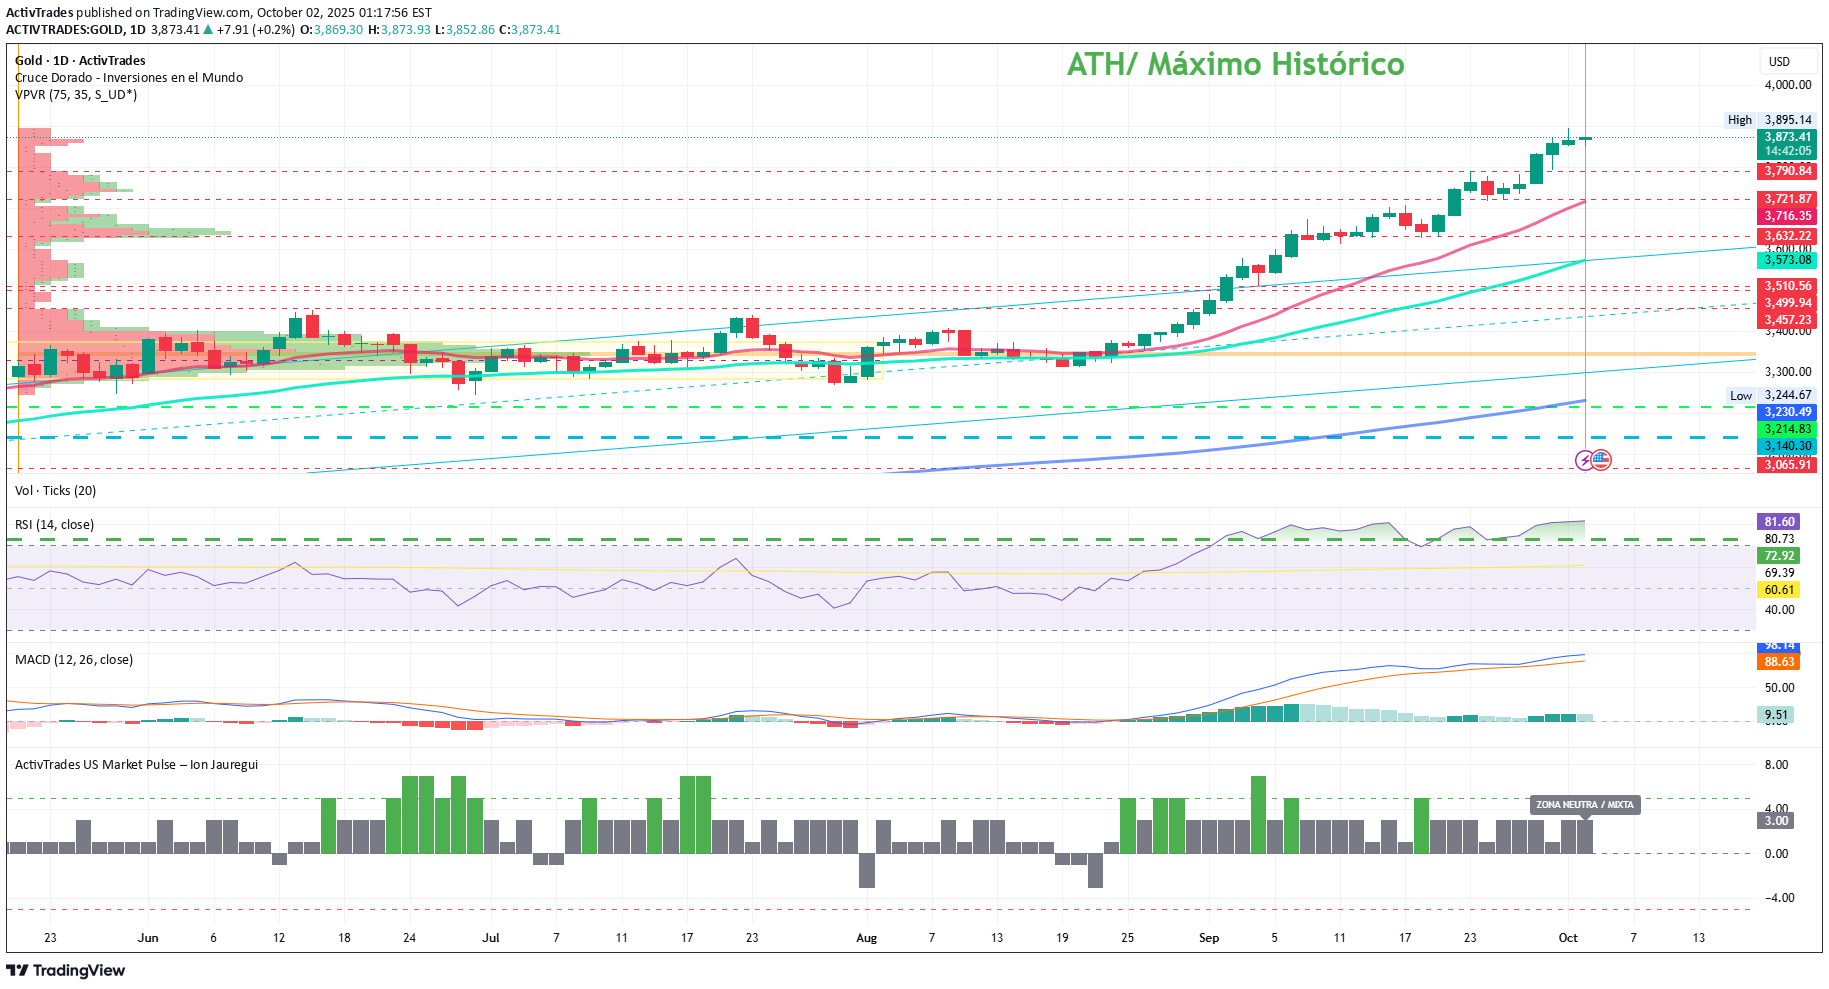
ion jauregui - محلل فی ActivTrades یبقى الذهب على مقربة من أعلى مستویات قیاسیة ، بدعم من ارتفاع کره المخاطر فی الأسواق بعد U. S. الإغلاق الحکومی والتوقعات القویة بأن الاحتیاطی الفیدرالی سوف ینفذ المزید من التخفیضات فی أسعار الفائدة فی أکتوبر. یتم تداول The Precious metal عند 3،864.63 دولارًا للأونصة ، بعد أن بلغ ارتفاعًا قیاسیًا قدره 3،895.33 دولار فی الجلسة السابقة ، فی حین أن العقود الآجلة فی دیسمبر 3889.65 دولار ، بانخفاض 0.2 ٪. أدى الافتقار إلى الإجماع فی الکونغرس إلى توقف فی معظم العملیات الفیدرالیة وتأجیل إطلاق بیانات العمالة الرئیسیة ، مثل کشوف المرتبات غیر الزراعیة. هذه الفجوة فی المعلومات تغذی عدم الیقین وتعزز جاذبیة الذهب کأصل آمن. علاوة على ذلک ، أظهر سوق العمل الخاص الأخیر data اتجاهًا تبریدًا ، مما یعزز الرهانات التی سیخفض بنک الاحتیاطی الفیدرالی الأسعار بمقدار 25 نقطة أساس هذا الشهر. تضع CME FedWatch احتمال هذا move بنسبة 97 ٪. ومع ذلک ، لا یزال التضخم مصدرا للضغط. یستمر مؤشر أسعار PCE ، وهو مقیاس التضخم المفضل لدى بنک الاحتیاطی الفیدرالی ، فی البقاء أعلى من هدف 2 ٪ ، مما قد یحد من حجم تخفیضات الأسعار المستقبلیة. التحلیل الفنی الذهبی (Ticker AT: Gold) من منظور تقنی ، یحتفظ Gold بمدى صاعد واضح ، حیث تم دمجه فوق نطاق 3،632 دولارًا - 3،790 دولارًا ، بعد أن حصل على مستوى قیاسی قدره 3،895.14 دولار فی جلسة الأمس. یکمن دعم أحدث move فی التصاعدی عند 3،721.87 دولار ، حیث یمر المتوسط الذی یبلغ 50 نقطة على الرسم البیانی الیومی. على الجانب العلوی ، تبقى المقاومة الرئیسیة على المستوى النفسی البالغ 3900 دولار. یمکن أن یفتح الإغلاق الیومی فوق هذا المستوى الباب إلى 3950 دولارًا ، فی حین أن تجاوز 4000 دولار من شأنه أن یمثل علامة فارقة تاریخیة ، مما قد یجذب فائدة شراء جدیدة. تشیر عملیات الانتقال المتوسطة المتحرکة إلى تحیز صعودی واضح. یُظهر مؤشرات القوة النسبیة حالیًا ظروفًا قویة فی ذروة الشراء عند 81.42 ٪. یشیر MACD إلى وجود تحیز صعودی مع کلا المتوسطین فوق الرسم البیانی الأخضر ، على الرغم من أنه بدون زیادة واضحة فی حجم التداول. بالإضافة إلى ذلک ، یُظهر نبض السوق ActivTrades US تحولًا ملحوظًا نحو تحیز محاید فی اتجاه المخاطر ، مما یعنی انخفاض الطلب على المدى الآمن ودولار أقوى بالنسبة للعوائد ، مع وجود major مؤشرات فی مستمرات مستمرة. قد یؤدی ذلک إلى قیادة المستثمرین إلى تدویر المواقف من المعادن الثمینة إلى المعادن الصناعیة مثل النحاس أو البلاتین ، والتی تمیل إلى الاستفادة من نشاط اقتصادی أقوى. یبقى التحیز الصعودی طالما یبقى السعر فوق 3،780 دولار ، حیث یفضل المستثمرون التراکم على الانخفاضات وسط U. S. عدم الیقین السیاسی ، والدولار الأضعف ، وتوقعات انخفاض معدلات. إذا فشل هذا الاتجاه التصاعدی فی الاحتفاظ به ، فیمکننا رؤیة اختبار لمستویات الدعم المحددة. U. S. الإغلاق - نظرة السوق لا یعکس الذهب الیوم التوتر من U. S. إغلاق الحکومة ولکن أیضا الانتقال إلى دورة نقدیة أکثر مرونة. یتعایش الطلب الآمن للتوقعات مع توقعات انخفاض معدلات ، وهو مزیج یعزز metal الثمین. ومع ذلک ، إذا تحول السوق العالمی نحو سیناریو على المخاطر ، فیمکن أن یدور رأس المال إلى أصول عالیة العائد ، مما یقلل مؤقتًا من الطلب على الذهب. بالنسبة للمستثمرین ، فإن الوجبات الجاهزة واضحة: یظل الذهب عمودًا استراتیجیًا فی المحافظ المتنوعة ، لکن أدائها المستقبلی سیعتمد على ما إذا کان الخوف أو شهیة المخاطر یسود فی الأسواق. ***************************************************************************************** المعلومات المقدمة لا تشکل أبحاث الاستثمار. لم یتم تحضیر المواد وفقًا للمتطلبات القانونیة المصممة لتعزیز استقلال أبحاث الاستثمار ویجب اعتبار هذه الاتصالات التسویقیة. تم إعداد جمیع المعلومات بواسطة ActivTrades ("AT"). لا تحتوی المعلومات على سجل لأسعار AT ، أو عرض أو التماس لمعاملة فی أی أداة مالیة. لا یتم تقدیم أی تمثیل أو ضمان فیما یتعلق بدقة أو اکتمال هذه المعلومات. أی مواد مقدمة لا تنظر إلى هدف الاستثمار المحدد والوضع المالی لأی شخص قد یتلقىها. الأداء السابق والتنبؤ لیسوا مرادفًا لمؤشر موثوق للأداء فی المستقبل. فی توفیر خدمة التنفیذ فقط. وبالتالی ، فإن أی شخص یتصرف على المعلومات المقدمة یفعل ذلک على مسؤولیته الخاصة. المخاطر السیاسیة لا یمکن التنبؤ بها. یمکن أن تختلف إجراءات البنک المرکزی. أدوات المنصة لا تضمن النجاح.
ActivTrades
Ethereum Bets on Privacy in Its New Roadmap
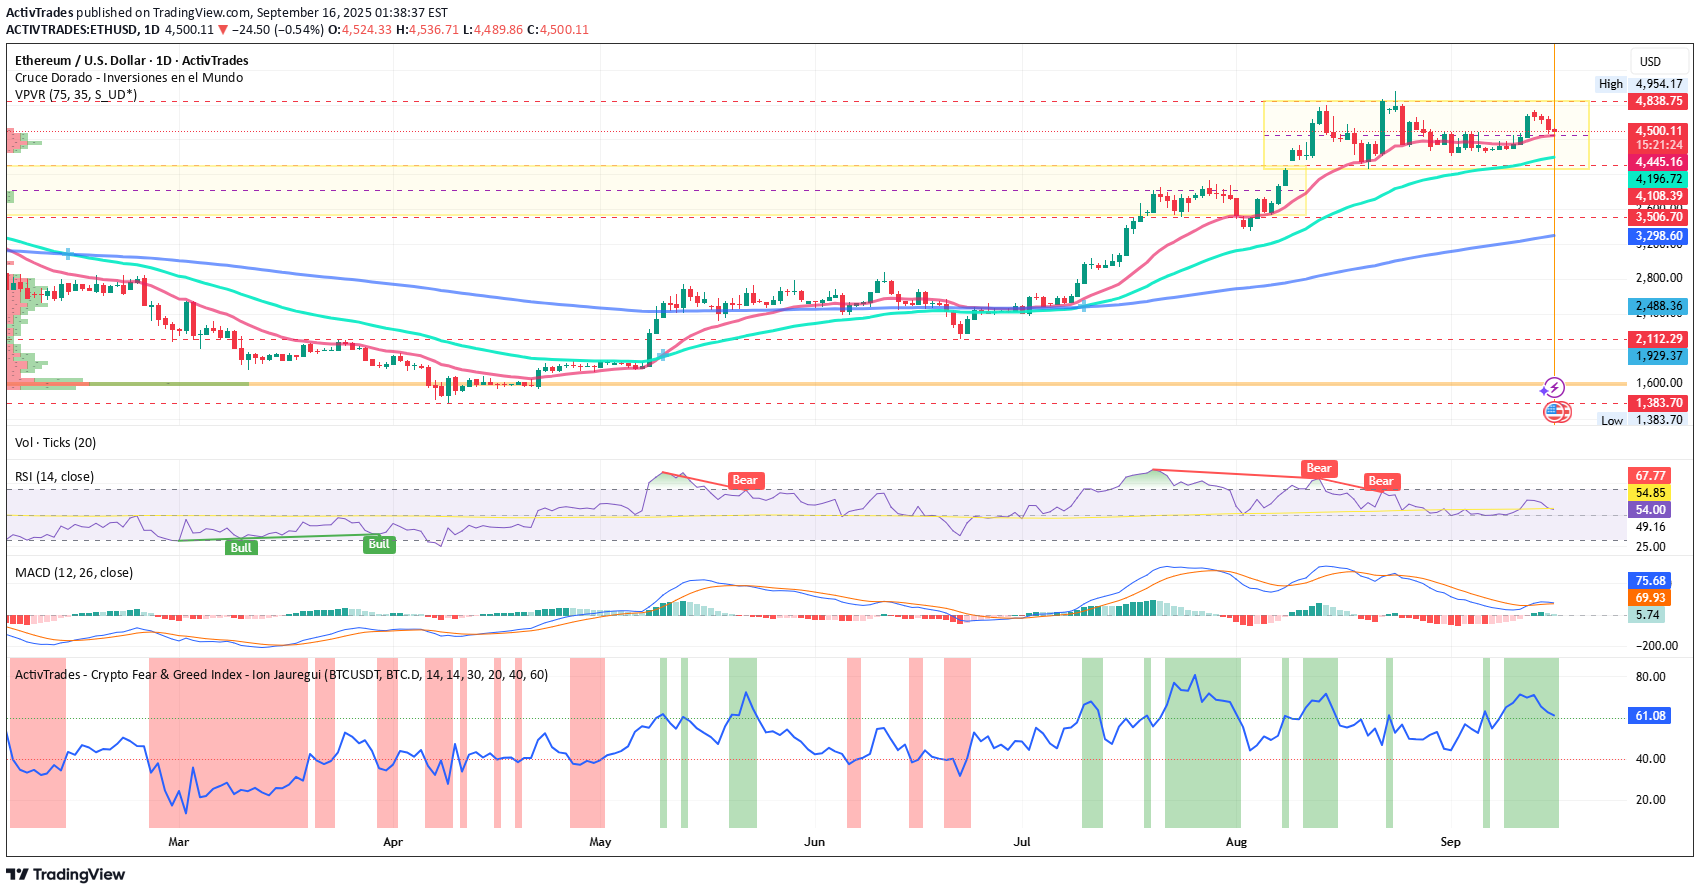
ion jauregui - محلل فی ActivTrades اتخذ Ethereum خطوة مهمة فی تطورها: الخصوصیة. قامت مؤسسة Ethereum بإعادة إطلاق فریقها تحت اسم خصوصیة الحکام من Ethereum (PSE) وقدمت خریطة طریق تهدف إلى دمج أدوات السریة فی النظام البیئی. لخص سام ریتشاردز ، أحد أرقام المشروع الرئیسیة ، بصراحة: "بدون الخصوصیة ، Ethereum (ETH) لیست الحریة ، إنها مراقبة عالمیة". بیان یؤکد على أهمیة هذه المبادرة. تم تنظیم الاستراتیجیة حول ثلاثة أعمدة: تکتب الخاصة: ضمان تکلفة العملیات الخاصة مثلها مثل العملیات العامة. القراءات الخاصة: تمکین القراءات دون ترک أثر على الشبکة. إثبات خاص: تقدیم البراهین أسرع وأکثر بأسعار معقولة. من بین التطورات البارزة هو البلازما ، وهو حل Layer 2 یرکز على التحویلات الخاصة ، مع توقع نموذج أولی فی نوفمبر فی DevConnect فی الأرجنتین. بالإضافة إلى ذلک ، یقوم الفریق بإعداد تقریر عن التصویت الخاص فی عام 2025 ویعمل على تطبیقات Defi السریة التی تستهدف العملاء المؤسسیین. التحلیل الفنی للأخلاق دخل زوج ethusd مرحلة توحید بعد التحرکات الصعودیة الأخیرة. یتم تداولها حالیًا بالقرب من أعلى مستویاتها الأخیرة عند 4،530.60 دولار ، وتتحرک ضمن قناة جانبیة محددة بدعم رئیسی عند 4447.96 دولار ومقاومة عند ارتفاع 4،954.17 دولار ، وهو مستوى تم اختباره مسبقًا فی عام 2021. یزید السعر الحالی عن المتوسط المتحرک لمدة 50 یومًا ، مع محاذاة مستوى الدعم الأول مع المتوسط المتحرک لمدة 100 یوم. یمکن العثور على دعم ثالث فی المتوسط المتحرک لمدة 200 یوم بالقرب من 3،506.70 دولار. تقع النقطة الحالیة للتحکم (POC) أقل بکثیر ، فی أصل الدافع الصعودی السابق حوالی 1600 دولار. تبلغ RSI 55.39 ، مما یضعها فی منطقة محایدة بعد سلسلة من التحرکات الهبودیة فی منتصف أغسطس. وفی الوقت نفسه ، یبقى MACD فی بنیة جانبیة ، مع رسم بیانی إیجابی بعض الشیء - دعم فکرة ترکیز الأسعار. وفقًا لمؤشر ActivTrads Crypto Fear & Greed ، یبلغ عدد المشاعر 61.65 (Greed) ، مما یعکس optimism فی السوق وهیمنة Altcoin المستمرة. قد یؤدی الانهیار فوق المقاومة الفوریة إلى مستویات مستویات جدیدة نحو 5100 دولار. ومع ذلک ، قد یؤدی الفشل فی الاحتفاظ بهذا الاختراق إلى فقدان المتوسط المتحرک لمدة 50 یومًا ، وإعادة اختبار الدعم المنخفض ، وربما انخفاضًا فی منطقة 2800 دولار. فی الختام ، طالما أن ethusd یحتفظ بالدعم الحالی ، یظل التحیز التقنی إیجابیًا. ومع ذلک ، فإن کسر أعلى المستویات الأخیرة سیکون أمرًا بالغ الأهمیة لتأکید الساق الصعودیة الجدیدة. من خلال هذا النهج ، یعزز Ethereum موقعه لیس فقط کشبکة عقود ذکیة ولکن أیضًا کنظام بیئی یسعى إلى موازنة الشفافیة والخصوصیة - عناصر رئیسیة للتبنی الجماعی. ***************************************************************************************** المعلومات المقدمة لا تشکل أبحاث الاستثمار. لم یتم تحضیر المواد وفقًا للمتطلبات القانونیة المصممة لتعزیز استقلال أبحاث الاستثمار ویجب اعتبار هذه الاتصالات التسویقیة. تم إعداد جمیع المعلومات بواسطة ActivTrades ("AT"). لا تحتوی المعلومات على سجل لأسعار AT ، أو عرض أو التماس لمعاملة فی أی أداة مالیة. لا یتم تقدیم أی تمثیل أو ضمان فیما یتعلق بدقة أو اکتمال هذه المعلومات. أی مواد مقدمة لا تنظر إلى هدف الاستثمار المحدد والوضع المالی لأی شخص قد یتلقىها. الأداء السابق والتنبؤ لیسوا مرادفًا لمؤشر موثوق للأداء فی المستقبل. فی توفیر خدمة التنفیذ فقط. وبالتالی ، فإن أی شخص یتصرف على المعلومات المقدمة یفعل ذلک على مسؤولیته الخاصة. المخاطر السیاسیة لا یمکن التنبؤ بها. یمکن أن تختلف إجراءات البنک المرکزی. أدوات المنصة لا تضمن النجاح.
ActivTrades
AI GAIN Act: A Shot in the Foot for the Chip Industry?
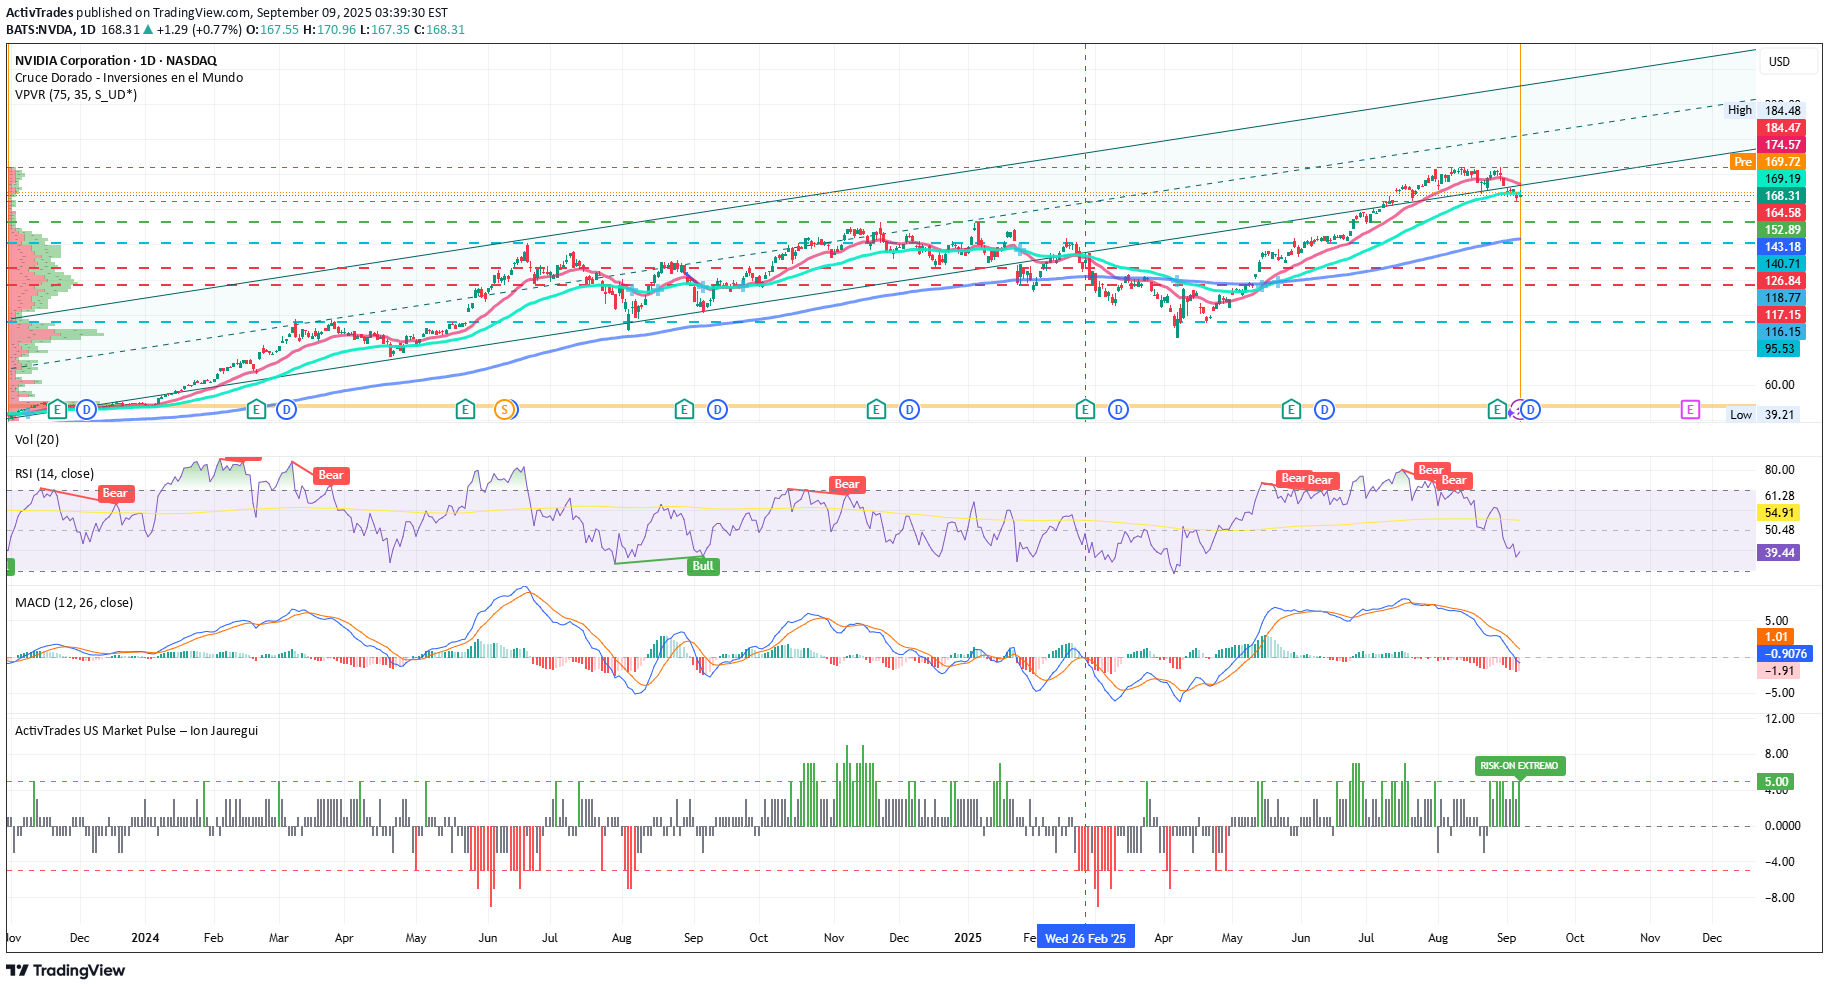
By Ion Jauregui – Analyst at ActivTrades The debate over Western leadership in artificial intelligence once again centers on Washington. The new AI GAIN Act, integrated as part of the National Defense Authorization Act (NDAA), establishes that any chip with performance above 4,800 TOPS will require an export license. The measure also stipulates that semiconductor manufacturers must prioritize deliveries to U.S. companies before exporting advanced chips abroad. Framed as a strategy to reinforce national security and curb China, the legislation has sparked alarm across the industry. In short: if U.S. companies are waiting for chips, China and other countries move to the back of the line. Nvidia raises the alarm Nvidia (NASDAQ: NVDA.O), the undisputed leader in GPUs for AI, has warned that the law would stifle global competitiveness and slow innovation in artificial intelligence. According to the company, there is currently no domestic supply shortage that justifies restricting access for foreign clients. The criticism recalls the controversial AI Diffusion Rule, pushed by the Biden administration in early 2025 and eventually revoked before coming into force. At the time, restrictions also aimed to control the export of chips and AI models but were discarded for being excessively rigid. Impact on the semiconductor sector The reach of the AI GAIN Act goes beyond Nvidia: •AMD, with its growing exposure to AI accelerators, faces similar risks in its international operations. •Intel, with a stronger domestic presence, may be less affected, as its profile aligns with the strategic goal of boosting local production. •Broadcom and Qualcomm, highly dependent on global client networks, would face tighter constraints on commercial flexibility. The most likely outcome is a double-edged sword: ensuring the U.S. always has priority in the supply chain, but at the cost of undermining the global business model that sustains sector margins. In short: the risk is that the cure ends up being worse than the disease, slowing global competition. Technical analysis of Nvidia Nvidia’s stock remains close to record highs after holding above USD 164 yesterday and closing at USD 168.31. Price action shows the loss of the 50-day moving average and movement toward the 100-day. A clear trend reversal has not yet materialized, even though the RSI is in oversold territory at 39.44, while the MACD is shifting into negative territory, crossing into the lower part of the histogram. Another relevant factor is a price bell that has moved strongly between USD 152.89 and USD 126.84, with its Point of Control (POC) around USD 138.17, slightly below the accumulation zone that fueled the rally to all-time highs. The ActivTrades US Market Pulse currently signals Extreme Risk-On conditions in U.S. markets, highlighting a phase of exuberance on Wall Street where macro or geopolitical risks seem ignored. This new law could act as a catalyst for sector pullbacks. If the current support at USD 164.58 and the next level at USD 152.89 fail, a return to the POC would be likely. On the other hand, if prices hold and consolidate, a new rally toward highs is possible. Such regulatory moves can trigger trend shifts, but if the market absorbs them, upside momentum could resume. From a wave structure perspective, bullish waves remain intact, suggesting this may be only a temporary pause. •Resistances: All-time high at USD 184.48 •Supports: 164.58, 152.89, and POC at 138.17 •Indicators: RSI at 39.44, signaling oversold and potential consolidation •MACD: Negative territory •Moving averages (50/100/200): No trend change yet, though the 50-day is approaching the 100-day •ActivTrades US Market Pulse: Extreme Risk-On Conclusion: Trump vs. AI The Trump administration’s protectionist measures aim to secure national access to silicon and reduce dependence on foreign suppliers, in order to safeguard U.S. leadership in AI. However, Nvidia’s warnings—echoed by the broader sector—underscore fears that overregulation could erode the international competitiveness of American tech giants, especially against China and other emerging innovation hubs. In this race for AI dominance, building walls may end up slowing down your own runners. ******************************************************************************************* The information provided does not constitute investment research. The material has not been prepared in accordance with the legal requirements designed to promote the independence of investment research and such should be considered a marketing communication. All information has been prepared by ActivTrades ("AT"). The information does not contain a record of AT's prices, or an offer of or solicitation for a transaction in any financial instrument. No representation or warranty is given as to the accuracy or completeness of this information. Any material provided does not have regard to the specific investment objective and financial situation of any person who may receive it. Past performance and forecasting are not a synonym of a reliable indicator of future performance. AT provides an execution-only service. Consequently, any person acting on the information provided does so at their own risk. Political risk is unpredictable. Central bank actions can vary. Platform tools do not guarantee success.
ActivTrades
BMW Puts on the Techie Suit to Challenge Elon
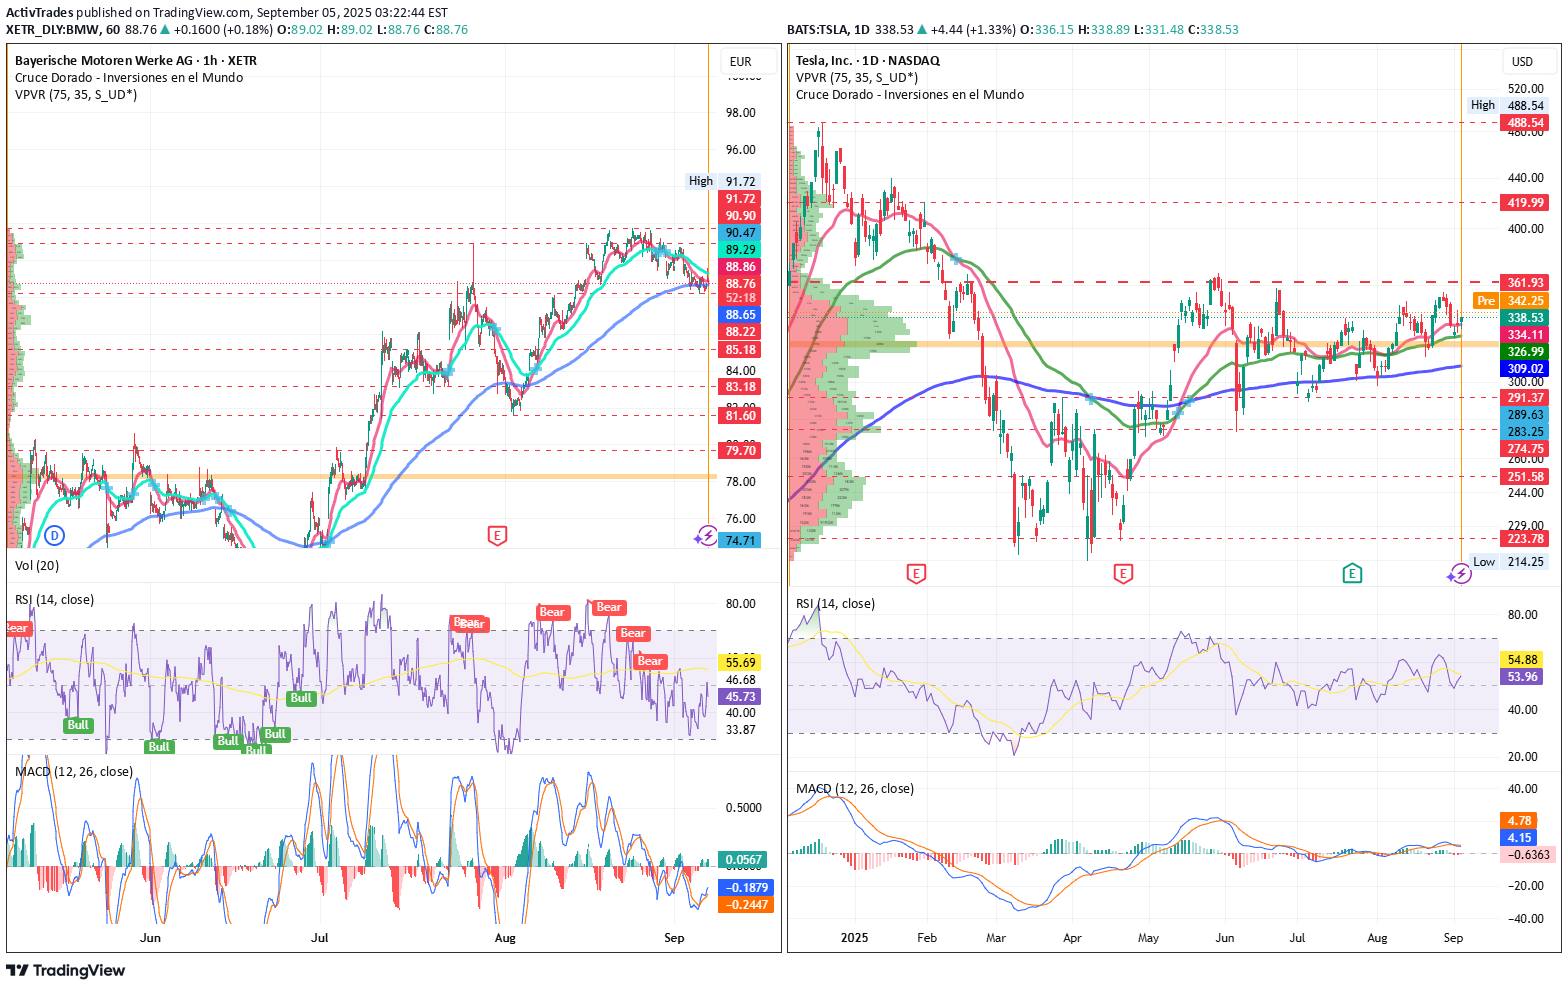
🚘️ BMW Puts on the Techie Suit to Challenge Elon By Ion Jauregui – Analyst at ActivTrades BMW (Ticker AT:BMW) has fired up its engines in the technology race against Tesla. The Bavarian brand is launching the Neue Klasse, a platform that promises to revolutionize the electric car and will debut with the new iX3, unveiled ahead of the Munich Motor Show. This is not just another electric SUV: the company has invested more than €10 billion to turn the car into a “superbrain on wheels.” Four central chips manage everything from infotainment to autonomous driving, with 20 times more computing power than current systems. Added to this are headline-grabbing features: 800 kilometers of range and 350 km of charge in just 10 minutes. BMW, however, does not manufacture its own batteries. Instead, it relies on Chinese giant CATL (SSE:300750), with whom it has developed new cylindrical cells that halve costs and increase energy density. Six gigafactories spread across China, Europe, and North America will guarantee supply. Shift to E-Mobility The shift toward electrification does not come without sacrifices. In 2024, the group saw its net profit fall 37%, to €7.68 billion, due to heavy spending on R&D. However, pure EV sales grew 13.5%, supporting the transition. BMW benefits from structural reductions in battery production costs, a diversified portfolio supported by solid alliances that integrate electric, hybrid, and combustion models under the same digital platform, and a premium positioning that continues to attract loyal customers. The risk lies in massive spending eroding margins at a time when Tesla (Ticker AT:TSLA) and Chinese manufacturers like Xpeng (NYSE:XPEV) are advancing aggressively. Technical Analysis BMW shares on the Frankfurt Stock Exchange show a consolidation trend after a volatile 2024 marked by profit cuts. The current key support at €88.18 seems to be holding, while resistance lies between €88.85 and the unbroken highs of €91.72. This resistance has repeatedly pushed the stock back to support levels after each upward attempt. Breaking through current highs would open a path toward €110, and possibly new yearly highs, while a drop below support could shake investor confidence and push the stock toward the Point of Control (POC) around €86.60. The 50, 100, and 200-day moving averages have contracted sharply over the past month, which could indicate declining confidence if confirmed. On the other hand, the RSI at 42.05% signals oversold conditions, while the MACD is negative but with a histogram turning positive—another possible signal of recovery. Lastly, the ActivTrades Europe Market Pulse indicator shows a contraction back to neutral territory, suggesting investors may be returning to support the market. BMW (Ticker AT:BMW) Trend: Bullish in the medium and long term, with potential lateralization or short-term reversal. Resistance: Strong zone at the highs of €91.72. Supports: Key levels between €88 and €88.50, with critical supports at €88.22, €88.18, POC €86.60, €85.18, €83.18, €81.60, and €79.70. Point of Control (POC): €86.60. Technical Conclusion: Recent sideways consolidation, with upside potential if the €91.50–91.72 zone is broken. Tesla Following political frictions between Elon Musk and Trump, Tesla’s stock has been recovering, moving sideways between May and August, with a slightly upward bias within the range of $361.93 to $291.37. A mid-range area has formed around the POC of $311.43, acting as support for the latest rally. The RSI stands at 53.96%, a relatively neutral level, while the MACD remains neutral with a histogram gradually entering negative territory, pointing to a strong consolidation move. Meanwhile, the ActivTrades US Market Pulse indicates the American market is in extreme RISK-ON, suggesting potential adjustments due to excessive greed. Tesla (Ticker AT:TSLA) Current Trend: Short-term bullish recovery after weeks of lateral consolidation, with positive signs from regaining key moving averages. Resistances: Strong resistance around $361.93, which could open the way toward $420, the next major level lost in February’s death cross. Supports: Key support at the POC of $311.43, followed by $291.37, $274.75, and $225.58. Technical Conclusion: Tesla is at a decisive range. A break above recent highs could trigger an upward move toward $420 or beyond. Conversely, a drop below $320 would increase bearish pressure, potentially driving the stock down to test $291. Conclusion The Neue Klasse is not just a product launch—it is BMW’s boldest and riskiest bet in decades. The German manufacturer wants to stop being solely a premium icon and transform into a fully-fledged tech player. Elon Musk no longer runs alone: the racetrack is filling up with rivals hungry for disruption. ******************************************************************************************* The information provided does not constitute investment research. The material has not been prepared in accordance with the legal requirements designed to promote the independence of investment research and such should be considered a marketing communication. All information has been prepared by ActivTrades ("AT"). The information does not contain a record of AT's prices, or an offer of or solicitation for a transaction in any financial instrument. No representation or warranty is given as to the accuracy or completeness of this information. Any material provided does not have regard to the specific investment objective and financial situation of any person who may receive it. Past performance and forecasting are not a synonym of a reliable indicator of future performance. AT provides an execution-only service. Consequently, any person acting on the information provided does so at their own risk. Political risk is unpredictable. Central bank actions can vary. Platform tools do not guarantee success.
ActivTrades
Gold and Its Hidden Catalyst: Is a New Bull Cycle on the Horizon
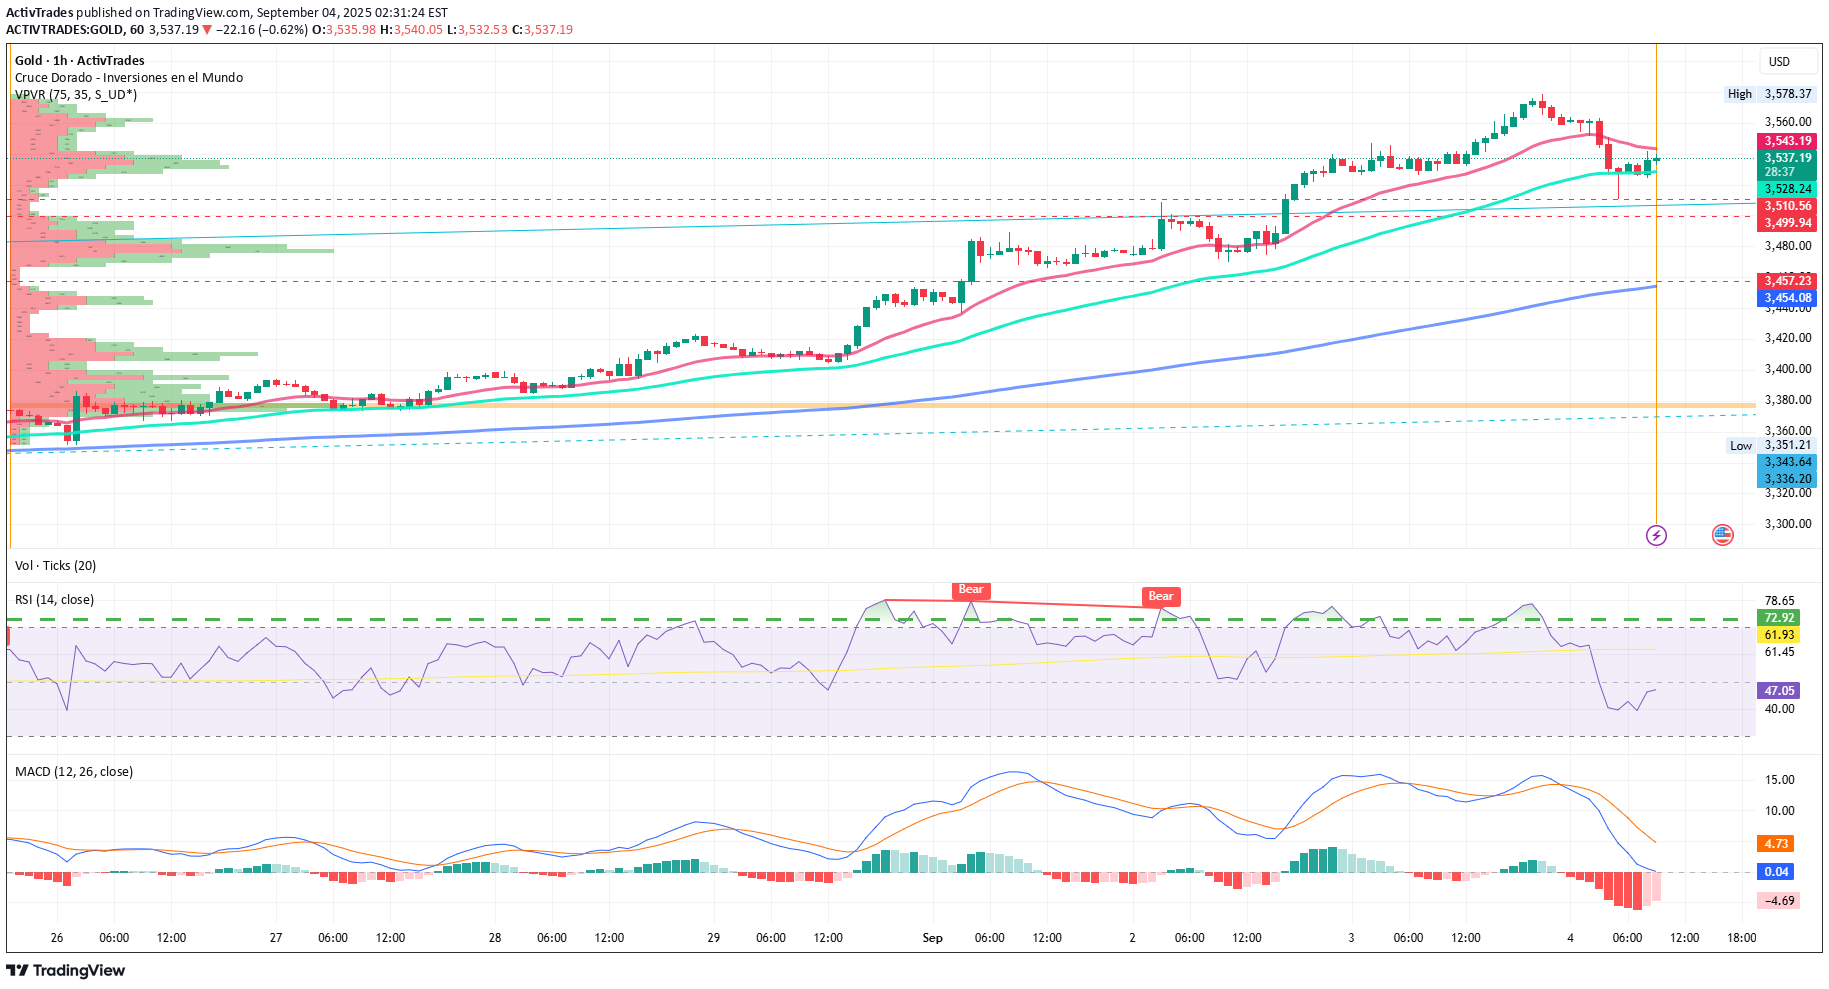
By Ion Jauregui – Analyst at ActivTrades Gold (Ticker AT: GOLD) is once again at the center of financial debate. After years of solid gains and an undisputed role as a safe haven, a little-explored factor could trigger an unprecedented bull cycle: the potential revaluation of the United States’ official gold reserves. The Hidden Catalyst The United States holds 261.5 million troy ounces in official reserves, valued on the books at only $42.22 per ounce, or roughly $11 billion in total. However, the current gold price hovers around $3,500 per ounce, revealing a vast gap between accounting value and market reality. Some lawmakers, including Senator Cynthia Lummis, have proposed updating these reserves to market prices. The impact would be colossal: such an adjustment would represent about 3% of U.S. GDP, potentially used to reduce the deficit, lower public debt, or create a strategic fund tied to new reserves in bitcoin. Global Implications A revaluation of this magnitude would not only reinforce gold’s monetary role but also free resources to alleviate deficit pressures and debt interest obligations. At the same time, it could have an inflationary side effect, acting as an indirect monetary injection that weakens the dollar against gold and other currencies. If realized, this move could influence other central banks, creating a chain reaction with greater revaluation of global reserves and increased demand for gold as a strategic asset. Central banks’ interest already supports this thesis: in 2024, net purchases exceeded 1,000 tonnes of gold for the third consecutive year, and in 2025 buying momentum remains high. This trend validates gold’s role as a strategic monetary asset and increases pressure to adjust its official valuation. Investor Perspective A potential official revaluation of U.S. reserves could become one of the largest bullish catalysts in decades, solidifying gold as a hedge against U.S. fiscal risk, the erosion of the dollar as a global reserve currency, and geopolitical tensions. For investors, maintaining strategic exposure to the precious metal appears more relevant than ever. This can be achieved through physical gold, gold-backed ETFs, gold mining stocks, or hybrid instruments such as gold loans with additional yield. The Gold Zapatero Sold at a Loss During José Luis Rodríguez Zapatero’s government, the Bank of Spain carried out one of the largest reductions in gold reserves in recent history. Between 2005 and 2007, it sold around 242 tonnes, nearly half of the national stock, which fell from 523 tonnes to just 282 tonnes. In 2007 alone, more than 130 tonnes were sold under European central bank agreements aimed at diversifying assets and investing in sovereign debt. Since then, Spain’s gold position has remained virtually unchanged at around 281 tonnes, with no significant purchases, unlike other central banks that have increased their reserves in recent years. At today’s price of $3,500 per ounce, Spain’s current gold reserves (281 t) would be worth approximately $31.6 billion. In contrast, the 242 tonnes sold under Zapatero fetched only ~$3.5 billion, meaning those reserves would now be worth ~$27.2 billion, more than seven times the sale price at the time. Technical Analysis of Gold (Ticker AT: GOLD) Gold cash is currently trading slightly above $3,500 per ounce, consolidating after the strong bullish surge in August. The technical structure shows a market still dominated by buyers, although signs of overextension and sideways movement are emerging. The price has lost the 50-day moving average support and currently rests weakly above the 100-day average. Key Levels Immediate Resistance: $3,578.37 – a psychological zone coinciding with recent highs and selling pressure. Next Resistance: $3,600 – round number and likely target if bullish momentum continues. Immediate Support: $3,510 – a short-term reference; a break could trigger a deeper correction. Relevant Support: $3,499.57 – confluence zone from the last impulse, acting as strong support for the recent bullish move. Technical Indicators RSI: ~39.41%, in oversold territory, suggesting potential price recovery. MACD: bearish signal, with a negative histogram reflecting fatigue in the bullish impulse. Moving Averages: price comfortably above the 50-day average, maintaining the underlying bullish trend. Point of Control (POC): $4,777.97 in the previous accumulation zone. Probable Scenarios The technical bias remains bullish as long as gold holds relevant support and stays above the POC. However, oversold conditions increase the likelihood of temporary sideways consolidation to prepare for new highs. A drop below $3,457 would test the 200-day moving average and challenge the current trend, though institutional buyers may use the $3,510 support area to reposition. The recent surge has pushed prices above a long-term range recently broken with some force, suggesting a potential revisit of supporting trend lines to retest and surpass current highs. Planned Fiat Devaluation and Return to the Gold Standard? Gold sits at an inflection point where structural and technical forces converge. On one hand, the hypothesis of an official revaluation of U.S. reserves introduces a potentially transformative factor that could start a broad new bull cycle. The market shows a clear underlying positive trend with necessary consolidation phases. For institutions, gold is gaining appeal as a hedge against U.S. fiscal risk, dollar pressure, and uncertainty. In the short term, the market is defending supports and seeking to recover above the 50-day moving average. Long-term institutional accumulation and global monetary policy reinforce the thesis that gold will continue playing a central role in the international financial architecture—not just as a safe haven, but as a backbone of the future monetary system. Europe, and particularly Spain, will need to take measures to position its reserves strategically in line with this trend. ******************************************************************************************* The information provided does not constitute investment research. The material has not been prepared in accordance with the legal requirements designed to promote the independence of investment research and such should be considered a marketing communication. All information has been prepared by ActivTrades ("AT"). The information does not contain a record of AT's prices, or an offer of or solicitation for a transaction in any financial instrument. No representation or warranty is given as to the accuracy or completeness of this information. Any material provided does not have regard to the specific investment objective and financial situation of any person who may receive it. Past performance and forecasting are not a synonym of a reliable indicator of future performance. AT provides an execution-only service. Consequently, any person acting on the information provided does so at their own risk. Political risk is unpredictable. Central bank actions can vary. Platform tools do not guarantee success.
ActivTrades
Robinhood and USDC: Cryptoland Predicting the Future

Ion Jauregui – Analyst at ActivTrades Robinhood (NASDAQ: HOOD) is not only focused on stocks and cryptocurrencies; it is now taking a bold step into sports prediction markets. Thanks to its integration with Kalshi, the app will allow users to bet on NFL and NCAA outcomes throughout the regular season. This move, presented as a “prediction market” to avoid conflicts with the CFTC, demonstrates Robinhood’s intention to become the “one-stop shop” for the modern investor, combining finance, entertainment, and cryptocurrencies. Kalshi, Robinhood’s technology partner, accepts payments in USDC, Bitcoin, Solana, and WLD, directly integrating the stablecoin ecosystem into betting and predictions. This approach highlights the growing importance of stablecoins as a vehicle for liquidity and digital transactions. Interest in USDC is accelerating alongside the regulatory clarity provided by the recent GENIUS Act, which establishes federal standards for stablecoins. According to a Goldman Sachs report, the global stablecoin market, valued at $271 billion, could see a significant boost for USDC, with projected growth of $77 billion between 2024 and 2027. Circle, the issuer of USDC, stands to benefit from reserve transparency and a favorable regulatory environment, positioning itself against Tether in the so-called “stablecoin gold rush.” Robinhood (Ticker AT: HOOD) continues gaining ground. Robinhood has confirmed that it is still in full expansion. In Q2 2025, the platform reported revenues of $989 million, a 45% increase compared to the same period last year, while net profit doubled, rising 105%, demonstrating that its business model remains profitable. The company is not only focused on stock trading but has diversified its offerings. With premium services such as Robinhood Gold, a new credit card, the Robinhood Legend platform, and the acquisition of Bitstamp, Robinhood aims to consolidate its presence in the cryptocurrency and futures markets, diversifying its revenue streams. The company’s ambitious goal is to capture a significant share of the estimated $84 trillion wealth transfer to younger generations over the next two decades. From a technical perspective, HOOD shares are trading at $105.34 as of yesterday, up 182% over the past year, confirming a sustained upward trend. Technical Currently, Robinhood shares trade at $105.34, with a P/E ratio of 46.21 and EPS of 1.96. Over the past year, the stock has risen 182.72%, showing a strong upward trend. Yesterday’s bearish close after hitting a high of $117.70 for the second time in August suggests the bullish momentum may require more volume to continue. The RSI at 50.15% and MACD entering negative territory, along with a Point of Control (POC) at $49.11 (less than half of the current price), could signal a potential price correction despite the hype and high expectations. The volume over the last two sessions has been relatively high (56.52M vs. 41.47M), suggesting a possible pause in the rally, provided strong support levels at $90 and $96.86 hold. The price has lost support from the 50-day moving average but remains above the 100-day moving average. USDC: The Stablecoin That Keeps Growing In the cryptocurrency world, USDC continues to strengthen its position. The stablecoin issued by Circle has seen its circulation exceed $65.2 billion, a 90% increase over the past year, reflecting growing confidence from both institutional and retail investors. Although Circle reported revenues of $658 million in Q2 2025, up 53% from last year, it still shows a net loss of $482 million due to accounting adjustments related to its IPO. However, recent stablecoin regulation (GENIUS Act) has provided greater security for users and boosted institutional adoption of USDC as a payment method and store of value. Technical Practically speaking, USDC continues to fulfill its goal: maintaining parity with the US dollar, trading steadily at $1, offering confidence in a volatile market. Its stability, backed by liquid and secure assets, reinforces its position as one of the most reliable stablecoins. Yesterday’s session saw a correction from a high of $1.00050 to today’s price of $0.99997. The RSI today is around 50.79%, and the MACD indicates an expansion of the bullish trend. Looking Ahead: Innovation and Stability Hand in Hand Robinhood and USDC are not just individual market movements but part of an interconnected financial ecosystem. While Robinhood expands into prediction and financial entertainment markets, USDC solidifies its role as a reliable stablecoin, driven by regulation and institutional trust. The combination of technological innovation, product diversification, and regulatory stability is redefining how we interact with markets. For investors, this is not just a trend—it is a clear signal that digital finance is evolving from an experiment into global infrastructure. Those who identify these opportunities could benefit from both growth in prediction markets and the widespread adoption of regulated stablecoins. In short: Robinhood predicts, USDC supports, and the digital market moves toward a more integrated and secure future. ******************************************************************************************* La información facilitada no constituye un análisis de inversiones. El material no se ha elaborado de conformidad con los requisitos legales destinados a promover la independencia de los informes de inversiones y, como tal, debe considerarse una comunicación comercial. Toda la información ha sido preparada por ActivTrades ("AT"). La información no contiene un registro de los precios de AT, o una oferta o solicitud de una transacción en cualquier instrumento financiero. Ninguna representación o garantía se da en cuanto a la exactitud o integridad de esta información. Cualquier material proporcionado no tiene en cuenta el objetivo específico de inversión y la situación financiera de cualquier persona que pueda recibirlo. La rentabilidad pasada y las estimaciones no sinónimo ni un indicador fiable de la rentabilidad futura. AT presta un servicio exclusivamente de ejecución. En consecuencia, toda persona que actúe sobre la base de la información facilitada lo hace por su cuenta y riesgo. Los tipos de interés pueden cambiar. El riesgo político es impredecible. Las acciones de los bancos centrales pueden variar. Las herramientas de las plataformas no garantizan el éxito.
إخلاء المسؤولية
أي محتوى ومواد مدرجة في موقع Sahmeto وقنوات الاتصال الرسمية هي عبارة عن تجميع للآراء والتحليلات الشخصية وغير ملزمة. لا تشكل أي توصية للشراء أو البيع أو الدخول أو الخروج من سوق الأوراق المالية وسوق العملات المشفرة. كما أن جميع الأخبار والتحليلات المدرجة في الموقع والقنوات هي مجرد معلومات منشورة من مصادر رسمية وغير رسمية محلية وأجنبية، ومن الواضح أن مستخدمي المحتوى المذكور مسؤولون عن متابعة وضمان أصالة ودقة المواد. لذلك، مع إخلاء المسؤولية، يُعلن أن المسؤولية عن أي اتخاذ قرار وإجراء وأي ربح وخسارة محتملة في سوق رأس المال وسوق العملات المشفرة تقع على عاتق المتداول.