تحليل التحليل الفني Pepperstone حول PAXG في رمز في 2/10/2025
Pepperstone
نوسان شدید طلا: آیا این آشفتگی ادامه خواهد یافت؟ (تحلیل فنی و سطوح کلیدی)
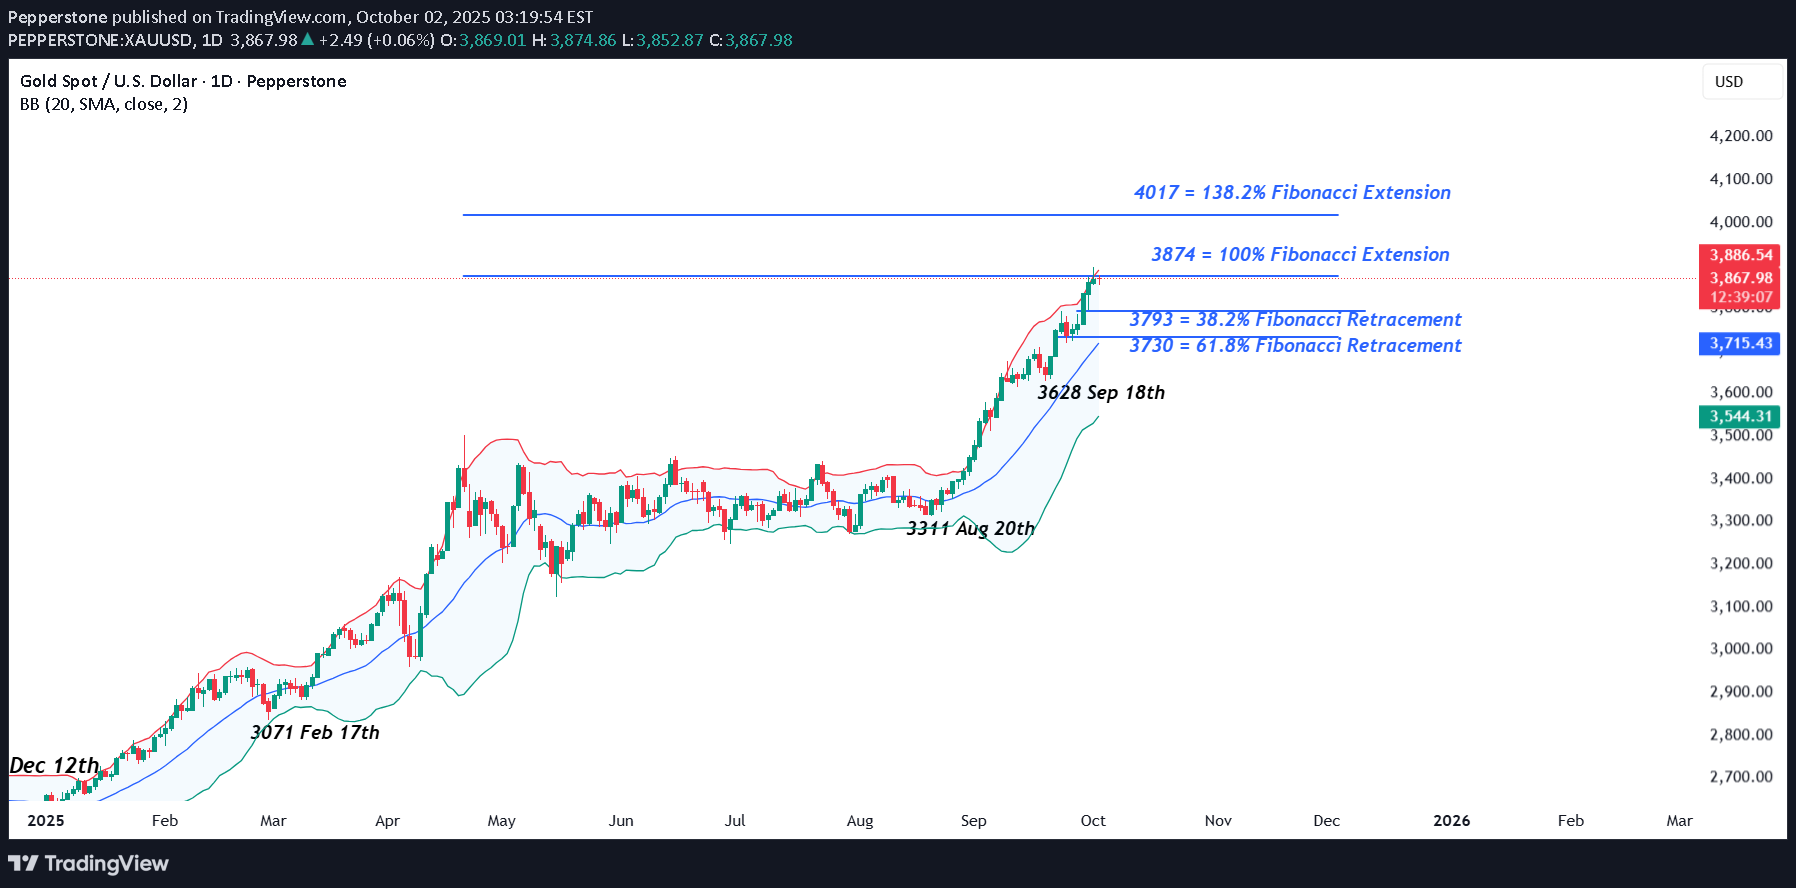
Gold has experienced a rollercoaster week up to this point as traders dealt with portfolio rebalancing into the end of Q3 on Tuesday and the fallout from a US government shutdown, which went into effect on Wednesday morning as Republican’s and Democrat’s failed to agree a new funding package for the first time in seven years. Add to that, central bank buying of price dips as a diversification away from the dollar, geo-political risks and uncertainty about the next interest rate moves from the Federal Reserve (Fed) into the end of 2025, and traders may be asking the question, is Gold volatility here to stay? In the short term, the answer could be yes. So far this week, Gold prices opened on Monday at 3760 and rallied 3%, breaking above the previous all-time high of 3791, to see a new peak of 3872 on Tuesday morning. They then reversed course, dropping back 2% to 3793, before resuming the uptrend again on Wednesday, as the start of the US government shutdown commenced. Trading 2.7% higher to a new record high of 3895. Wow! Gold is one of the most popular safe haven assets for traders and right now there is a lot of uncertainty fuelling its demand, especially through ETFs as investors rush to find a hedge for any problems that may materialise if US lawmakers can’t reach an agreement before the weekend. One major issue created by the shutdown is the delay of Friday’s US Payrolls number. Traders were relying on this update to help them clarify the potential for a further interest rate cut from the Fed at their next meeting on October 29th. Fed policymakers, speaking this week, have provided mixed outlooks on interest rates, which has further muddied the water in this area, underpinning the move higher. However, Gold long positioning does at times get extended as Tuesday’s drop highlights. With the Gold price currently trading near it’s all time highs (3868 0700 BST), it could be susceptible to downside pressure from a liquidation of weak long positioning caused, for example, by any headlines confirming a breakthrough in talks between Democrats and Republicans. As suggested above, short term Gold volatility could continue into the weekend, and in this regard assessing the technical outlook to identify key support and resistance areas that may be relevant could be useful. Technical Update: Challenging Extension Resistance Since the August 20th low into yesterday new all-time high, Gold has advanced 17.6%, in what has been an almost uninterrupted phase of price strength. This has been reflected by the consistent posting of higher highs and higher lows in price, maintaining positive investor sentiment. This move has defied some traders’ expectations that overbought or overextended conditions might stall the advance or even trigger weakness. As the chart above shows, that hasn’t materialised. However, prices did test a potential resistance focus at 3874 yesterday, a level equal to the 100% Fibonacci extension, which has so far successfully capped the advance on a closing basis. The question now is whether this marks the extent of the current price strength in Gold, or if it’s a pause before further upside attempts emerge. While it's impossible to answer definitively at this stage, it’s increasingly important to identify and monitor key support and resistance levels in Gold. Should volatility pick up, these technical markers could prove important in assessing directional risk. Potential Support Levels: Price corrections following strong advances are a typical market response to short-term upside overextension, and Gold may well be entering such a phase. Traders could now focus on 3793 as the first key support, which is the 38.2% Fibonacci retracement of the latest rally. This level holding if price weakness is seen, could stabilise sentiment, while a closing break lower may lead to a deeper pullback. A closing break below 3793 wouldn’t necessarily signal a shift in downside sentiment, but it could open tests of 3730, the deeper 61.8% Fibonacci retracement, a level that may offer stronger support if the sell-off extends. Potential Resistance Levels: Gold has stalled so far at 3874, the 100% extension level, which now marks initial resistance. If the uptrend from the August 20th low is to persist, a close above 3874 may lead to a more extended phase of price strength. While not a guarantee of further price upside, successful closes above 3874 might trigger renewed attempts at strength in Gold, possibly opening scope toward 4017, the 138.2% Fibonacci extension, a level that may then act as the next main resistance area. The material provided here has not been prepared accordance with legal requirements designed to promote the independence of investment research and as such is considered to be a marketing communication. Whilst it is not subject to any prohibition on dealing ahead of the dissemination of investment research, we will not seek to take any advantage before providing it to our clients. Pepperstone doesn’t represent that the material provided here is accurate, current or complete, and therefore shouldn’t be relied upon as such. The information, whether from a third party or not, isn’t to be considered as a recommendation; or an offer to buy or sell; or the solicitation of an offer to buy or sell any security, financial product or instrument; or to participate in any particular trading strategy. It does not take into account readers’ financial situation or investment objectives. We advise any readers of this content to seek their own advice. Without the approval of Pepperstone, reproduction or redistribution of this information isn’t permitted.